After months of recovery, Bitcoin’s price has failed to break above K and has been decisively rejected to the downside. Yet, the uptrend may be far from over. Technical Analysis By TradingRage The Daily Chart On the daily chart, the price has been rejected from the K resistance level. Yet, the K support zone has held the market, preventing a deeper drop. The price consolidates between these two price levels, and breaking out in either direction is likely to dictate the market trend. If the market breaks the K level to the upside, Bitcoin will likely make a new all-time high in the coming months. However, a drop below the K level will likely result in a decline toward the 200-day moving average, around the K mark. Source: TradingViewThe 4-Hour Chart
Topics:
CryptoVizArt considers the following as important: Bitcoin (BTC) Price, BTC Analysis, BTCEUR, BTCGBP, btcusd, btcusdt
This could be interesting, too:
Chayanika Deka writes XRP, SOL, and ADA Inclusion in US Crypto Reserve Pushes Traders on Edge
Chayanika Deka writes Why Arthur Hayes Is Bullish on Bitcoin Under Trump’s Economic Strategy
Mandy Williams writes Why the Bitcoin Market Is Stuck—and the Key Metric That Could Change It: CryptoQuant CEO
Wayne Jones writes Metaplanet Acquires 156 BTC, Bringing Total Holdings to 2,391
After months of recovery, Bitcoin’s price has failed to break above $48K and has been decisively rejected to the downside.
Yet, the uptrend may be far from over.
Technical Analysis
By TradingRage
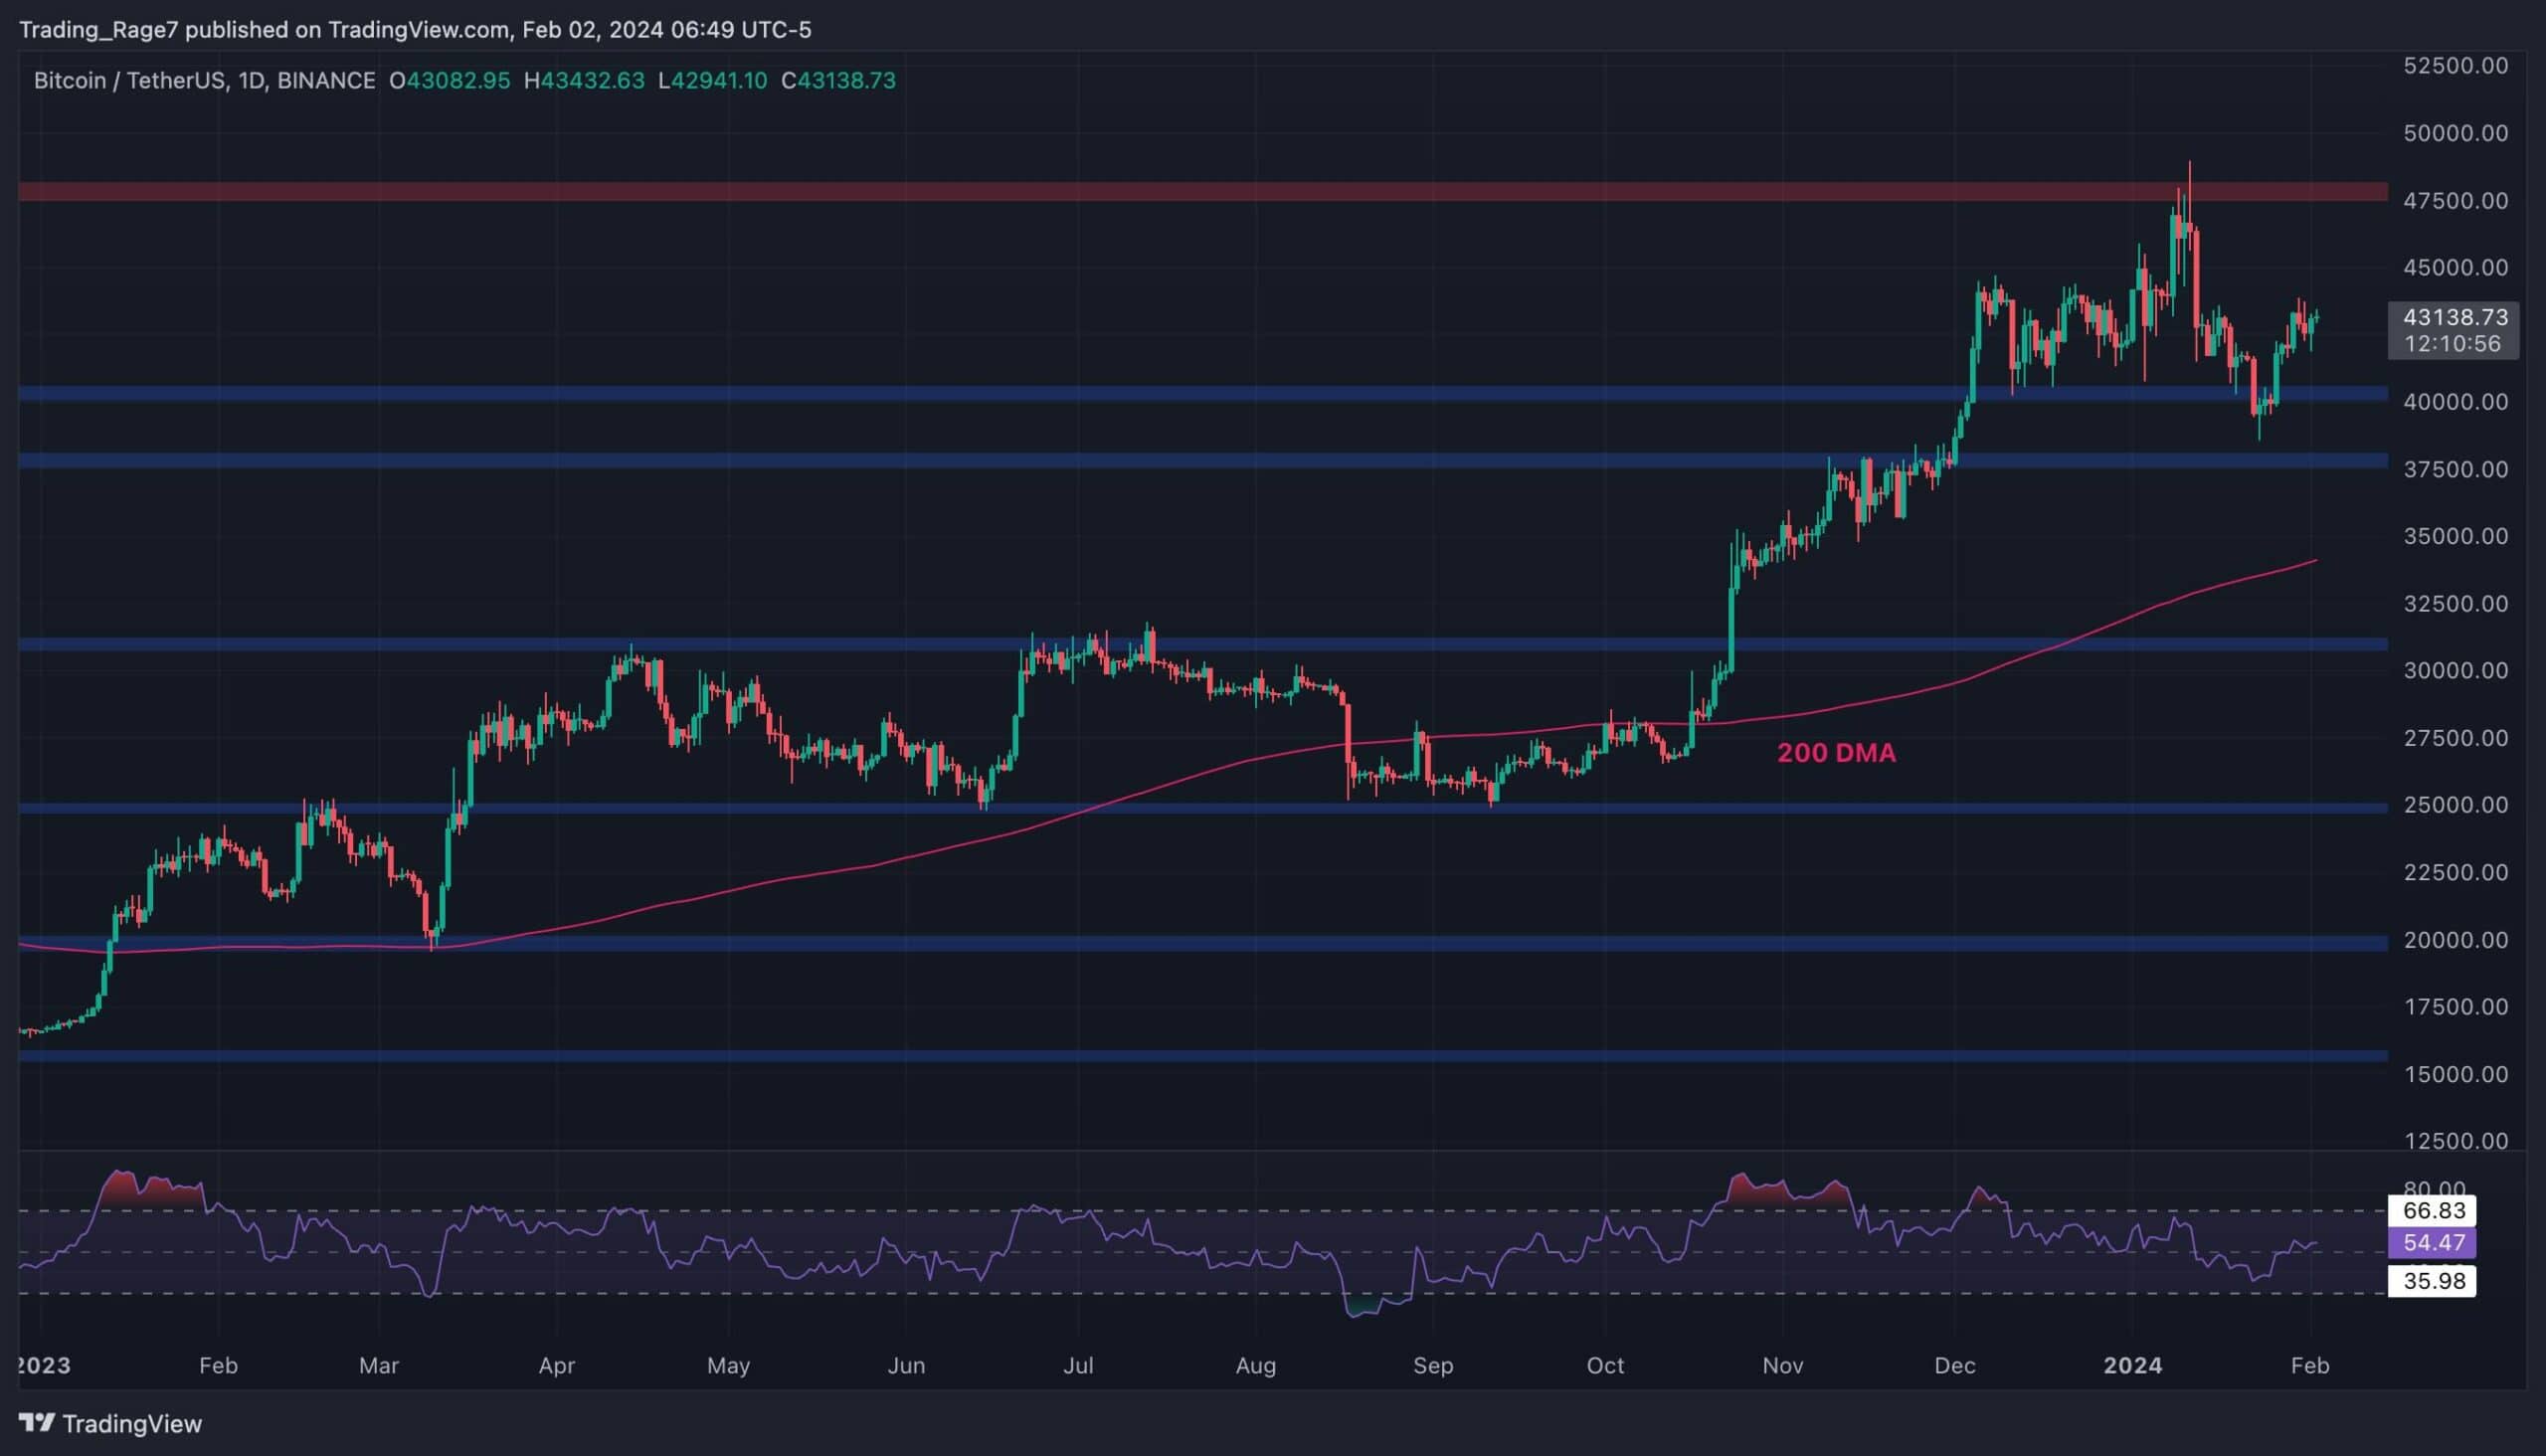
The Daily Chart
On the daily chart, the price has been rejected from the $48K resistance level. Yet, the $40K support zone has held the market, preventing a deeper drop. The price consolidates between these two price levels, and breaking out in either direction is likely to dictate the market trend.
If the market breaks the $48K level to the upside, Bitcoin will likely make a new all-time high in the coming months. However, a drop below the $40K level will likely result in a decline toward the 200-day moving average, around the $35K mark.
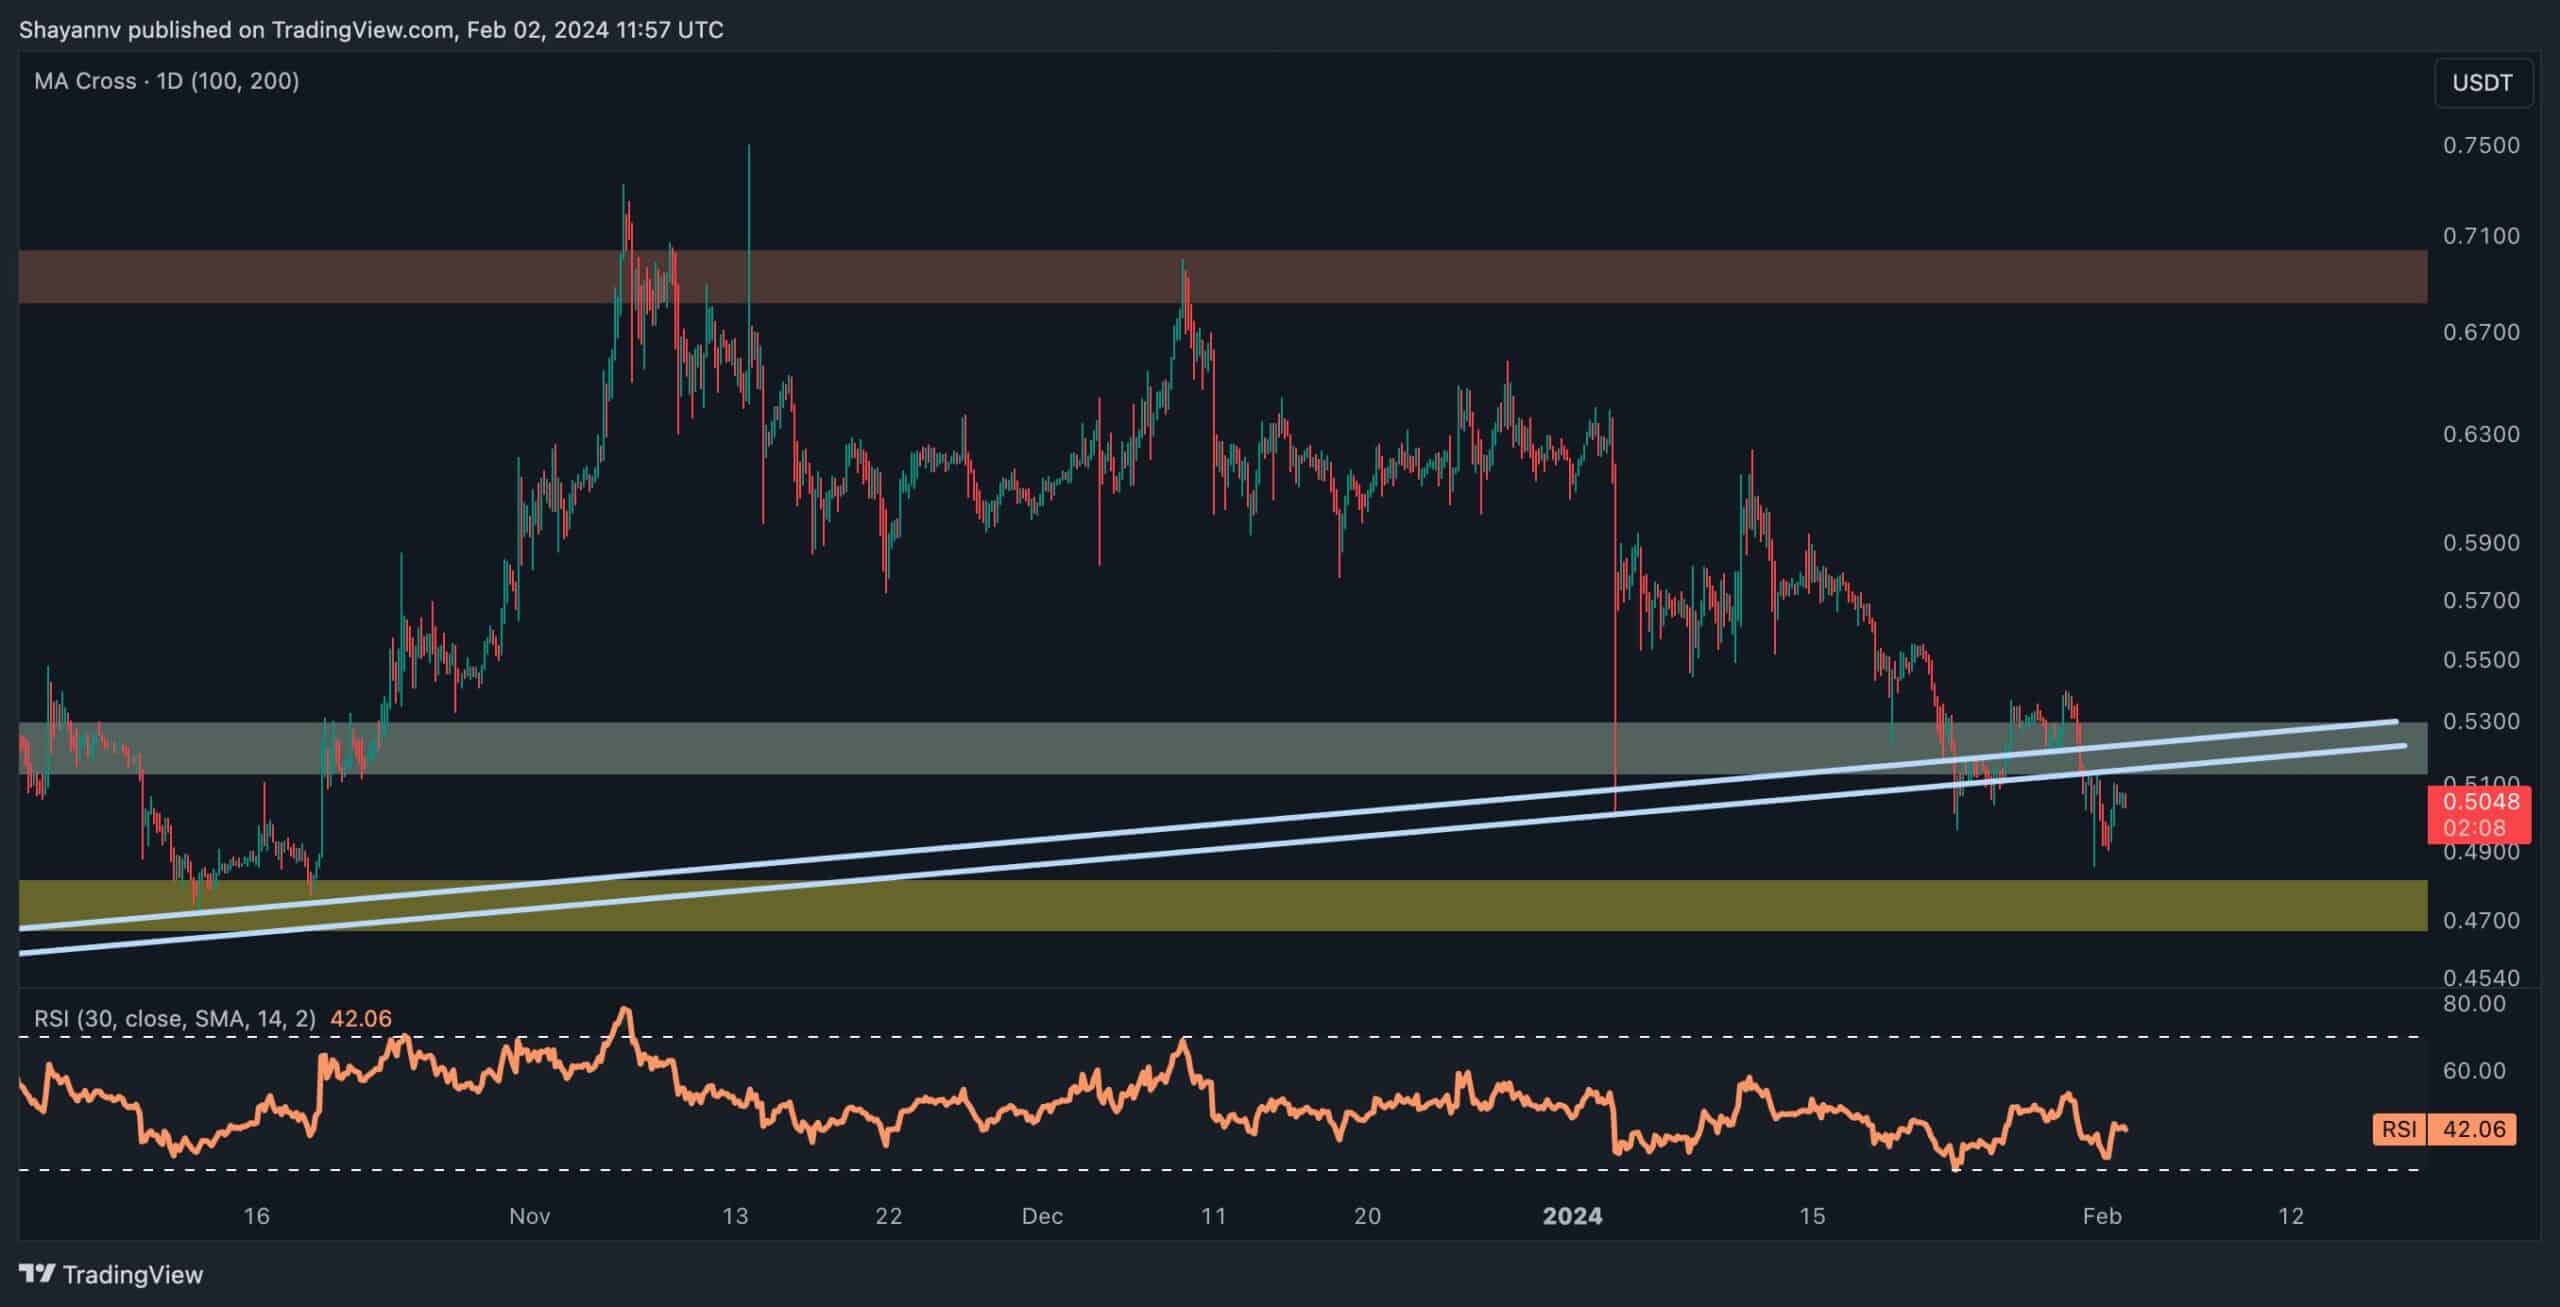
The 4-Hour Chart
Looking at the 4-hour timeframe, the Bitcoin price has demonstrated a fake breakout below the $40K level before quickly recovering above.
The market is currently testing the $43K level. If it’s successful in pushing above it, this might lead to a rally toward $45K and even the $48K resistance zone. The Relative Strength Index is also showing values above 50%, indicating that the momentum is in favor of an upward movement.
On-Chain Analysis
By TradingRage
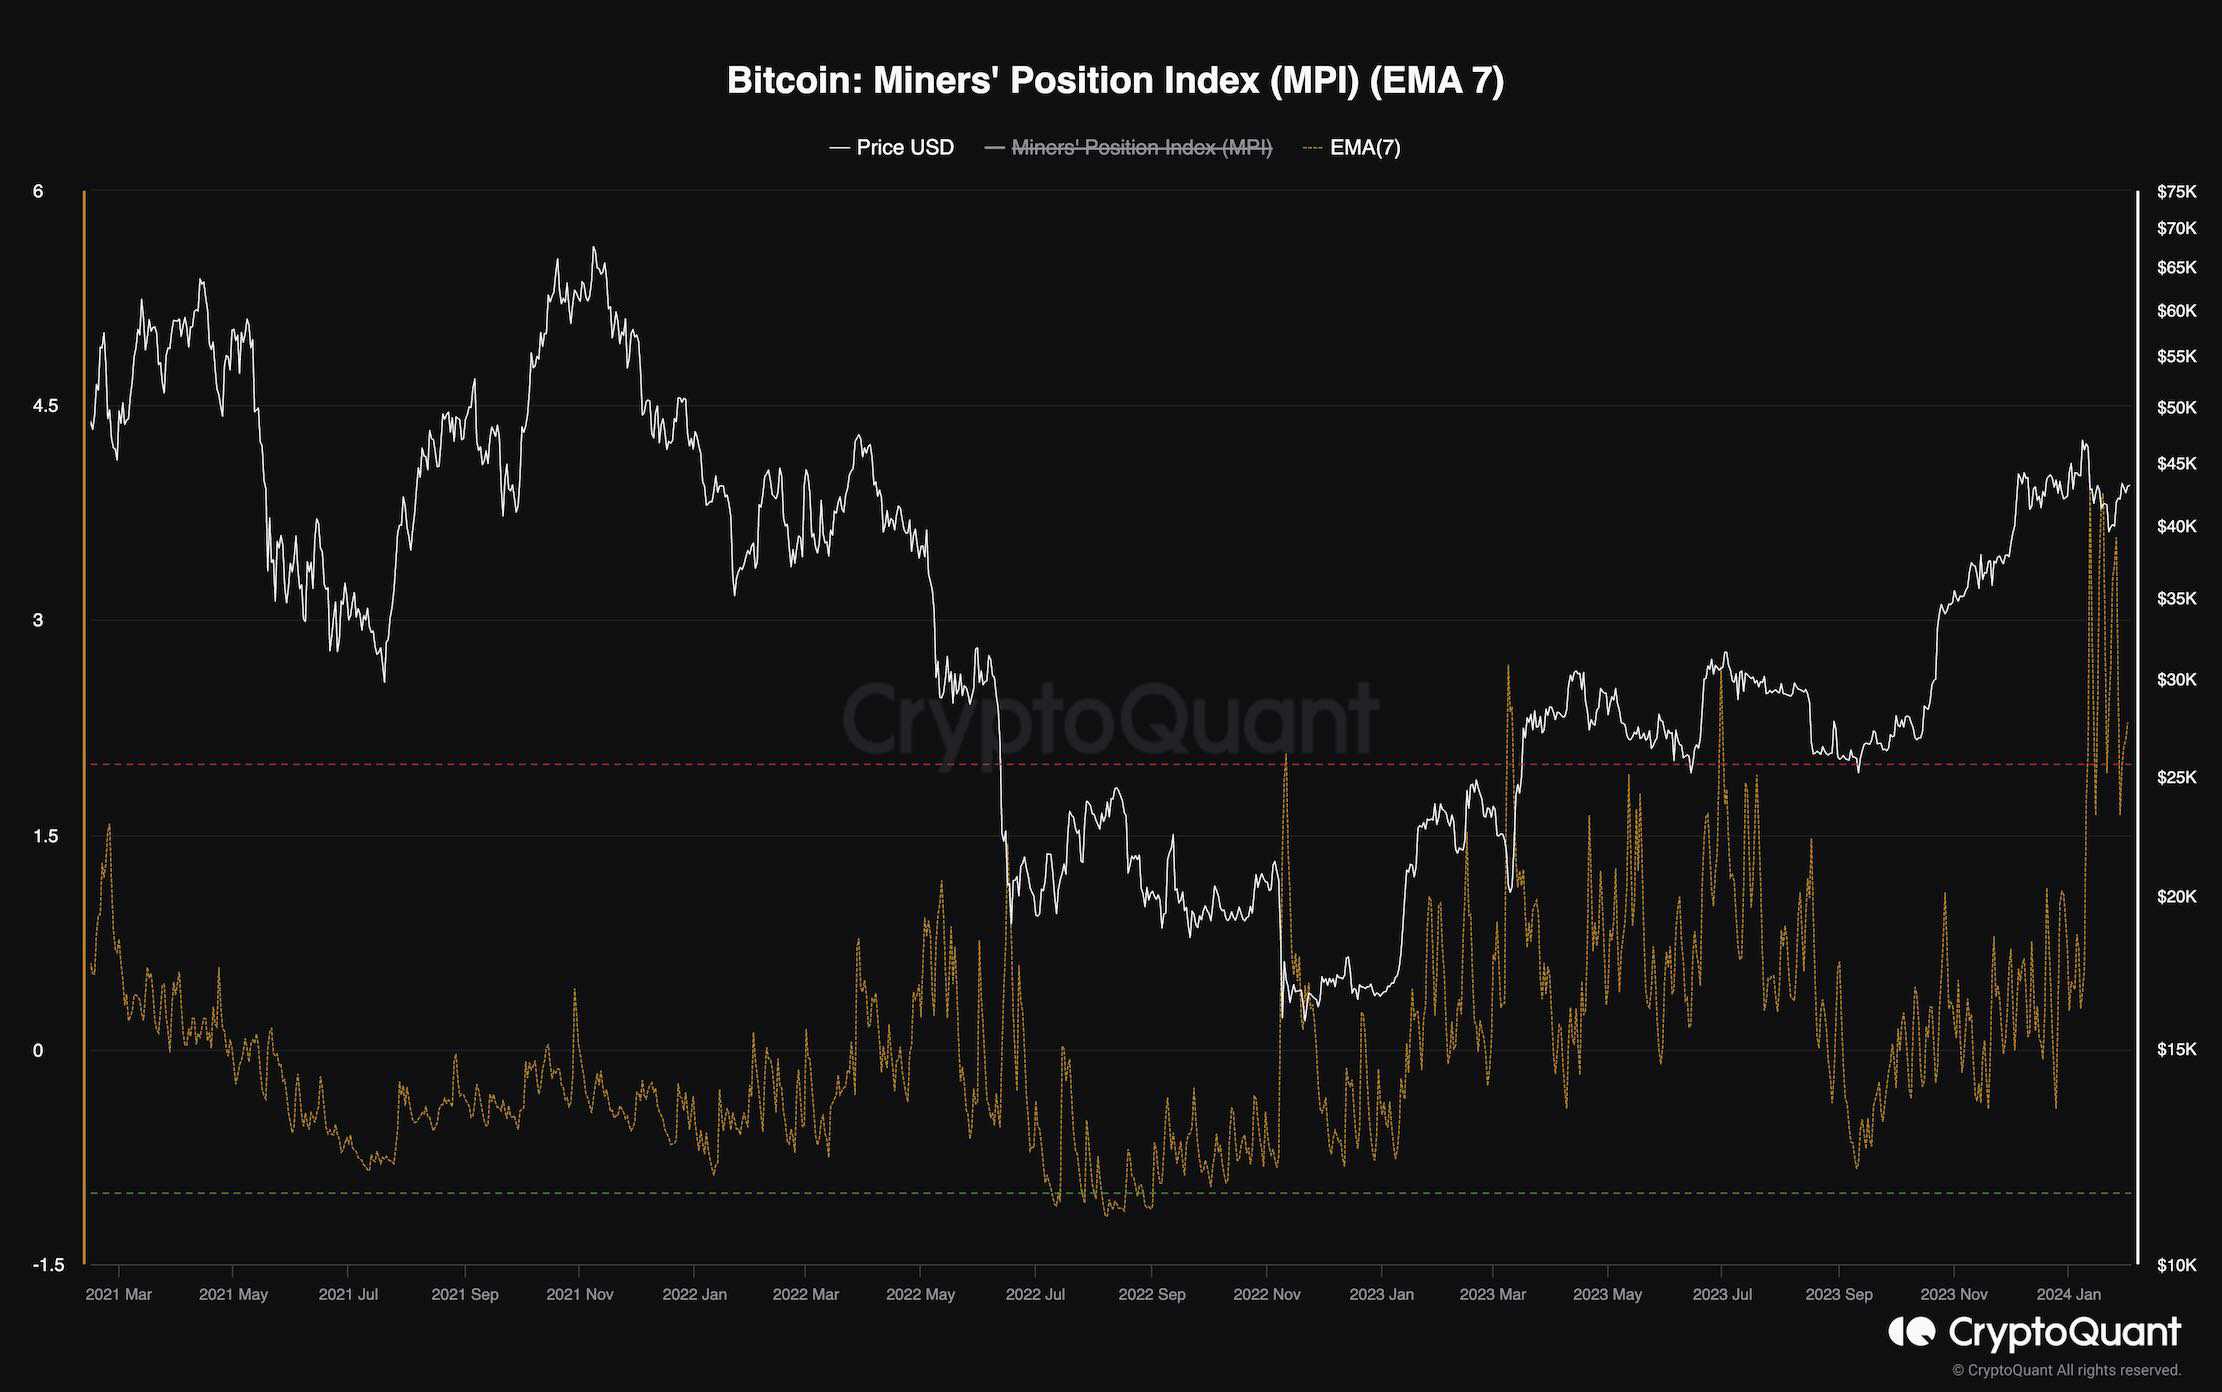
Bitcoin Miners Position Index (EMA 7)
Bitcoin’s price has been consolidating below the $48K resistance level for some time now, failing to break to the upside. Meanwhile, investors are wondering whether the market is topping out or the bullish trend will continue.
This chart presents the 7-day exponential moving average of the Miners Position Index (MPI). The MPI metric is the ratio of total miner outflow to the one-year moving average of total miner outflow. Higher values indicate that miners are sending more coins than usual, which is likely for selling.
At the moment, the MPI metric is showing unusually high values, suggesting that the miners have been selling their coins in significant chunks. If this trend continues, the price is likely to reverse to the downside as a result of excess selling pressure.