Bitcoin’s price is continuing its gradual rise toward the K resistance level following a few weeks of consolidation. While the trend lacks momentum, the price might be about to begin an aggressive rally higher. Technical Analysis By TradingRage The Daily Chart On the daily timeframe, the price has been consolidating above the K level for the last few weeks. However, it is climbing higher, approaching the K resistance zone. Meanwhile, the Relative Strength Index is also demonstrating values above 50%, pointing to the fact that the momentum is in favor of the buyers. As a result, a rally toward the K level seems probable in the coming weeks. Source: TradingViewThe 4-Hour Chart Looking at the 4-hour chart, it is evident that the price action has been very choppy
Topics:
CryptoVizArt considers the following as important: Bitcoin (BTC) Price, BTC Analysis, BTCEUR, BTCGBP, btcusd, btcusdt
This could be interesting, too:
Chayanika Deka writes XRP, SOL, and ADA Inclusion in US Crypto Reserve Pushes Traders on Edge
Chayanika Deka writes Why Arthur Hayes Is Bullish on Bitcoin Under Trump’s Economic Strategy
Mandy Williams writes Why the Bitcoin Market Is Stuck—and the Key Metric That Could Change It: CryptoQuant CEO
Wayne Jones writes Metaplanet Acquires 156 BTC, Bringing Total Holdings to 2,391
Bitcoin’s price is continuing its gradual rise toward the $48K resistance level following a few weeks of consolidation. While the trend lacks momentum, the price might be about to begin an aggressive rally higher.
Technical Analysis
By TradingRage
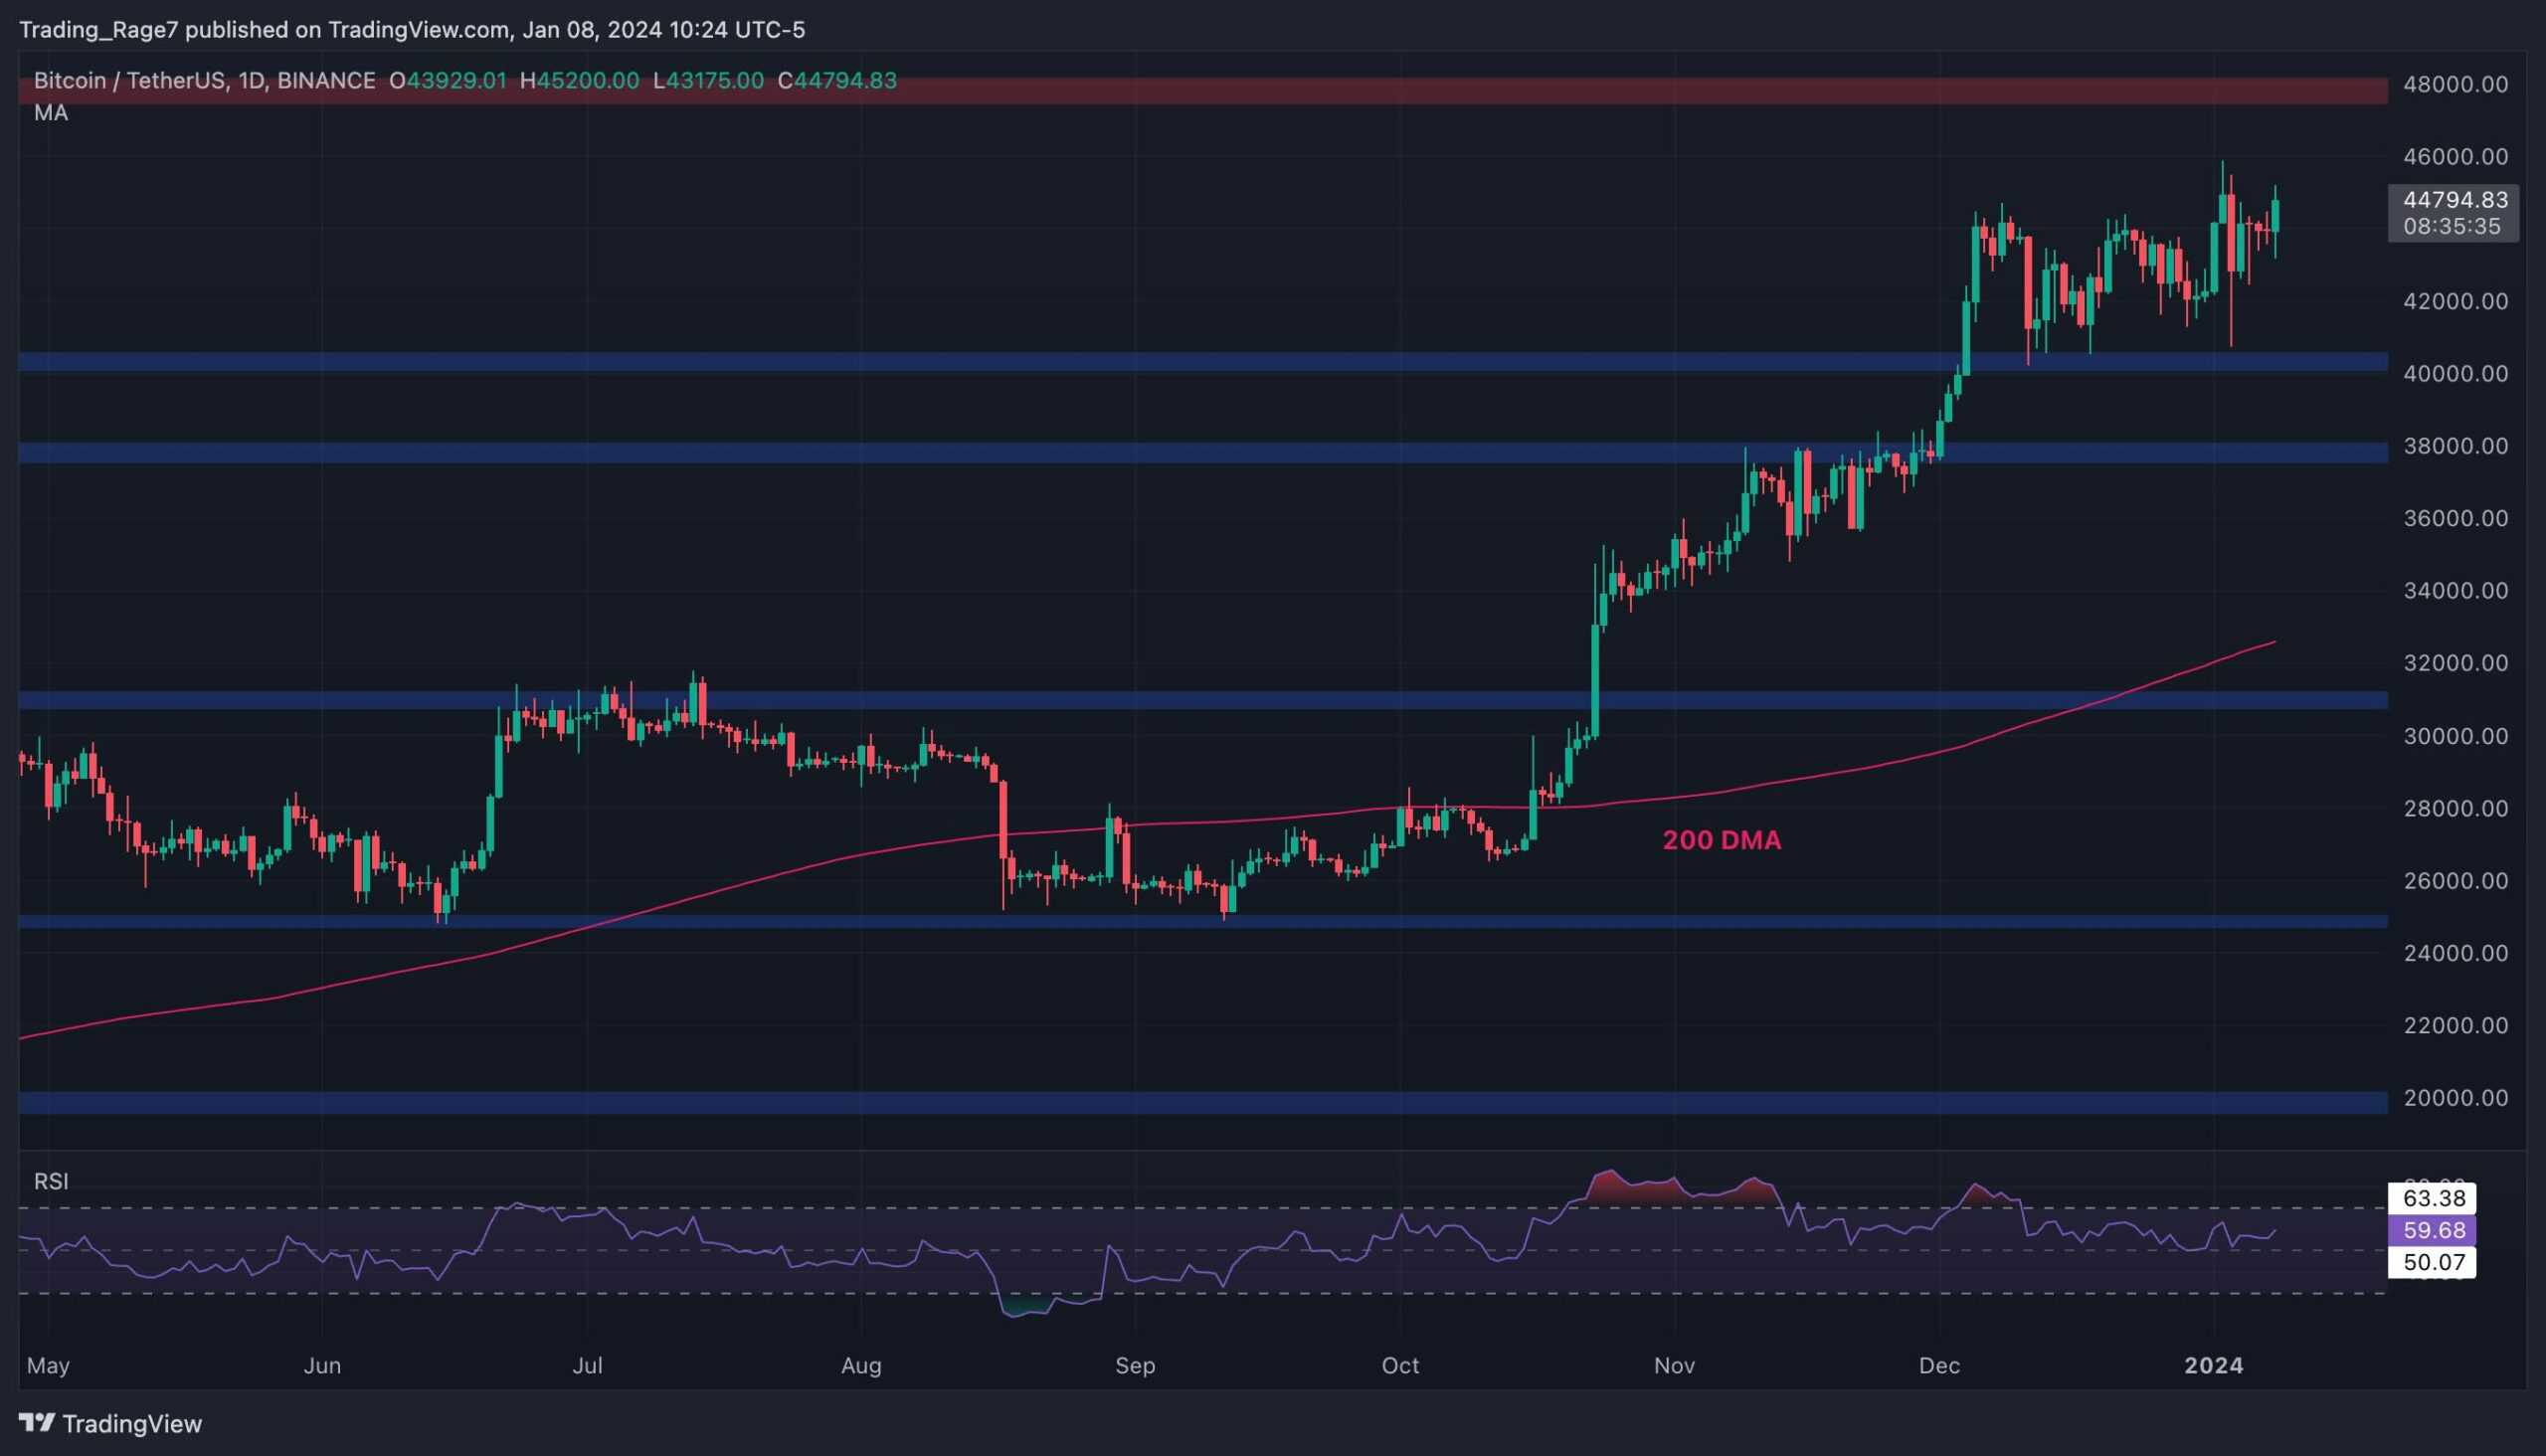
The Daily Chart
On the daily timeframe, the price has been consolidating above the $40K level for the last few weeks. However, it is climbing higher, approaching the $48K resistance zone.
Meanwhile, the Relative Strength Index is also demonstrating values above 50%, pointing to the fact that the momentum is in favor of the buyers. As a result, a rally toward the $48K level seems probable in the coming weeks.
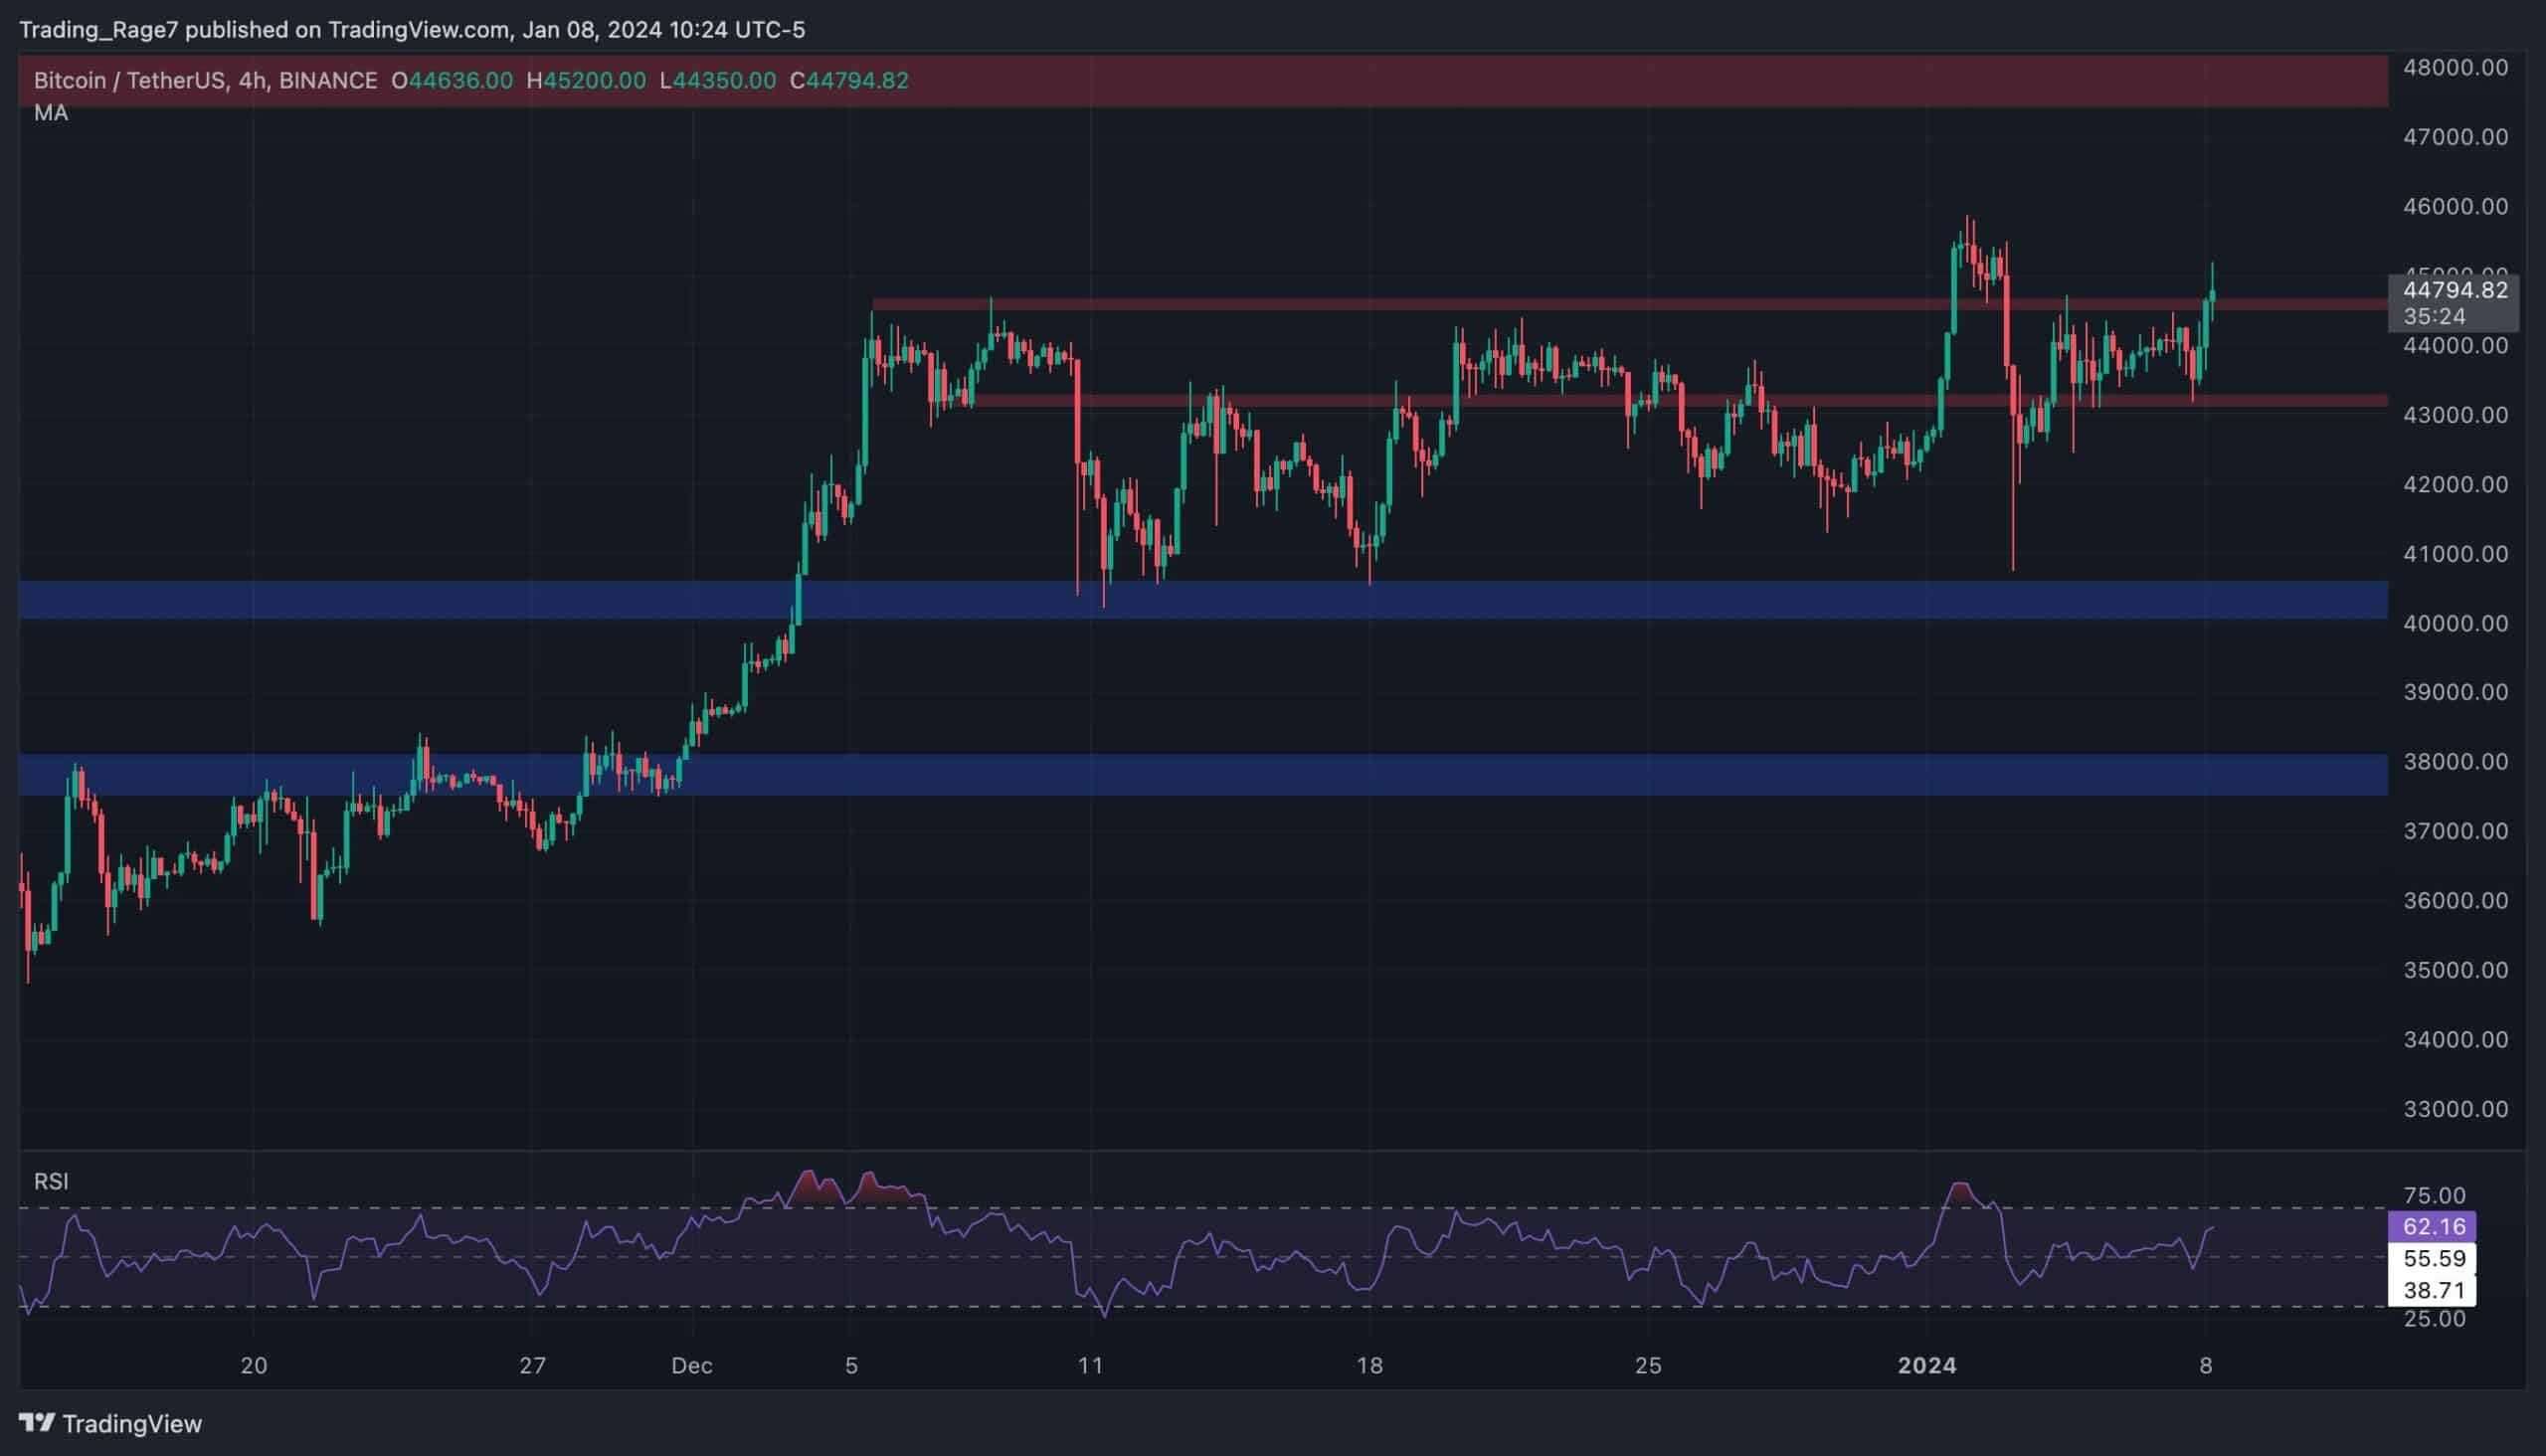
The 4-Hour Chart
Looking at the 4-hour chart, it is evident that the price action has been very choppy over the last few weeks. BTC has been trading between $40K and $45K for quite a while.
However, the price is currently breaking above the $45K resistance level. A valid breakout would pave the way for a bullish continuation toward the key $48K resistance level. The reaction to this level would likely determine the mid-term price action for BTC and the whole crypto market.
On-Chain Analysis
By TradingRage
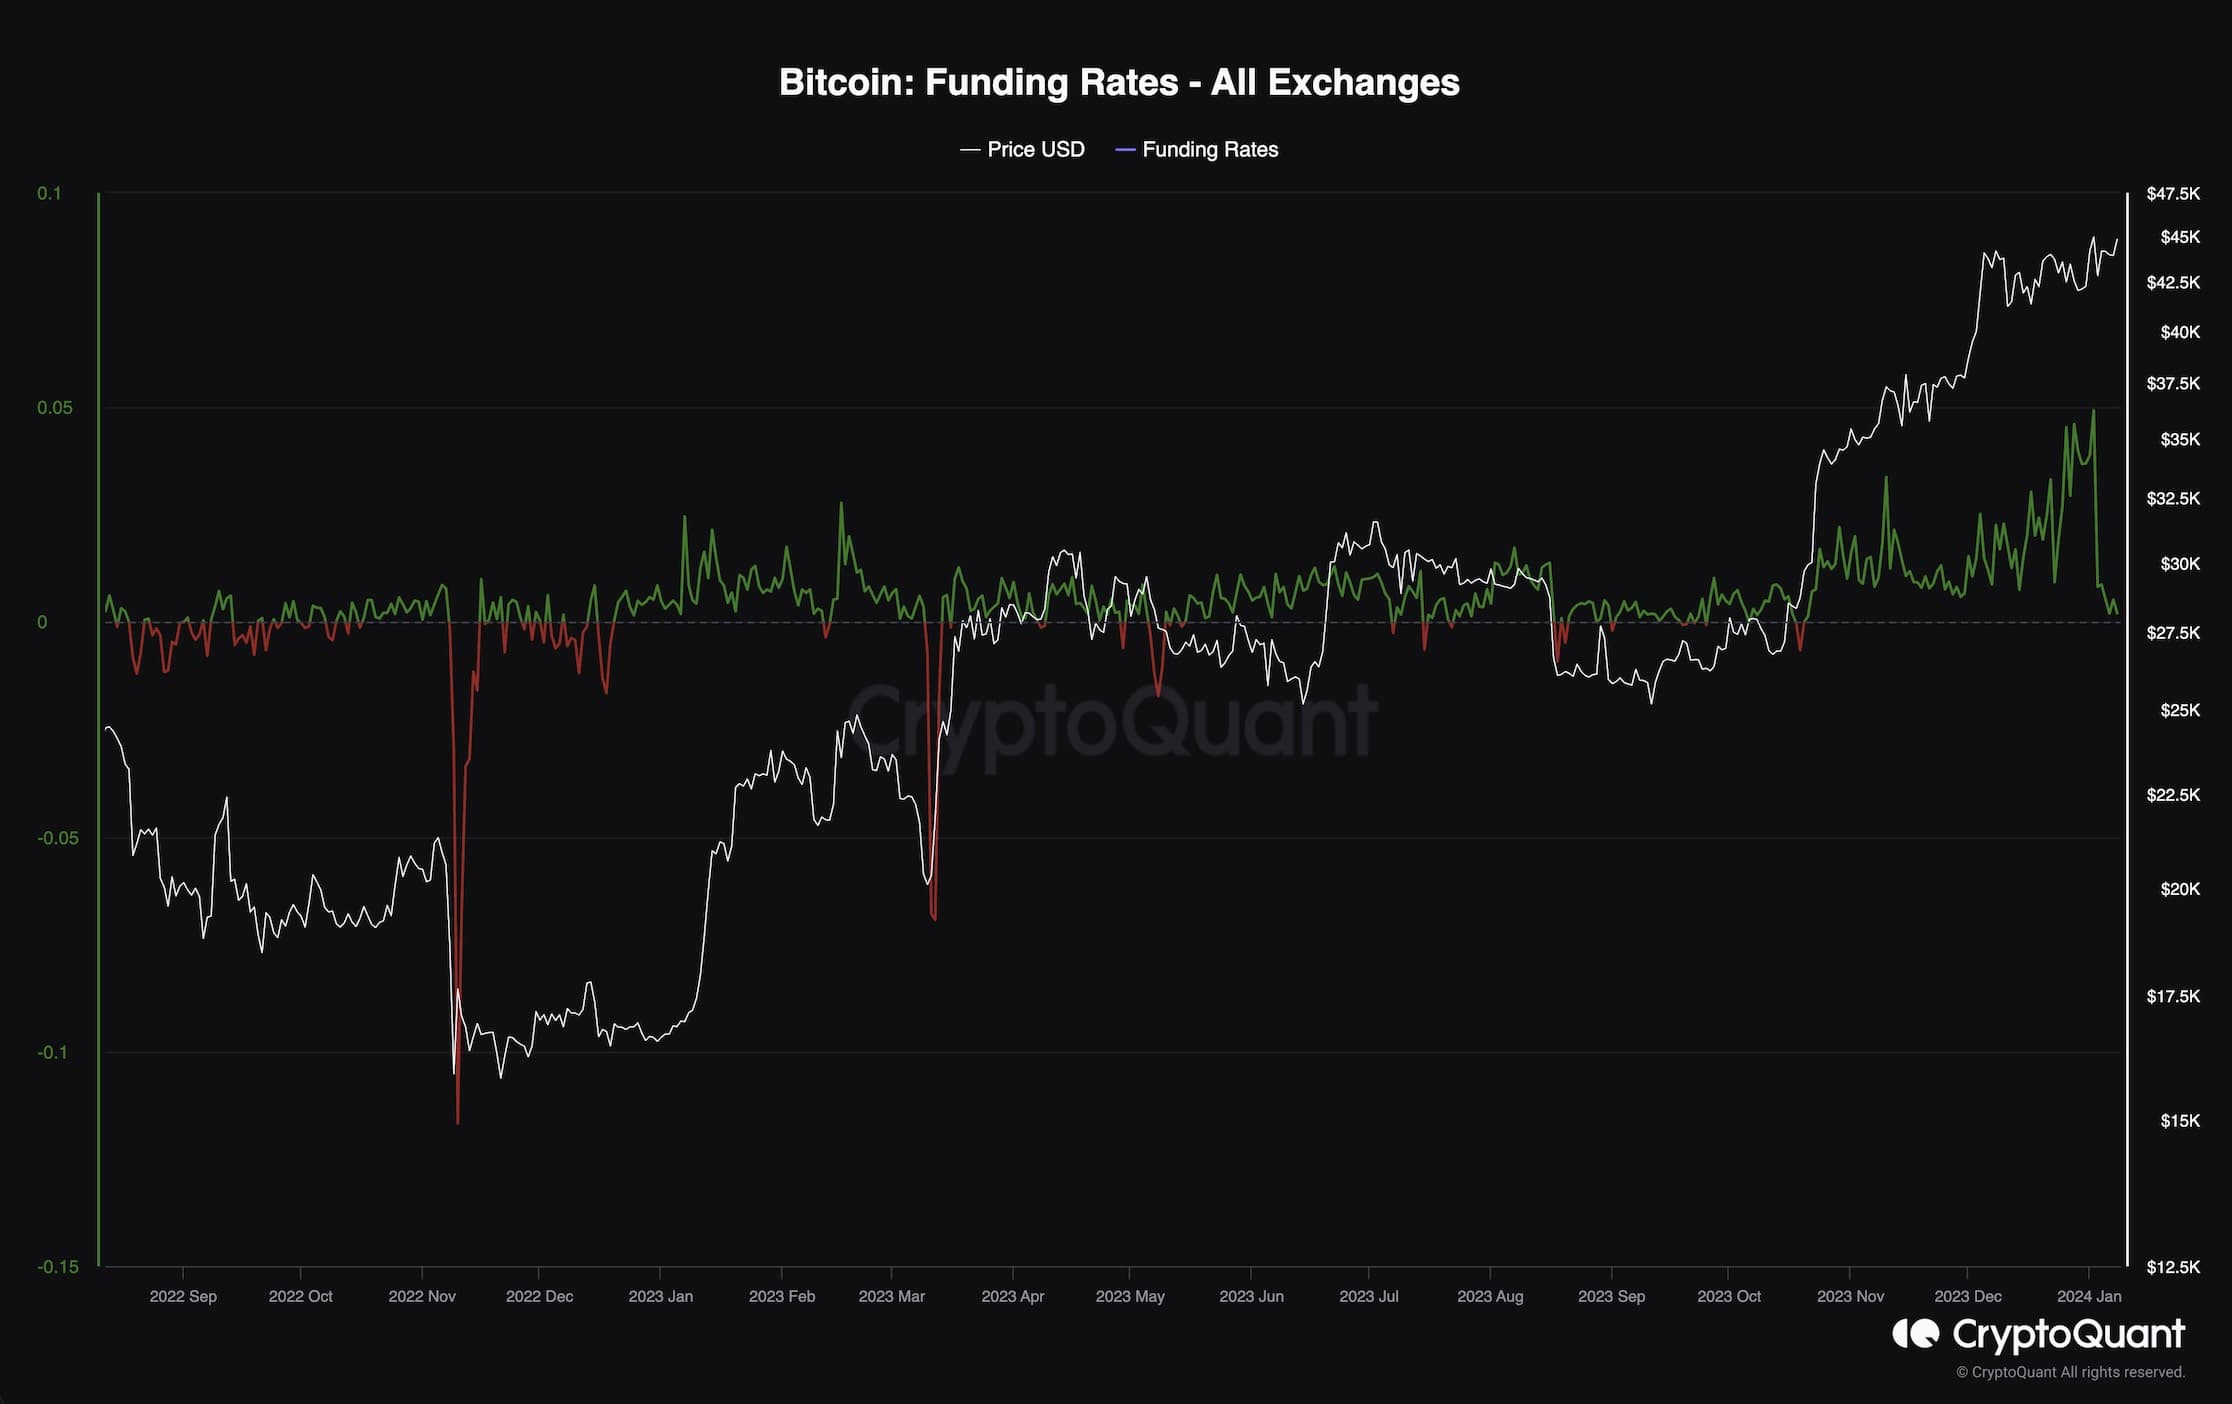
Bitcoin Funding Rates
While Bitcoin’s price is on the verge of breaking above the $45K level, market participants are wondering whether the current uptrend is sustainable. To provide an answer to this question, analyzing the futures market sentiment can be beneficial.
This chart presents the Bitcoin funding rates metric, which is one of the key metrics when it comes to future sentiment analysis. It indicates whether the buyers or the sellers are executing their orders more aggressively. Positive values are associated with positive sentiment, while values below zero indicate negative sentiment.
It is evident that with the recent short-term correction, the funding rates have plunged significantly. Yet, the metric is still showing positive values. This can be interpreted as a good sign, as it indicates that while the futures market is not overheated anymore, the sentiment is still bullish, and the trend can be a sustainable one.