Bitcoin’s price has been consolidating since early March, failing to continue its uptrend. Yet, the cryptocurrency might soon get back on track and create a new all-time high. Bitcoin Price Analysis: Technicals By TradingRage The Daily Chart On the daily chart, the Bitcoin price has been consolidating between the K and K levels over the past couple of weeks. The recent rejection from the K zone has driven it down toward the K support level. Yet, the level has held and initiated a rebound. The market is now expected to potentially retest K – an important resistance. On the other hand, if things go wrong and the price drops below K, the K-K area would be a probable target in the coming weeks. Source: TradingViewThe 4-Hour Chart Looking at the 4-hour
Topics:
CryptoVizArt considers the following as important: Bitcoin (BTC) Price, BTC Analysis, BTCEUR, BTCGBP, btcusd, btcusdt
This could be interesting, too:
Chayanika Deka writes XRP, SOL, and ADA Inclusion in US Crypto Reserve Pushes Traders on Edge
Chayanika Deka writes Why Arthur Hayes Is Bullish on Bitcoin Under Trump’s Economic Strategy
Mandy Williams writes Why the Bitcoin Market Is Stuck—and the Key Metric That Could Change It: CryptoQuant CEO
Wayne Jones writes Metaplanet Acquires 156 BTC, Bringing Total Holdings to 2,391
Bitcoin’s price has been consolidating since early March, failing to continue its uptrend. Yet, the cryptocurrency might soon get back on track and create a new all-time high.
Bitcoin Price Analysis: Technicals
By TradingRage
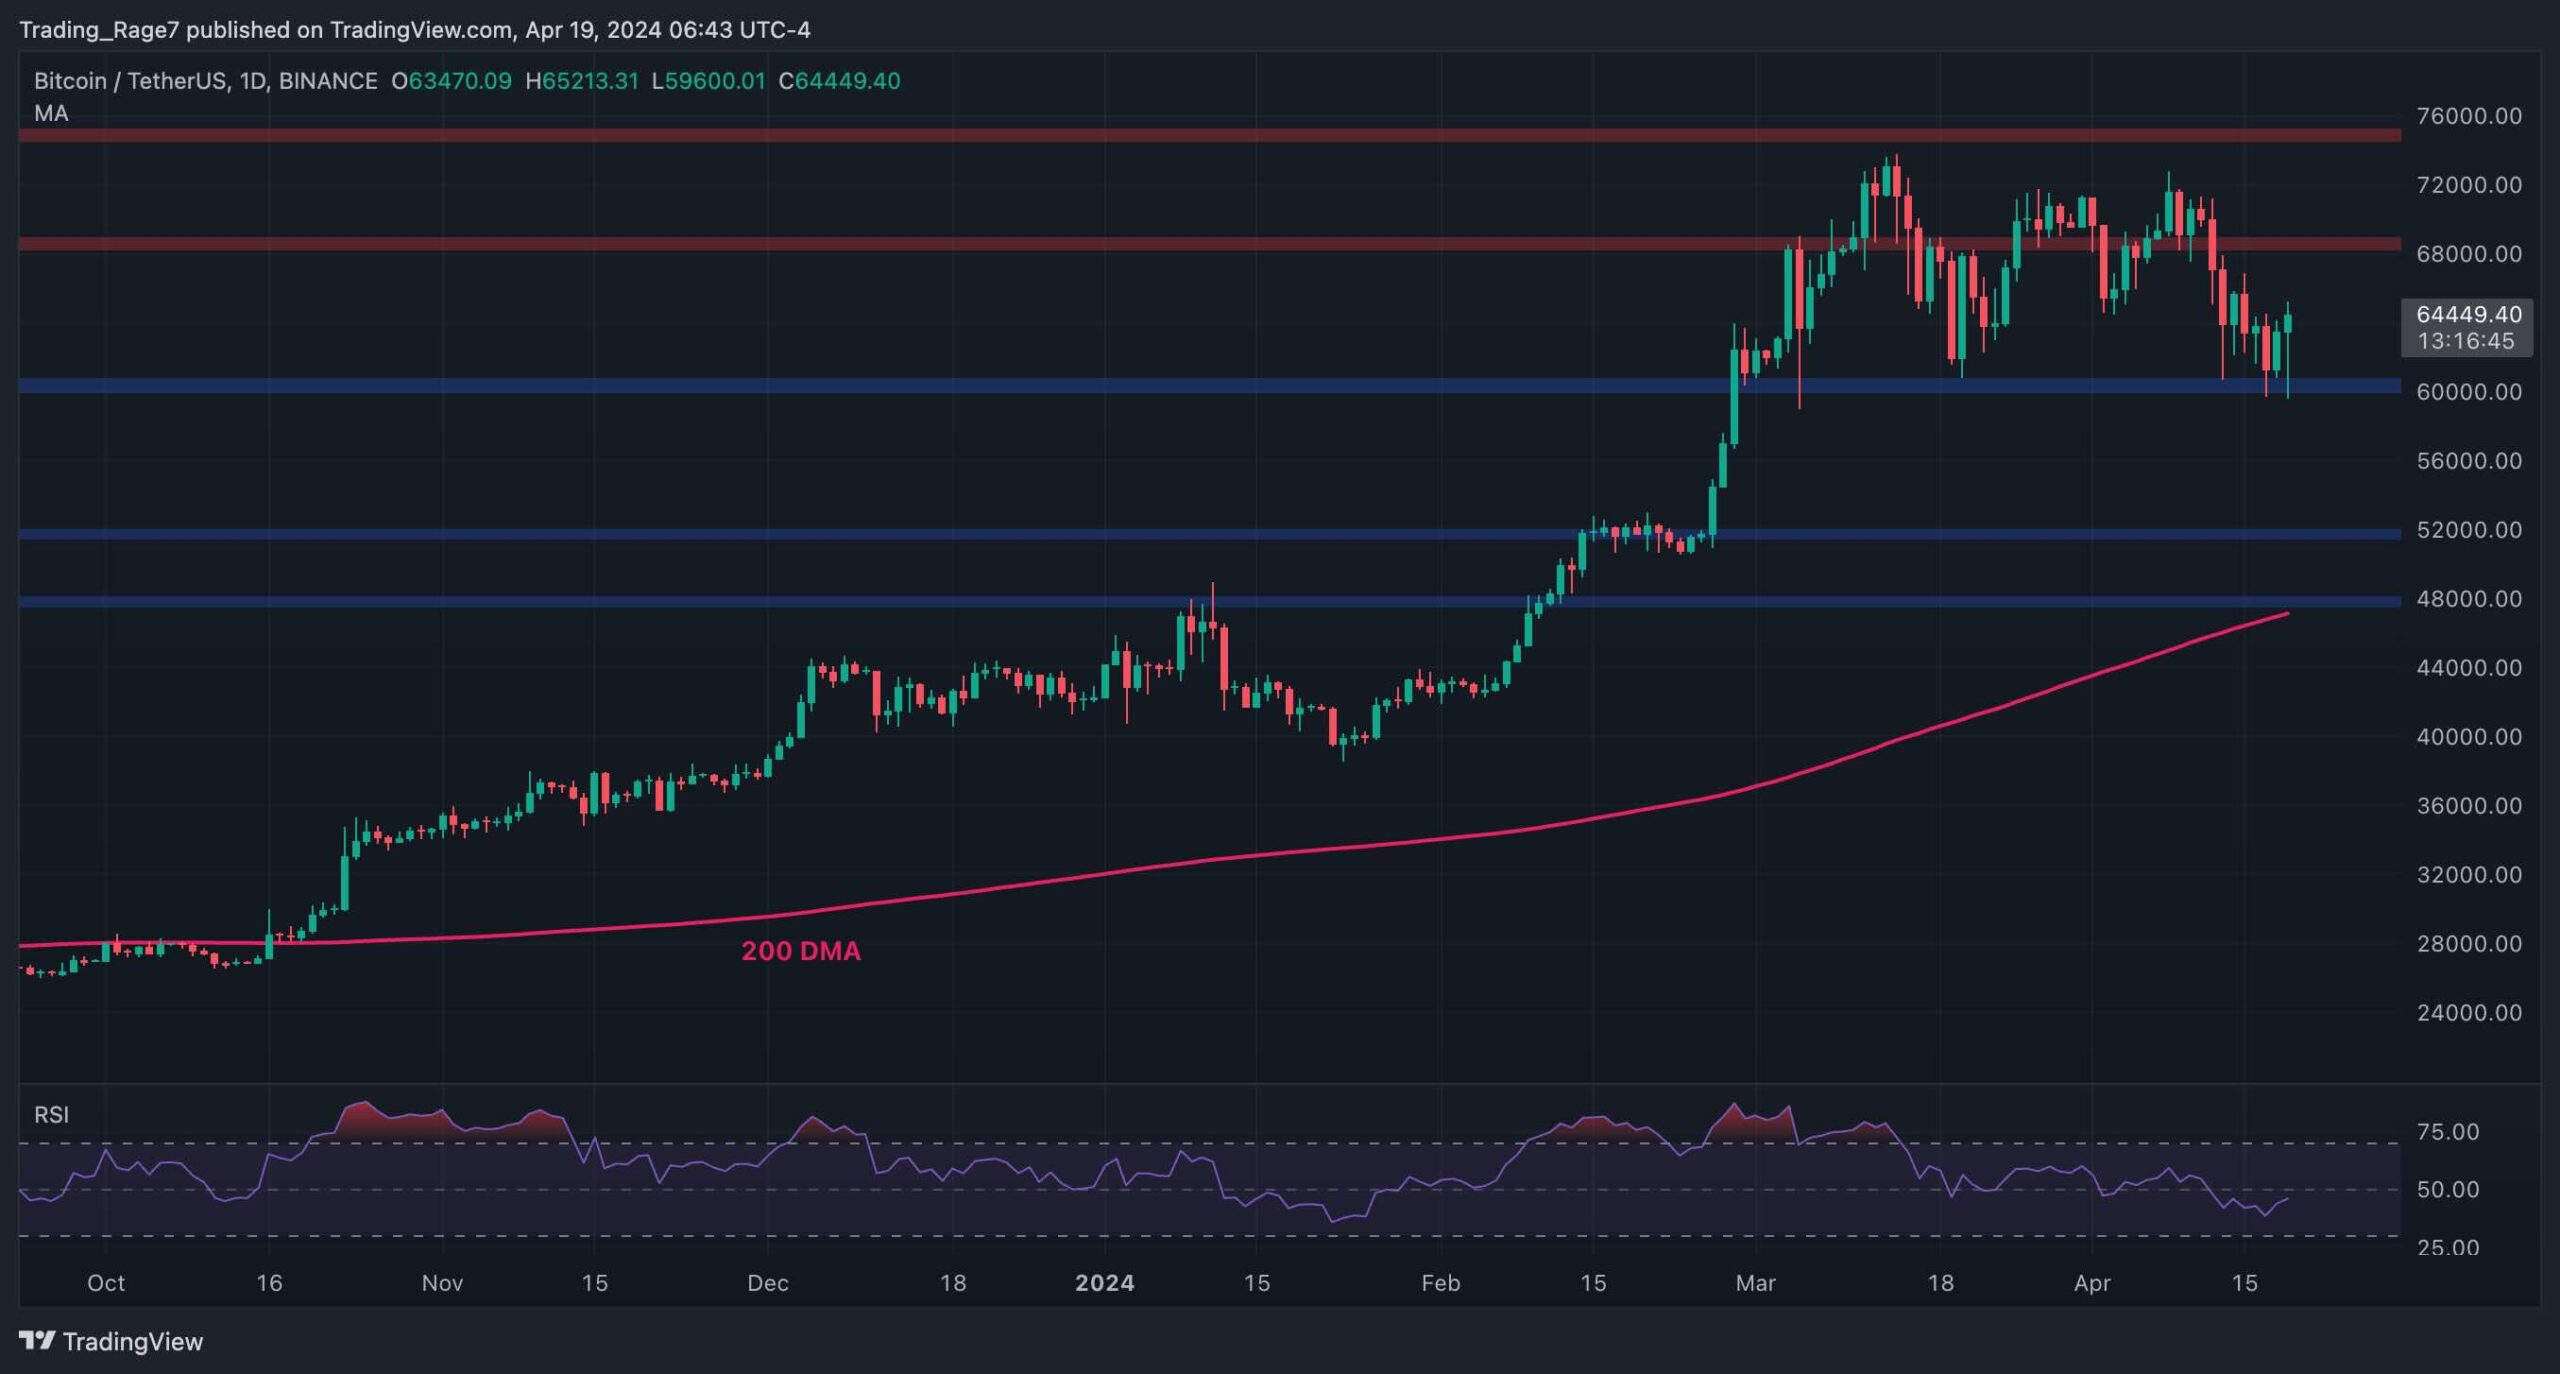
The Daily Chart
On the daily chart, the Bitcoin price has been consolidating between the $60K and $70K levels over the past couple of weeks. The recent rejection from the $70K zone has driven it down toward the $60K support level.
Yet, the level has held and initiated a rebound. The market is now expected to potentially retest $68K – an important resistance. On the other hand, if things go wrong and the price drops below $60K, the $48K-$52K area would be a probable target in the coming weeks.
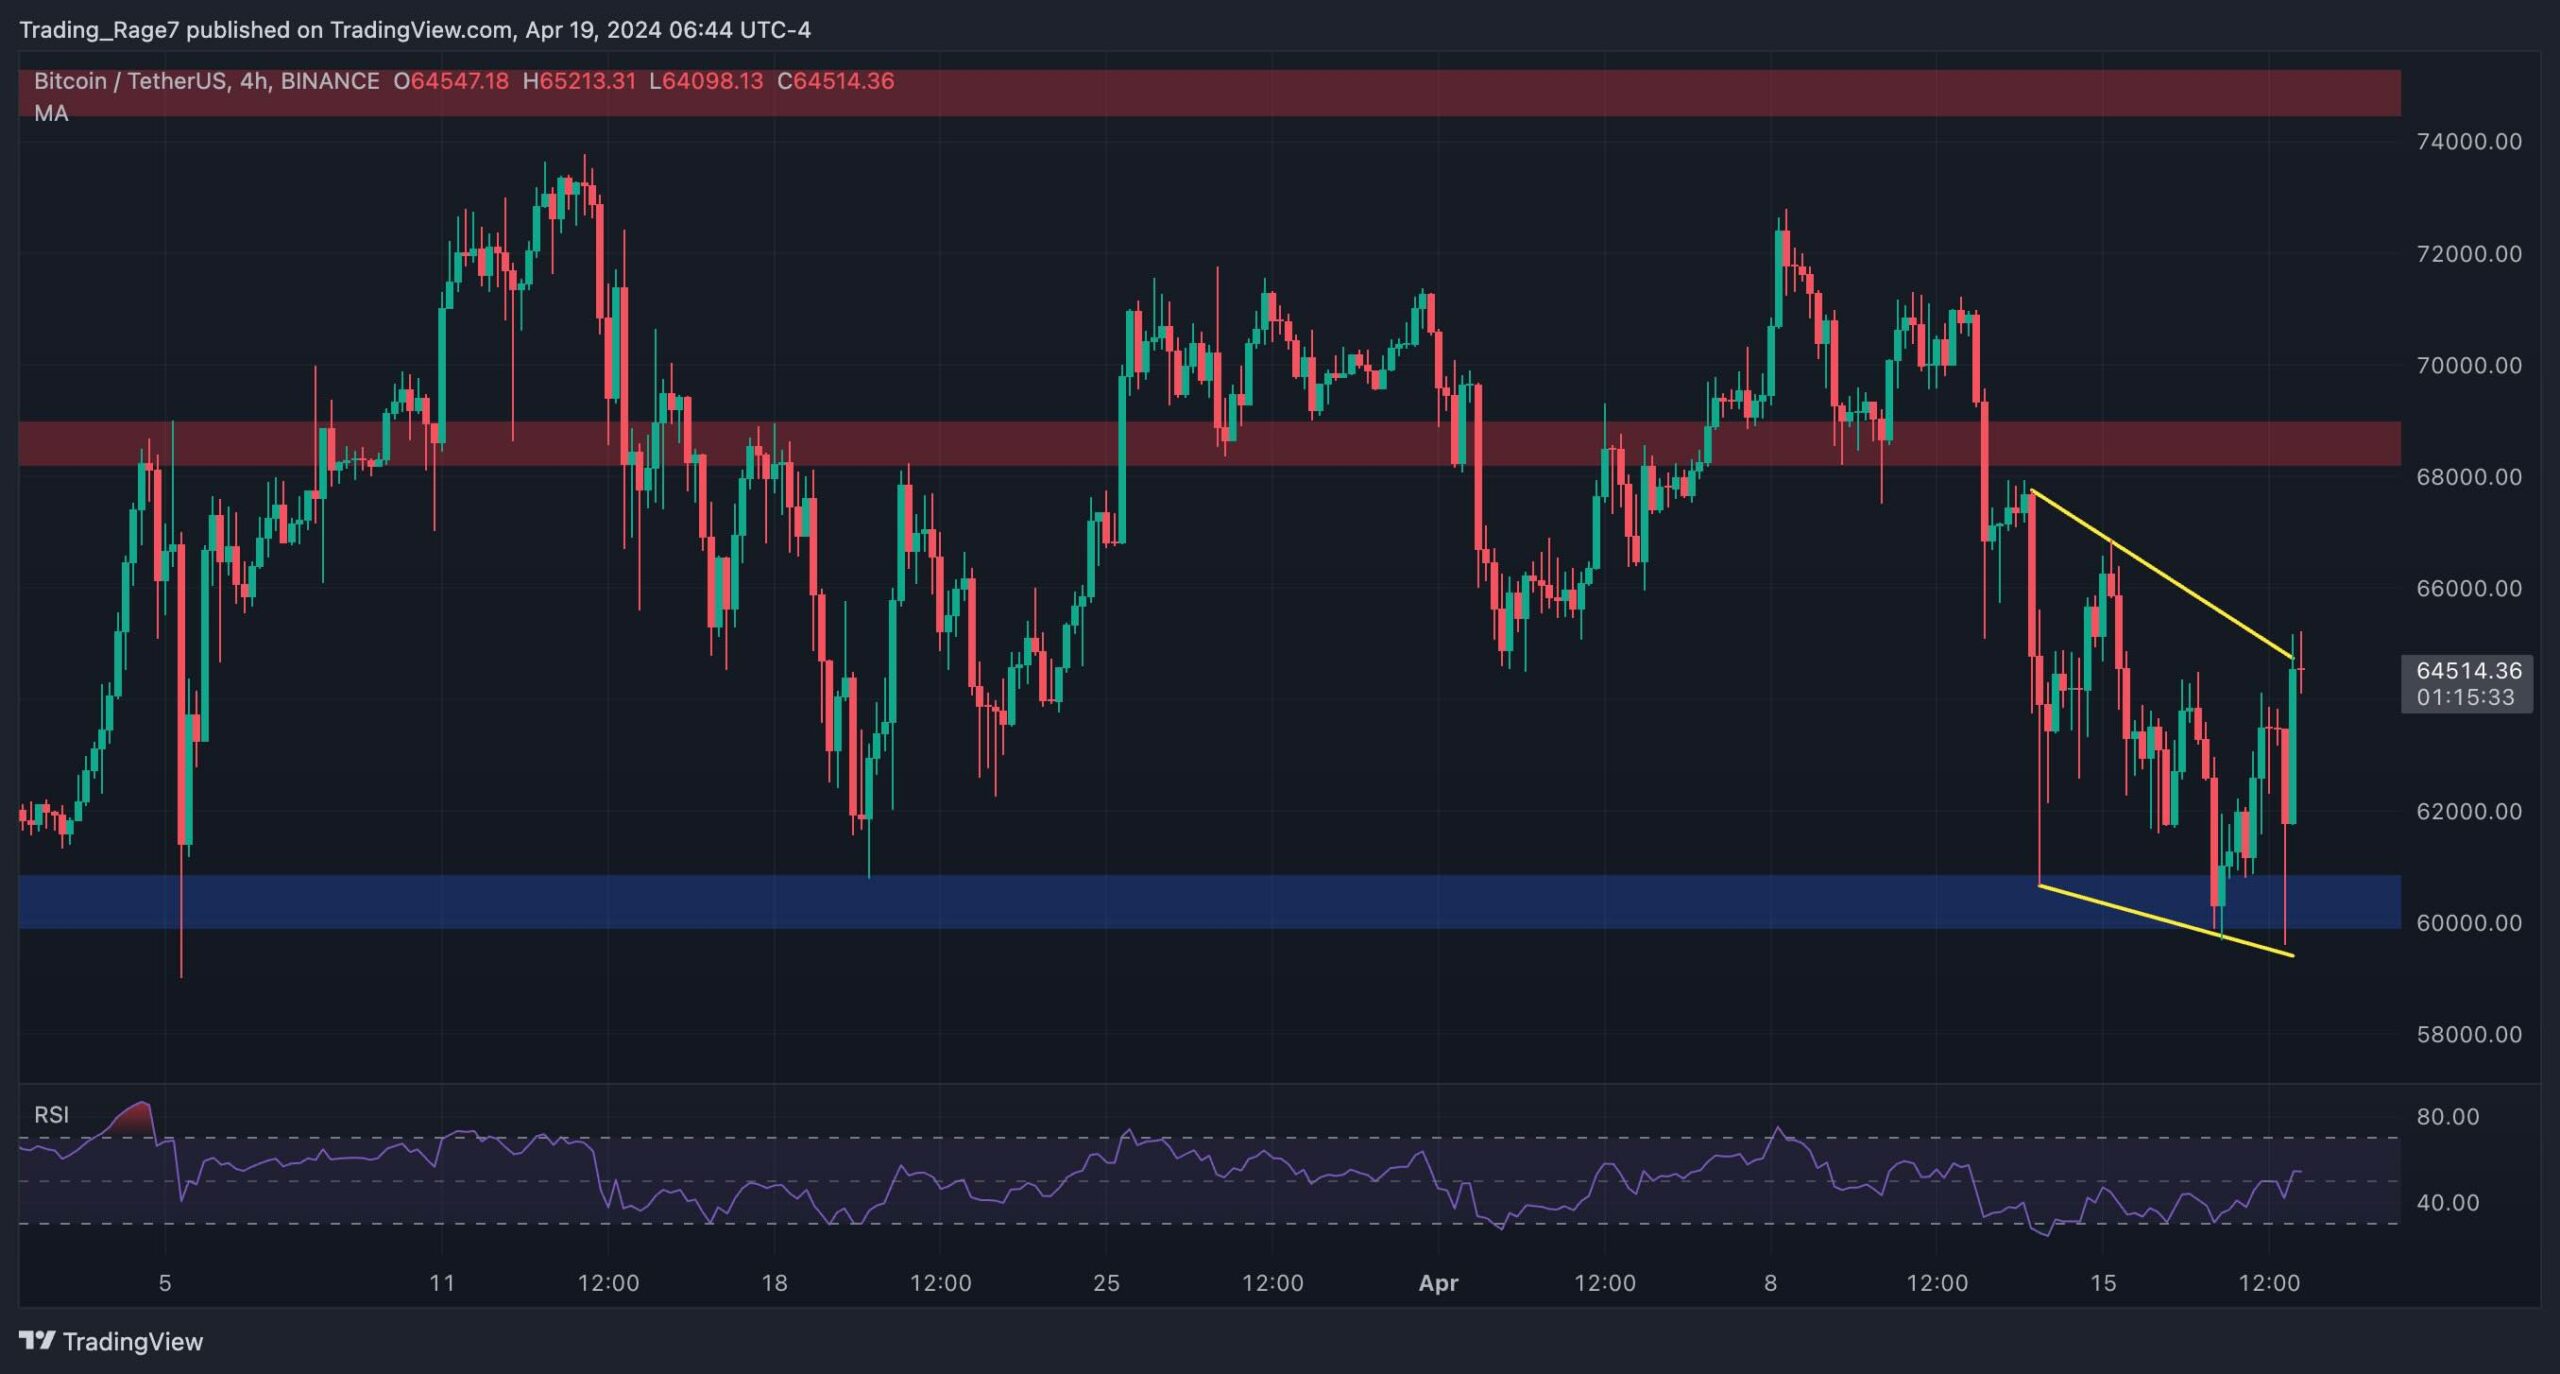
The 4-Hour Chart
Looking at the 4-hour timeframe, it is evident that the BTC price has been creating a descending channel above the $60K zone. A breakout above the channel would be a classic bullish reversal signal, and the market could finally exit the correction phase.
The Relative Strength Index also shows values above 50%, indicating that the momentum has again shifted in favour of the buyers, and a bullish scenario is slightly more likely.
On-Chain Analysis
By TradingRage
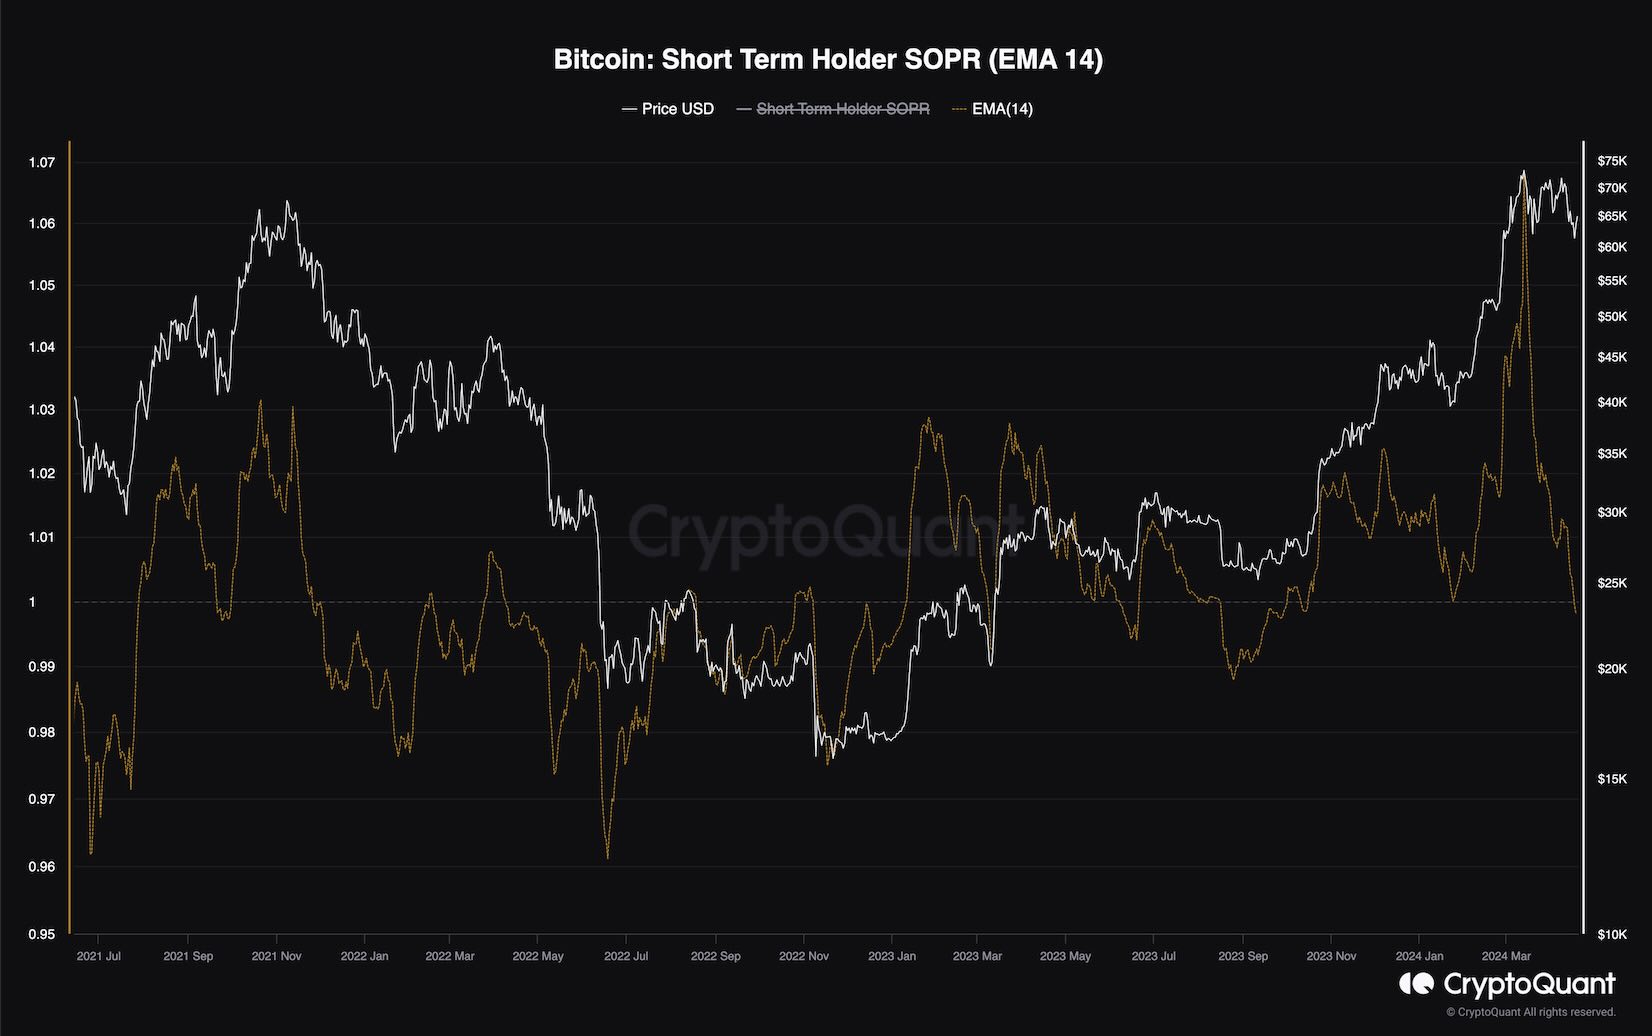
Bitcoin Short-Term Holder SOPR
Bitcoin’s consolidation over the recent weeks has caused many investors to panic. Some assume the bull market is over and BTC is topping out, while other holders view the recent correction as a buying opportunity.
This chart presents the Bitcoin short-term holders’ spent output profit ratio or SOPR in short. The metric measures the ratio of profits being realized by investors who have held their coins for less than 155 days.
As the chart demonstrates, the STH SOPR has recently put in a record high, showing values much higher than during the previous all-time high. This significant profit realization has likely taken its toll on the market, as the subsequent selling pressure has prevented the price from climbing higher.
The STH SOPR has even dropped below 1 in previous days, indicating that the short-term holders are now realizing losses. So, the market might need more demand to meet the current excessive supply and rebound higher.