Bitcoin’s price has been rallying consistently over the last few weeks, breaking past several resistance levels. Yet, some worrying signs are starting to emerge. Technical Analysis By TradingRage The Daily Chart On the daily chart, the price has rallied toward the K resistance level after a rebound from K earlier in January. While the market is testing the K level, the Relative Strength Index is demonstrating a clear overbought signal. This could point to a potential consolidation or correction in the coming weeks. Yet, the ,500 level can provide support and prevent a deep drop. Source: TradingViewThe 4-Hour Chart Looking at the 4-hour timeframe, the price is currently hovering around the K resistance level. The market structure is clearly bullish, as the
Topics:
CryptoVizArt considers the following as important: Bitcoin (BTC) Price, BTC Analysis, BTCEUR, BTCGBP, btcusd, btcusdt
This could be interesting, too:
Chayanika Deka writes XRP, SOL, and ADA Inclusion in US Crypto Reserve Pushes Traders on Edge
Chayanika Deka writes Why Arthur Hayes Is Bullish on Bitcoin Under Trump’s Economic Strategy
Mandy Williams writes Why the Bitcoin Market Is Stuck—and the Key Metric That Could Change It: CryptoQuant CEO
Wayne Jones writes Metaplanet Acquires 156 BTC, Bringing Total Holdings to 2,391
Bitcoin’s price has been rallying consistently over the last few weeks, breaking past several resistance levels. Yet, some worrying signs are starting to emerge.
Technical Analysis
By TradingRage
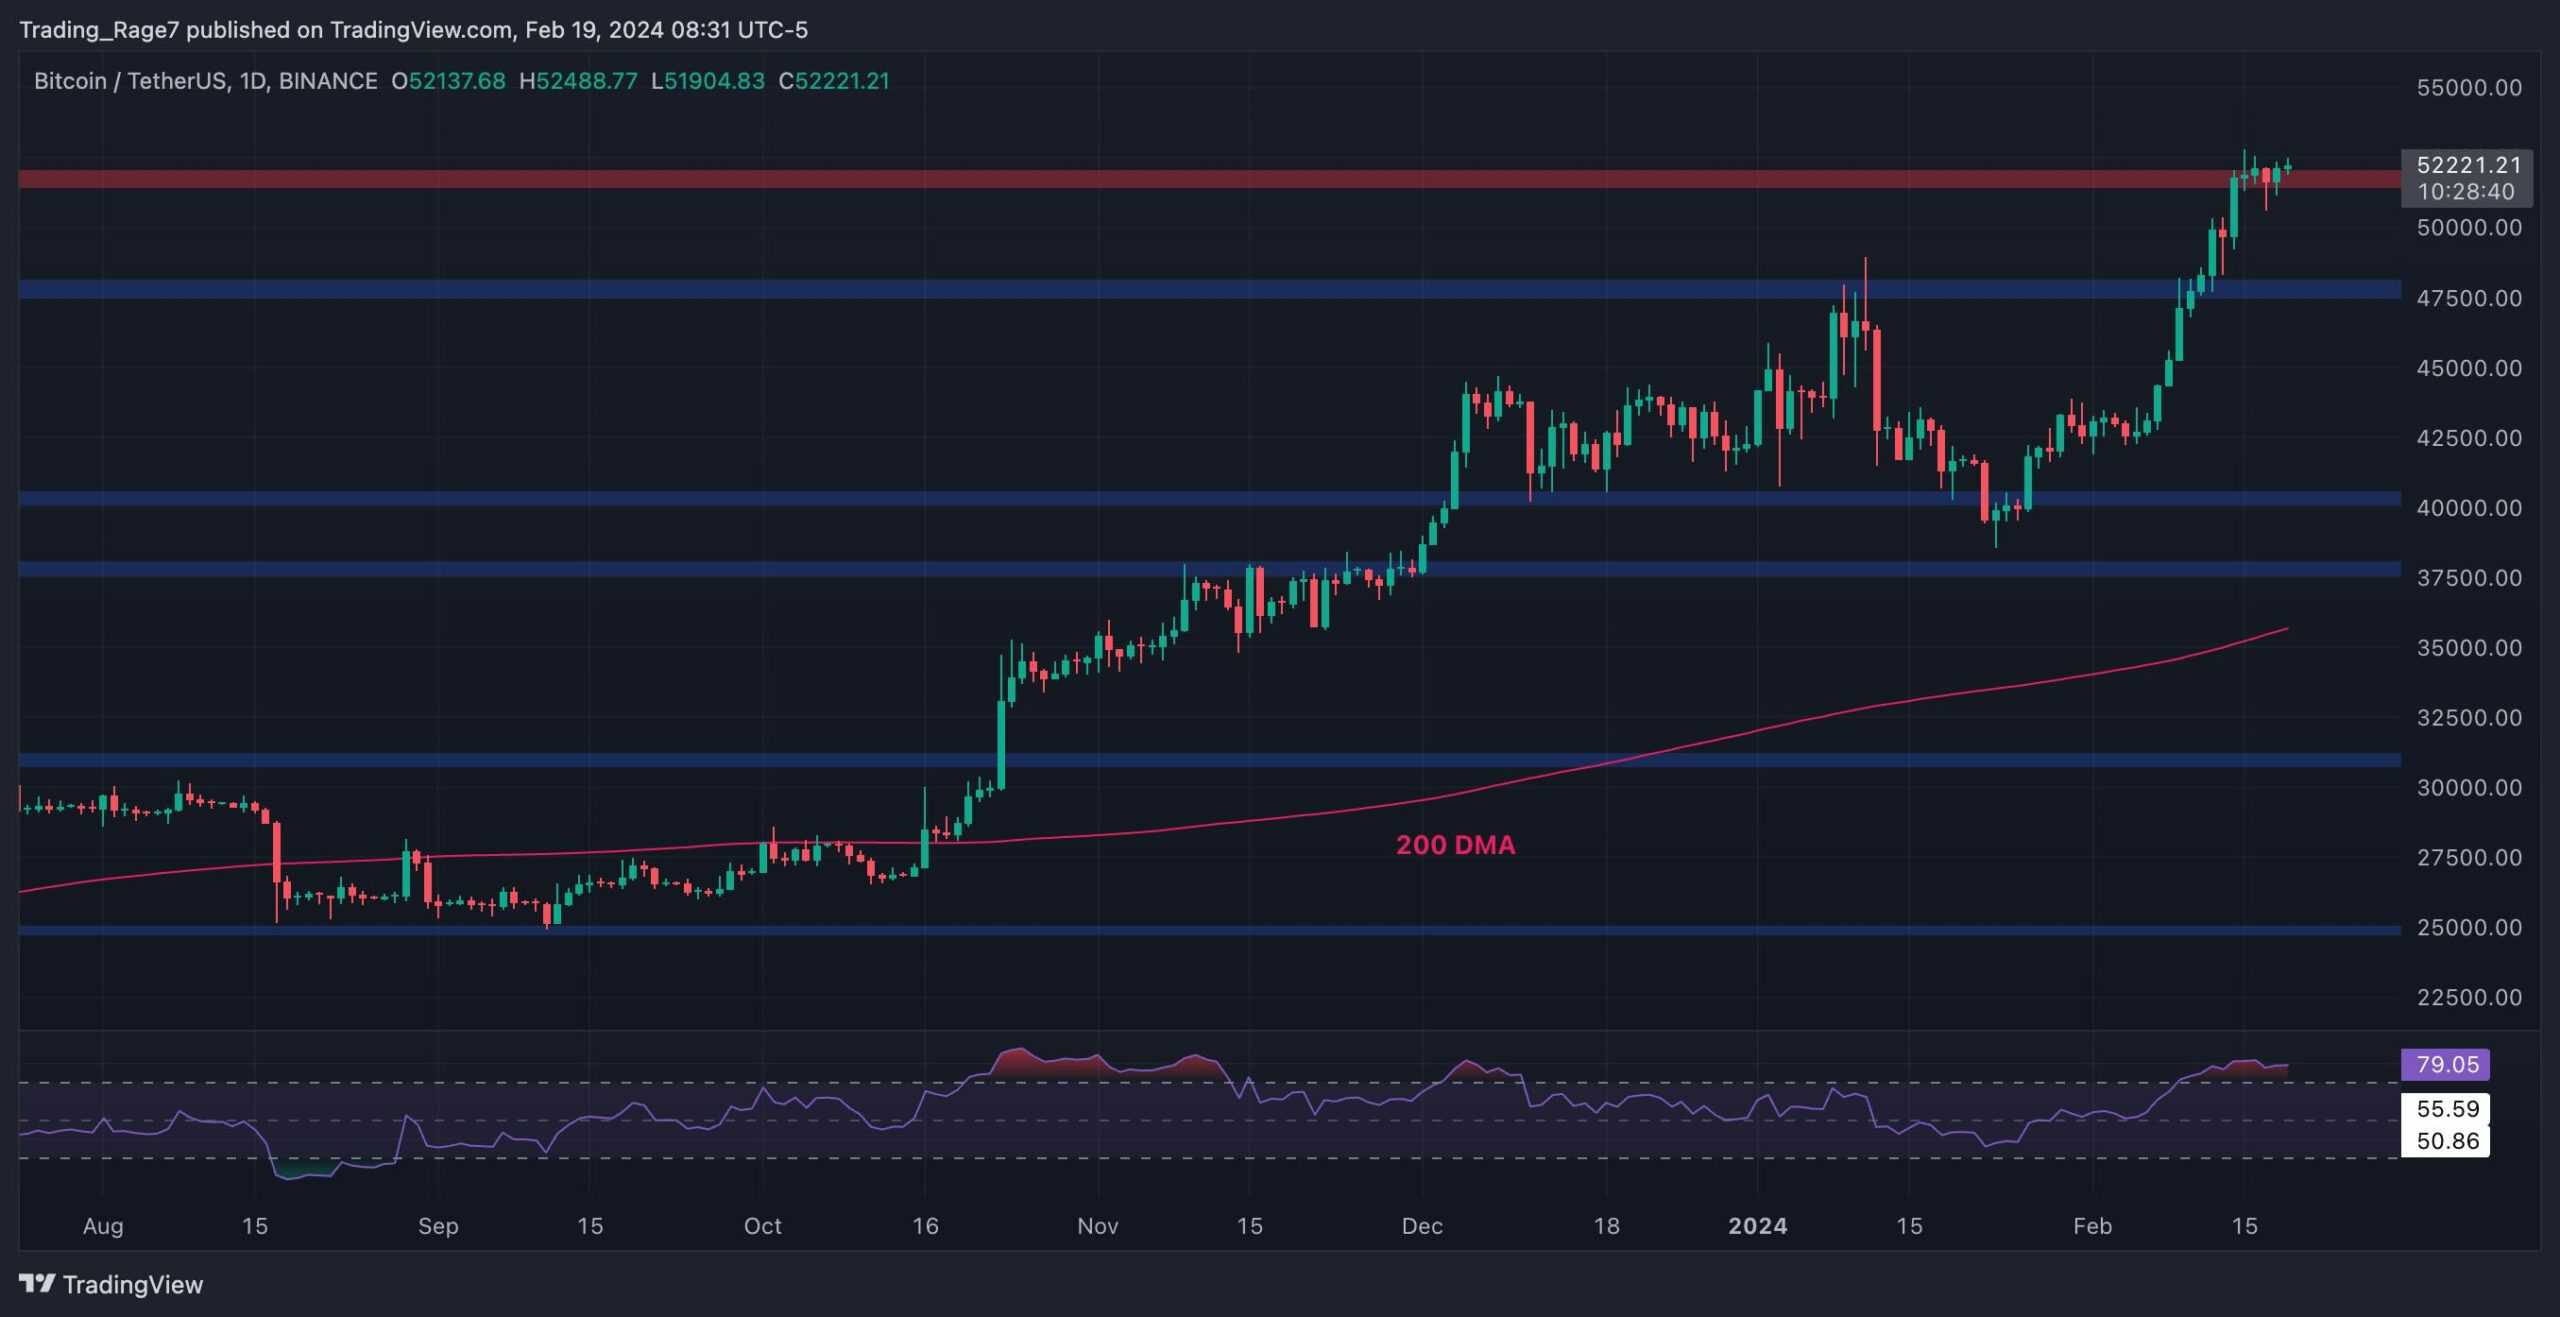
The Daily Chart
On the daily chart, the price has rallied toward the $52K resistance level after a rebound from $40K earlier in January. While the market is testing the $52K level, the Relative Strength Index is demonstrating a clear overbought signal.
This could point to a potential consolidation or correction in the coming weeks. Yet, the $47,500 level can provide support and prevent a deep drop.
The 4-Hour Chart
Looking at the 4-hour timeframe, the price is currently hovering around the $52K resistance level. The market structure is clearly bullish, as the price has been making higher highs and lows consistently.
Meanwhile, the Relative Strength Index is also showing values above 50% in this timeframe, but it has not entered the overbought region yet. Therefore, the 4-hour chart suggests that there is still potential for further upside in the short term.

On-Chain Analysis
By TradingRage
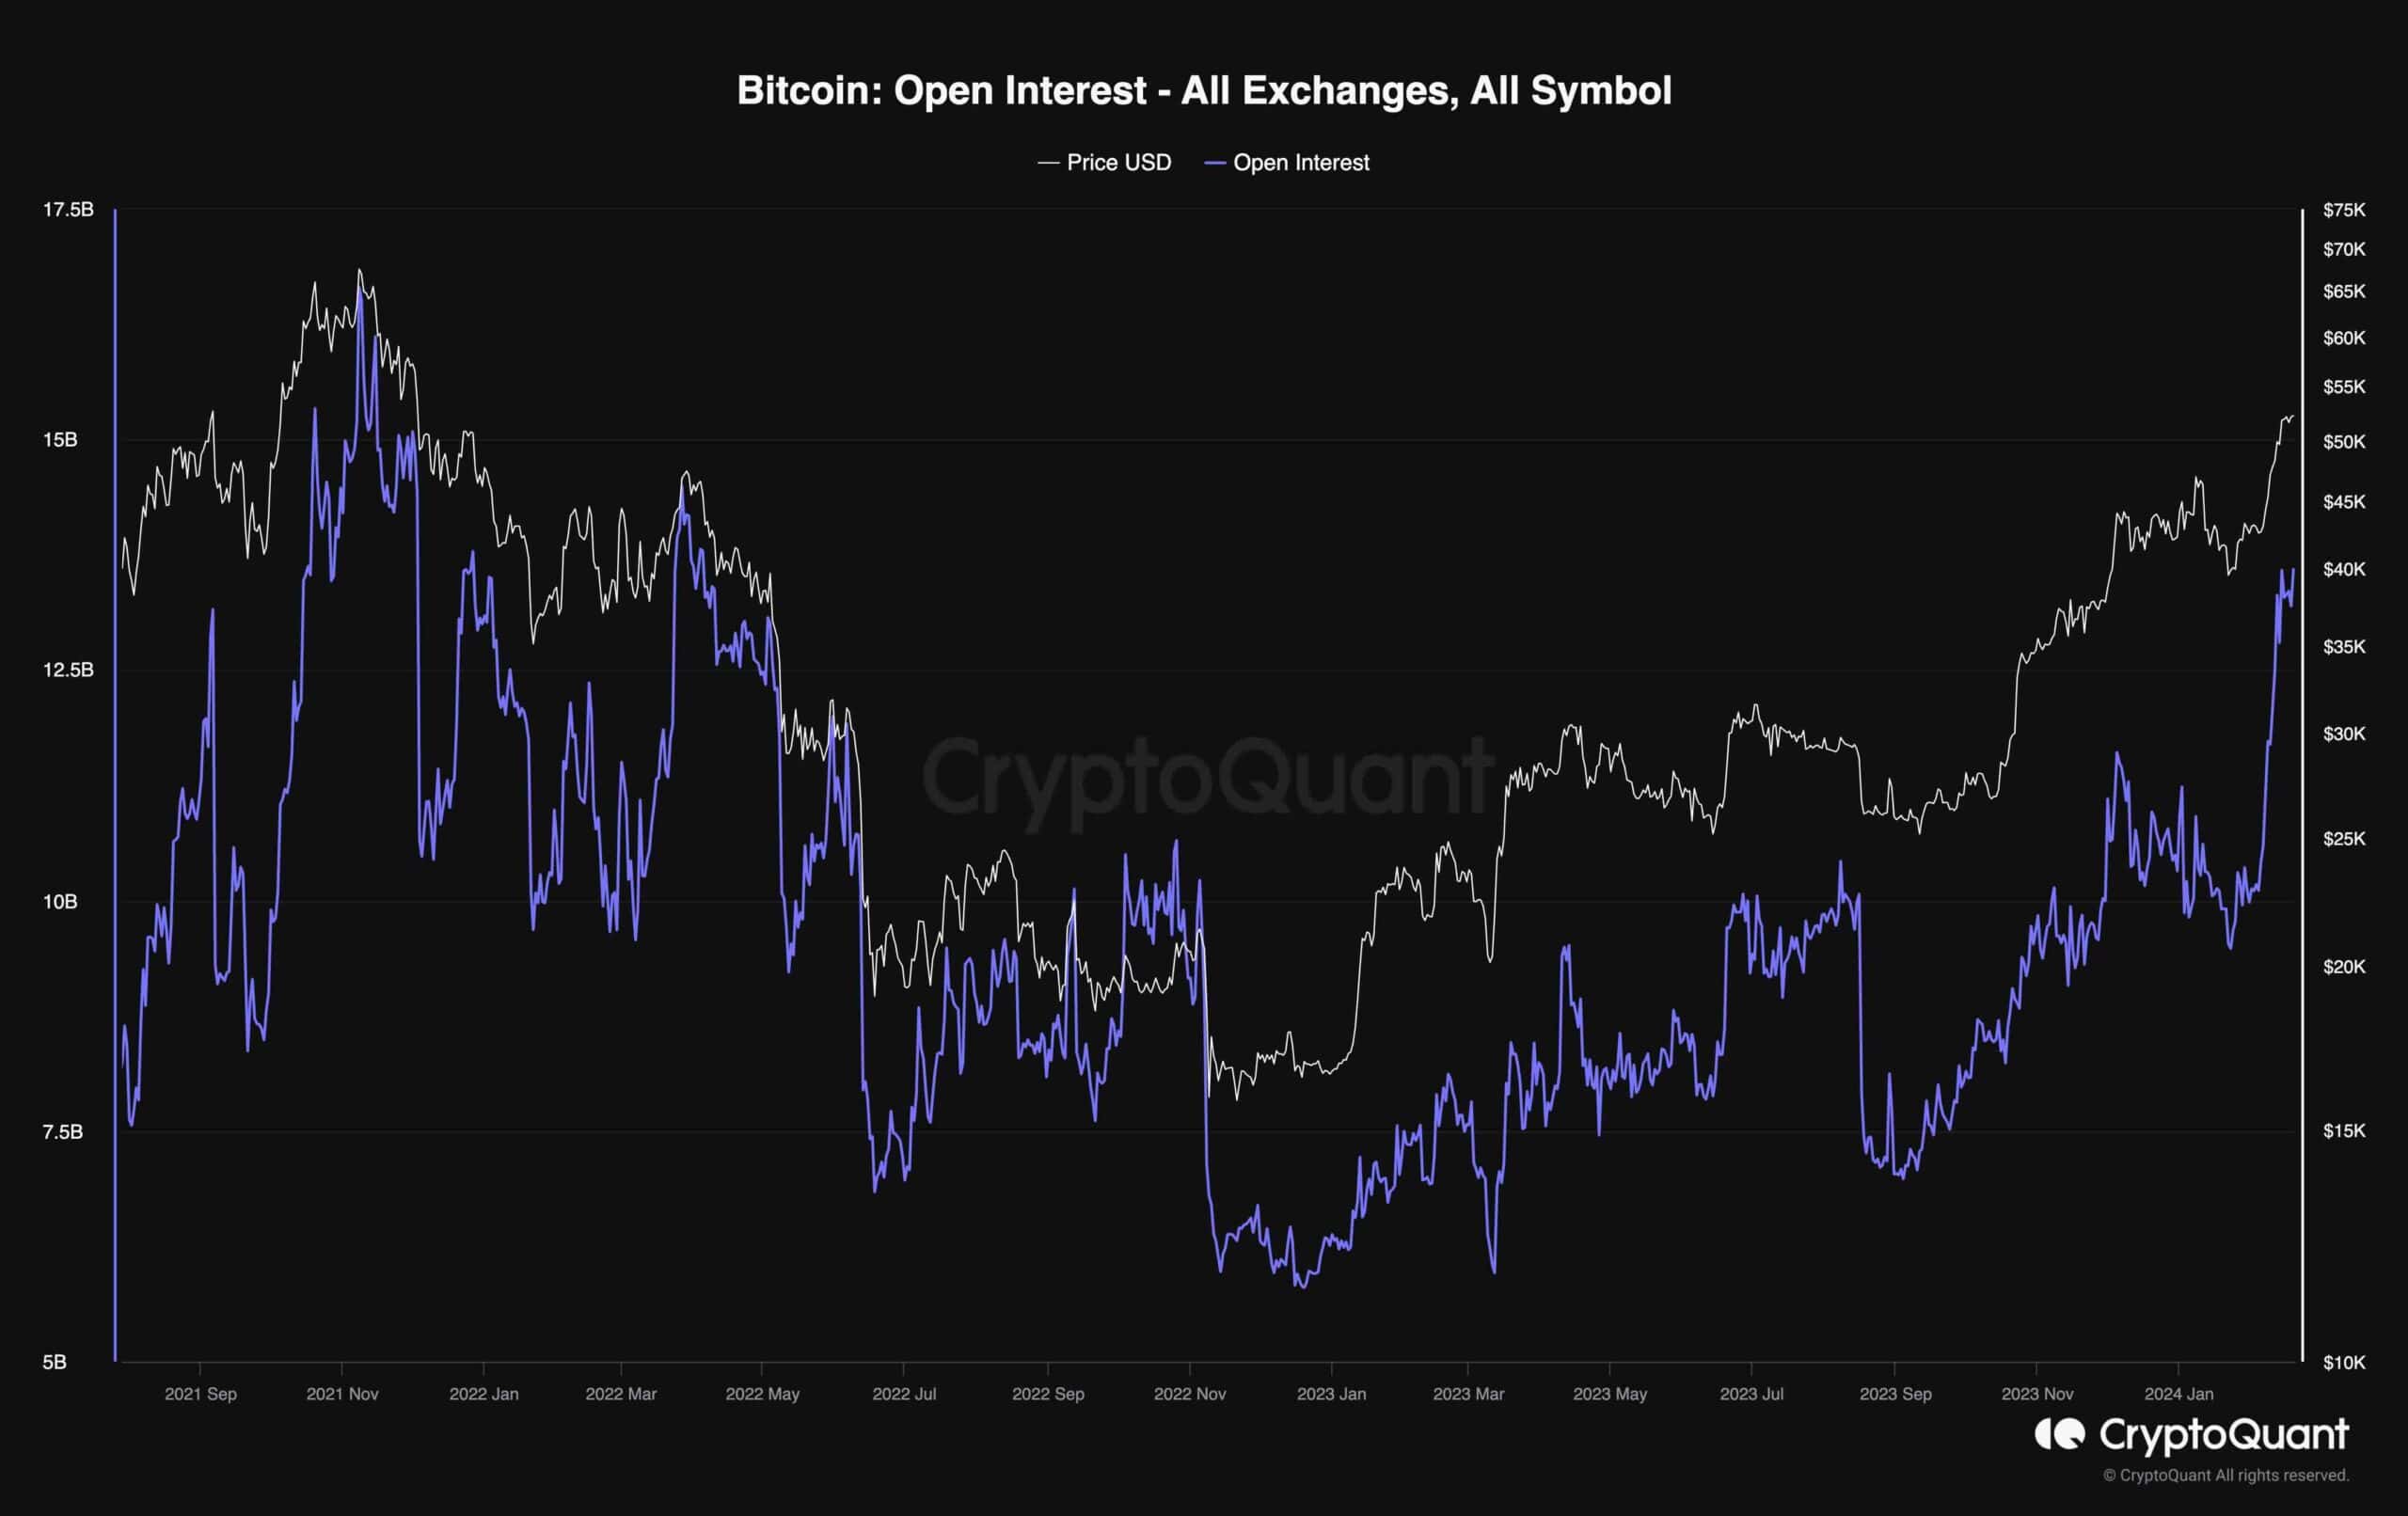
Bitcoin Open Interest
Bitcoin’s price has been rallying aggressively over the past few weeks, breaking above the $50K resistance level. Consequently, the traders are returning to the market in hordes.
This chart presents the open interest metric, which is very useful for evaluating futures market sentiment. It counts the total number of open futures contracts, both short and long.
It is evident that the open interest has significantly spiked recently. While this is natural in a bullish market environment, a huge spike might lead to heightened volatility and, possibly, a long liquidation cascade that could lead to a rapid drop.
Therefore, investors should be careful in the short term and manage their risk accordingly.