Bitcoin’s price is on the verge of making a new all-time high after skyrocketing beyond the ,000 line earlier this wee, and market participants are wondering how much further BTC will rally. Yet, there is still one obstacle remaining as the asset has retraced below that level. By TradingRage The Daily Chart On the daily chart, BTC has been rallying since its rebound from the K support level. It has recently been tested and rejected from the higher boundary of the large descending channel. Currently, the price is being supported by the K level. If the line holds, bitcoin can once again rally toward the higher boundary of the channel and potentially higher toward the K resistance zone. However, the asset is quite uncertain at this point, with a few dips below
Topics:
CryptoVizArt considers the following as important: Bitcoin (BTC) Price, BTC Analysis, BTCEUR, BTCGBP, btcusd, btcusdt
This could be interesting, too:
Chayanika Deka writes XRP, SOL, and ADA Inclusion in US Crypto Reserve Pushes Traders on Edge
Chayanika Deka writes Why Arthur Hayes Is Bullish on Bitcoin Under Trump’s Economic Strategy
Mandy Williams writes Why the Bitcoin Market Is Stuck—and the Key Metric That Could Change It: CryptoQuant CEO
Wayne Jones writes Metaplanet Acquires 156 BTC, Bringing Total Holdings to 2,391
Bitcoin’s price is on the verge of making a new all-time high after skyrocketing beyond the $70,000 line earlier this wee, and market participants are wondering how much further BTC will rally.
Yet, there is still one obstacle remaining as the asset has retraced below that level.
By TradingRage
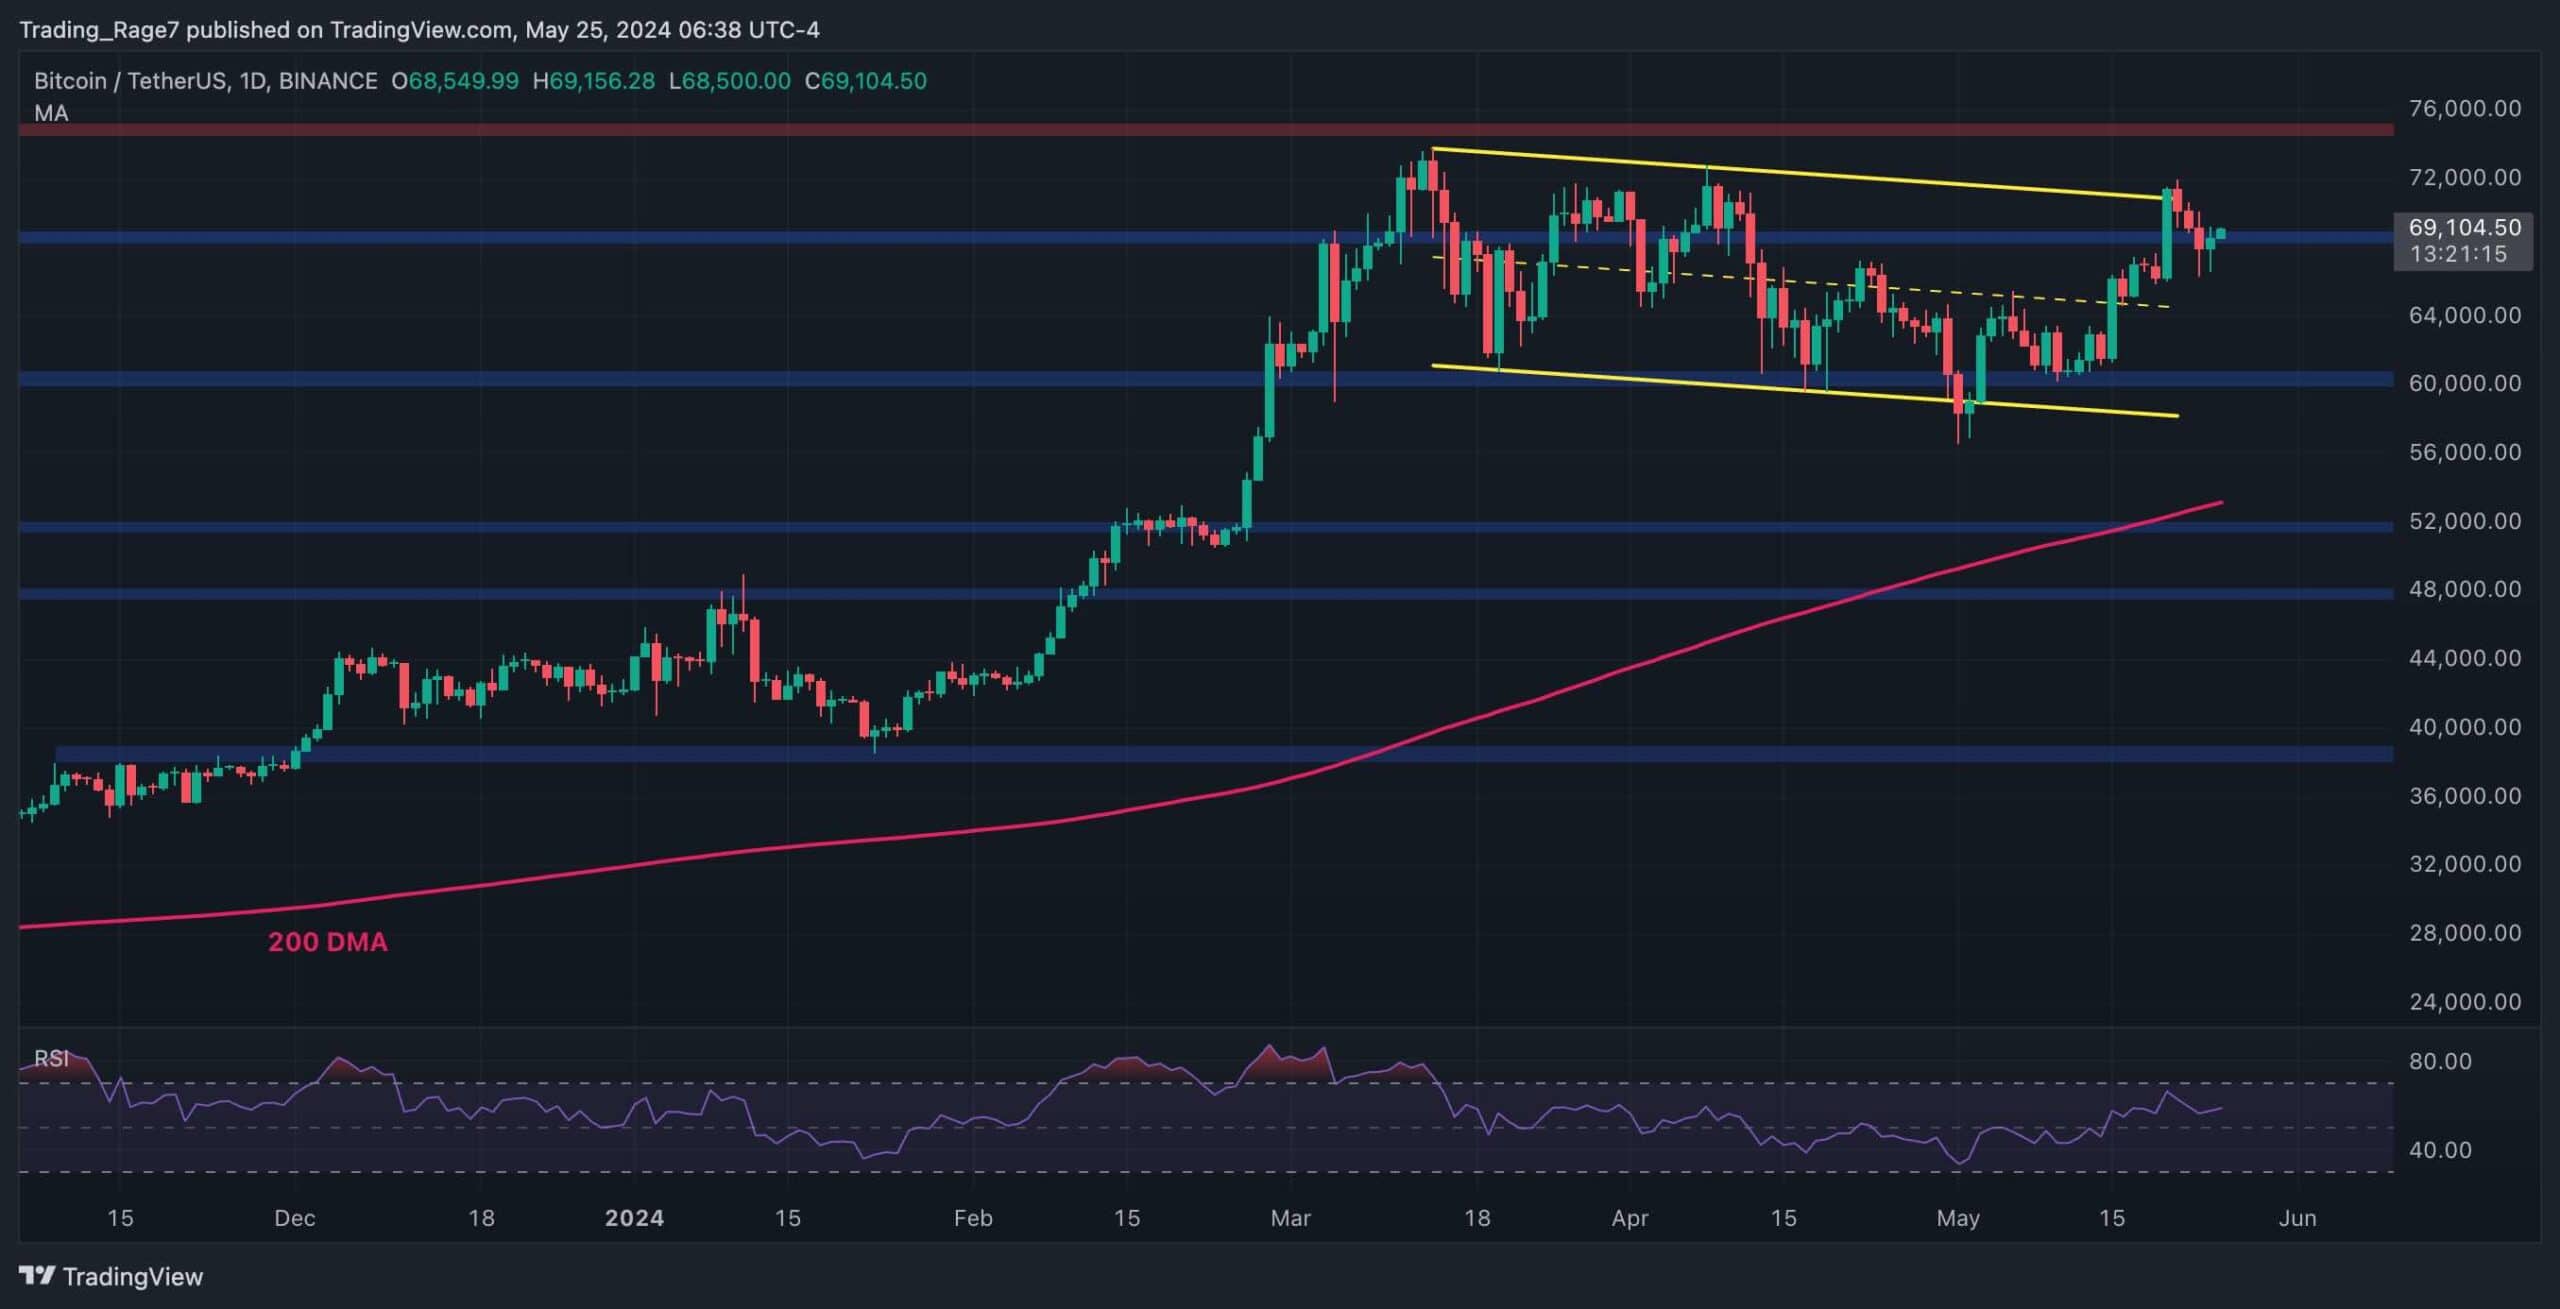
The Daily Chart
On the daily chart, BTC has been rallying since its rebound from the $60K support level. It has recently been tested and rejected from the higher boundary of the large descending channel. Currently, the price is being supported by the $69K level.
If the line holds, bitcoin can once again rally toward the higher boundary of the channel and potentially higher toward the $75K resistance zone. However, the asset is quite uncertain at this point, with a few dips below it.
The 4-Hour Chart
The 4-hour timeframe demonstrates a more clear picture of bitcoin’s recent price action. The price has been making lower highs and lows since its rejection from the higher boundary of the large channel. However, it is currently breaking above the bearish trendline it has created recently.
With the RSI also rising above the 50% threshold, the momentum seems to be shifting in favor of the buyers once more. Therefore, if the $69K support level holds, it would only be a matter of time before the price runs at the $75K area and creates a new record high.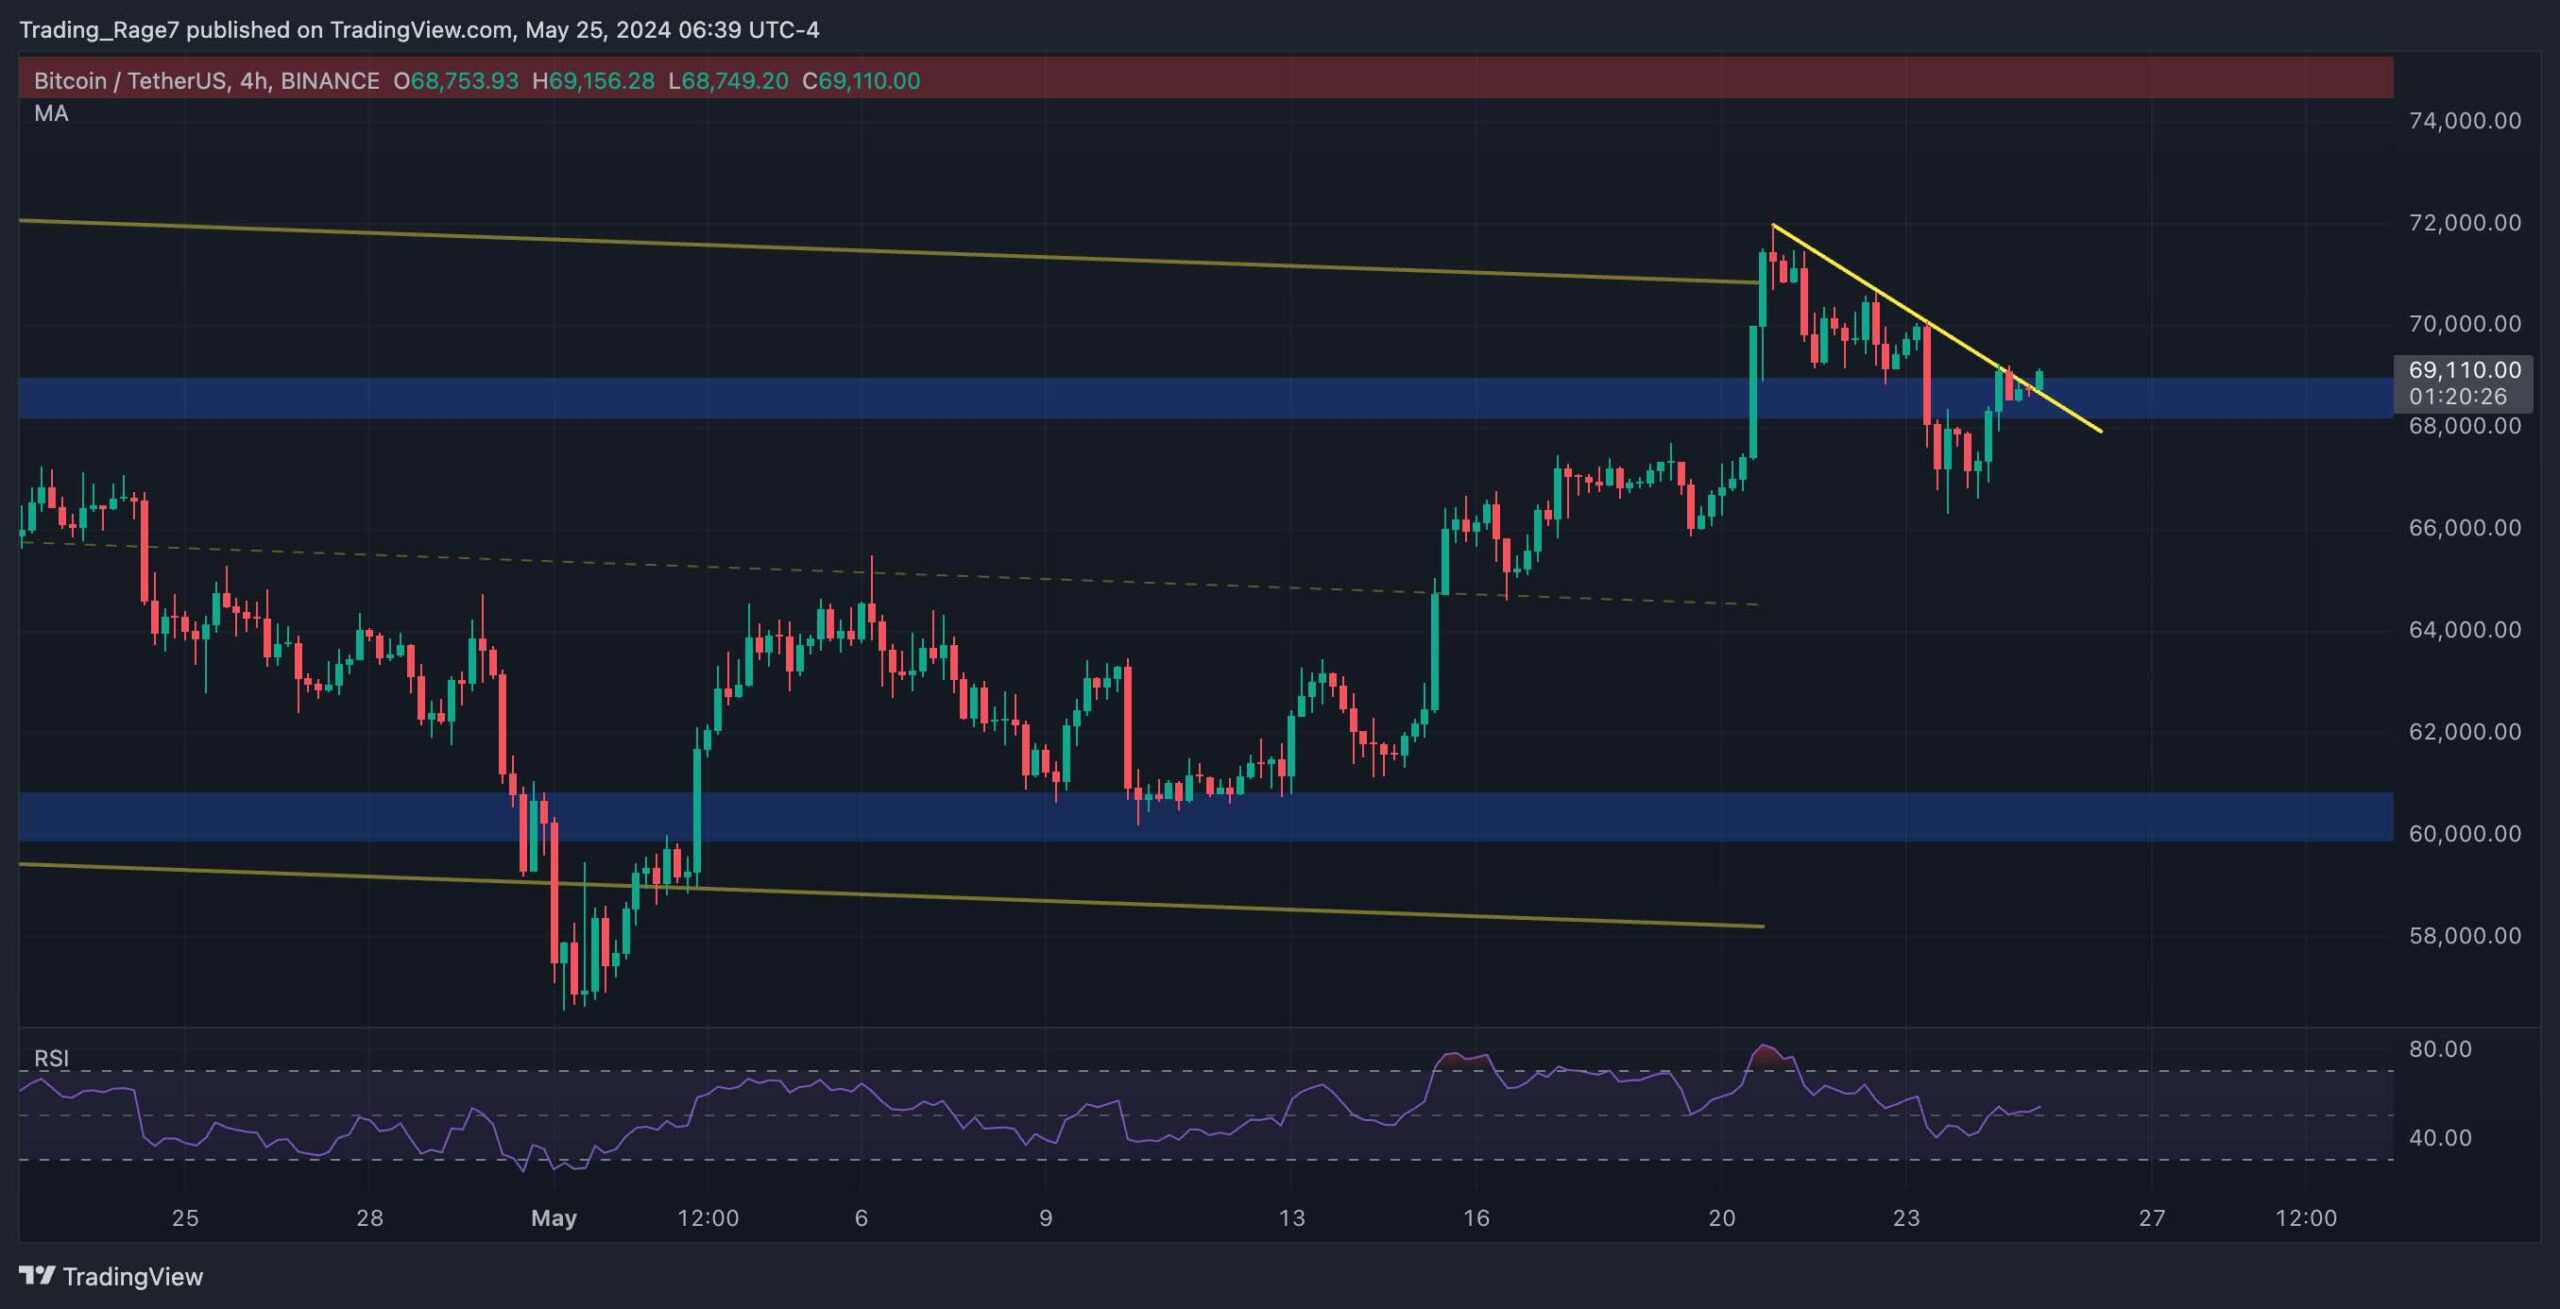
By TradingRage
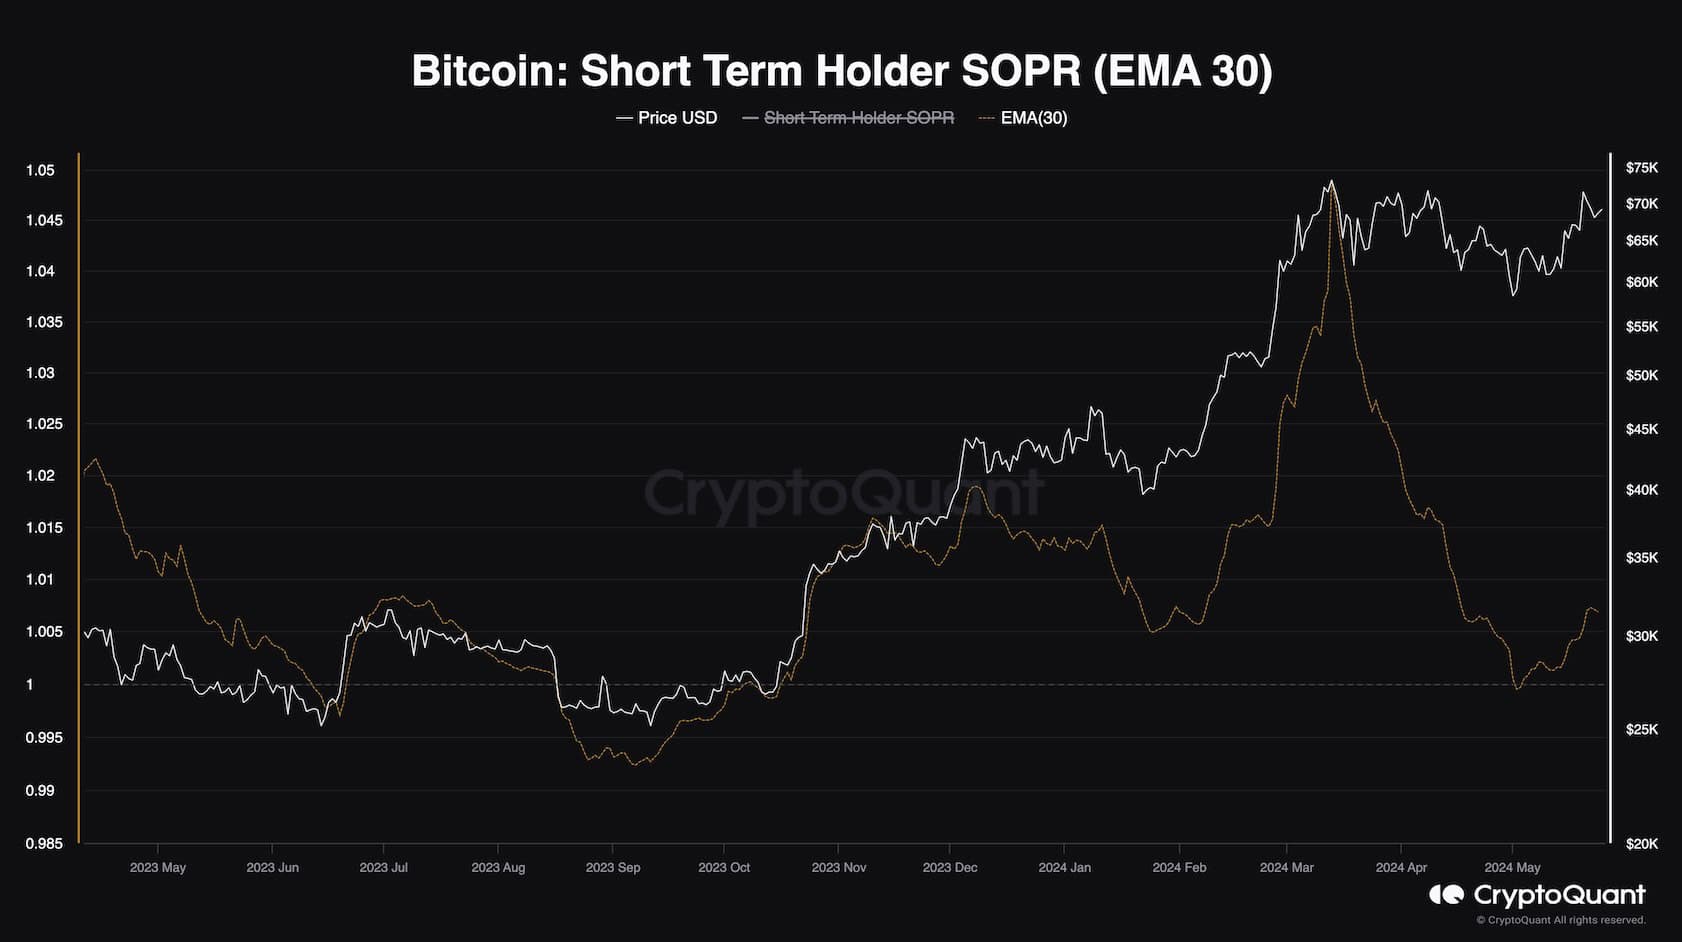
Bitcoin Short-Term Holder SOPR
While bitcoin’s price is rebounding after two months of correction and consolidation, evidence shows that many market participants have exited the market, selling their coins to new investors.
This chart demonstrates the BTC short-term holder SOPR metric, which measures the realized profits/losses ratio. Values above one indicate profit realization on aggregate, while numbers below one show selling at a loss.
As the chart displays, the SOPR metric has taken a nosedive during the recent correction, dropping back to one. This indicates that many short-term holders have exited the market and realized profits, selling their coins to newcomers.
Meanwhile, with the metric rebounding, the short-term holders are again taking profits as the price rallies. Yet, as long as there is enough demand, the price can continue higher.