Bitcoin’s price has been on an almost vertical rise in the last few days, approaching its all-time high of K. Yet, the cryptocurrency might not make a new record right away, as some warning signals are pointing to a short-term correction. Technical Analysis By TradingRage The Daily Chart On the daily timeframe, it is evident that the price has been rallying aggressively during the last month, breaking past several significant resistance levels. The market is currently one step away from making a new all-time high, as there are no significant long-term resistance levels left apart from the K level itself. Yet, the Relative Strength Index demonstrates a clear overbought signal that could point to a potential consolidation or pullback in the coming days. Source:
Topics:
CryptoVizArt considers the following as important: Bitcoin (BTC) Price, BTC Analysis, BTCEUR, BTCGBP, btcusd, btcusdt
This could be interesting, too:
Chayanika Deka writes XRP, SOL, and ADA Inclusion in US Crypto Reserve Pushes Traders on Edge
Chayanika Deka writes Why Arthur Hayes Is Bullish on Bitcoin Under Trump’s Economic Strategy
Mandy Williams writes Why the Bitcoin Market Is Stuck—and the Key Metric That Could Change It: CryptoQuant CEO
Wayne Jones writes Metaplanet Acquires 156 BTC, Bringing Total Holdings to 2,391
Bitcoin’s price has been on an almost vertical rise in the last few days, approaching its all-time high of $69K. Yet, the cryptocurrency might not make a new record right away, as some warning signals are pointing to a short-term correction.
Technical Analysis
By TradingRage
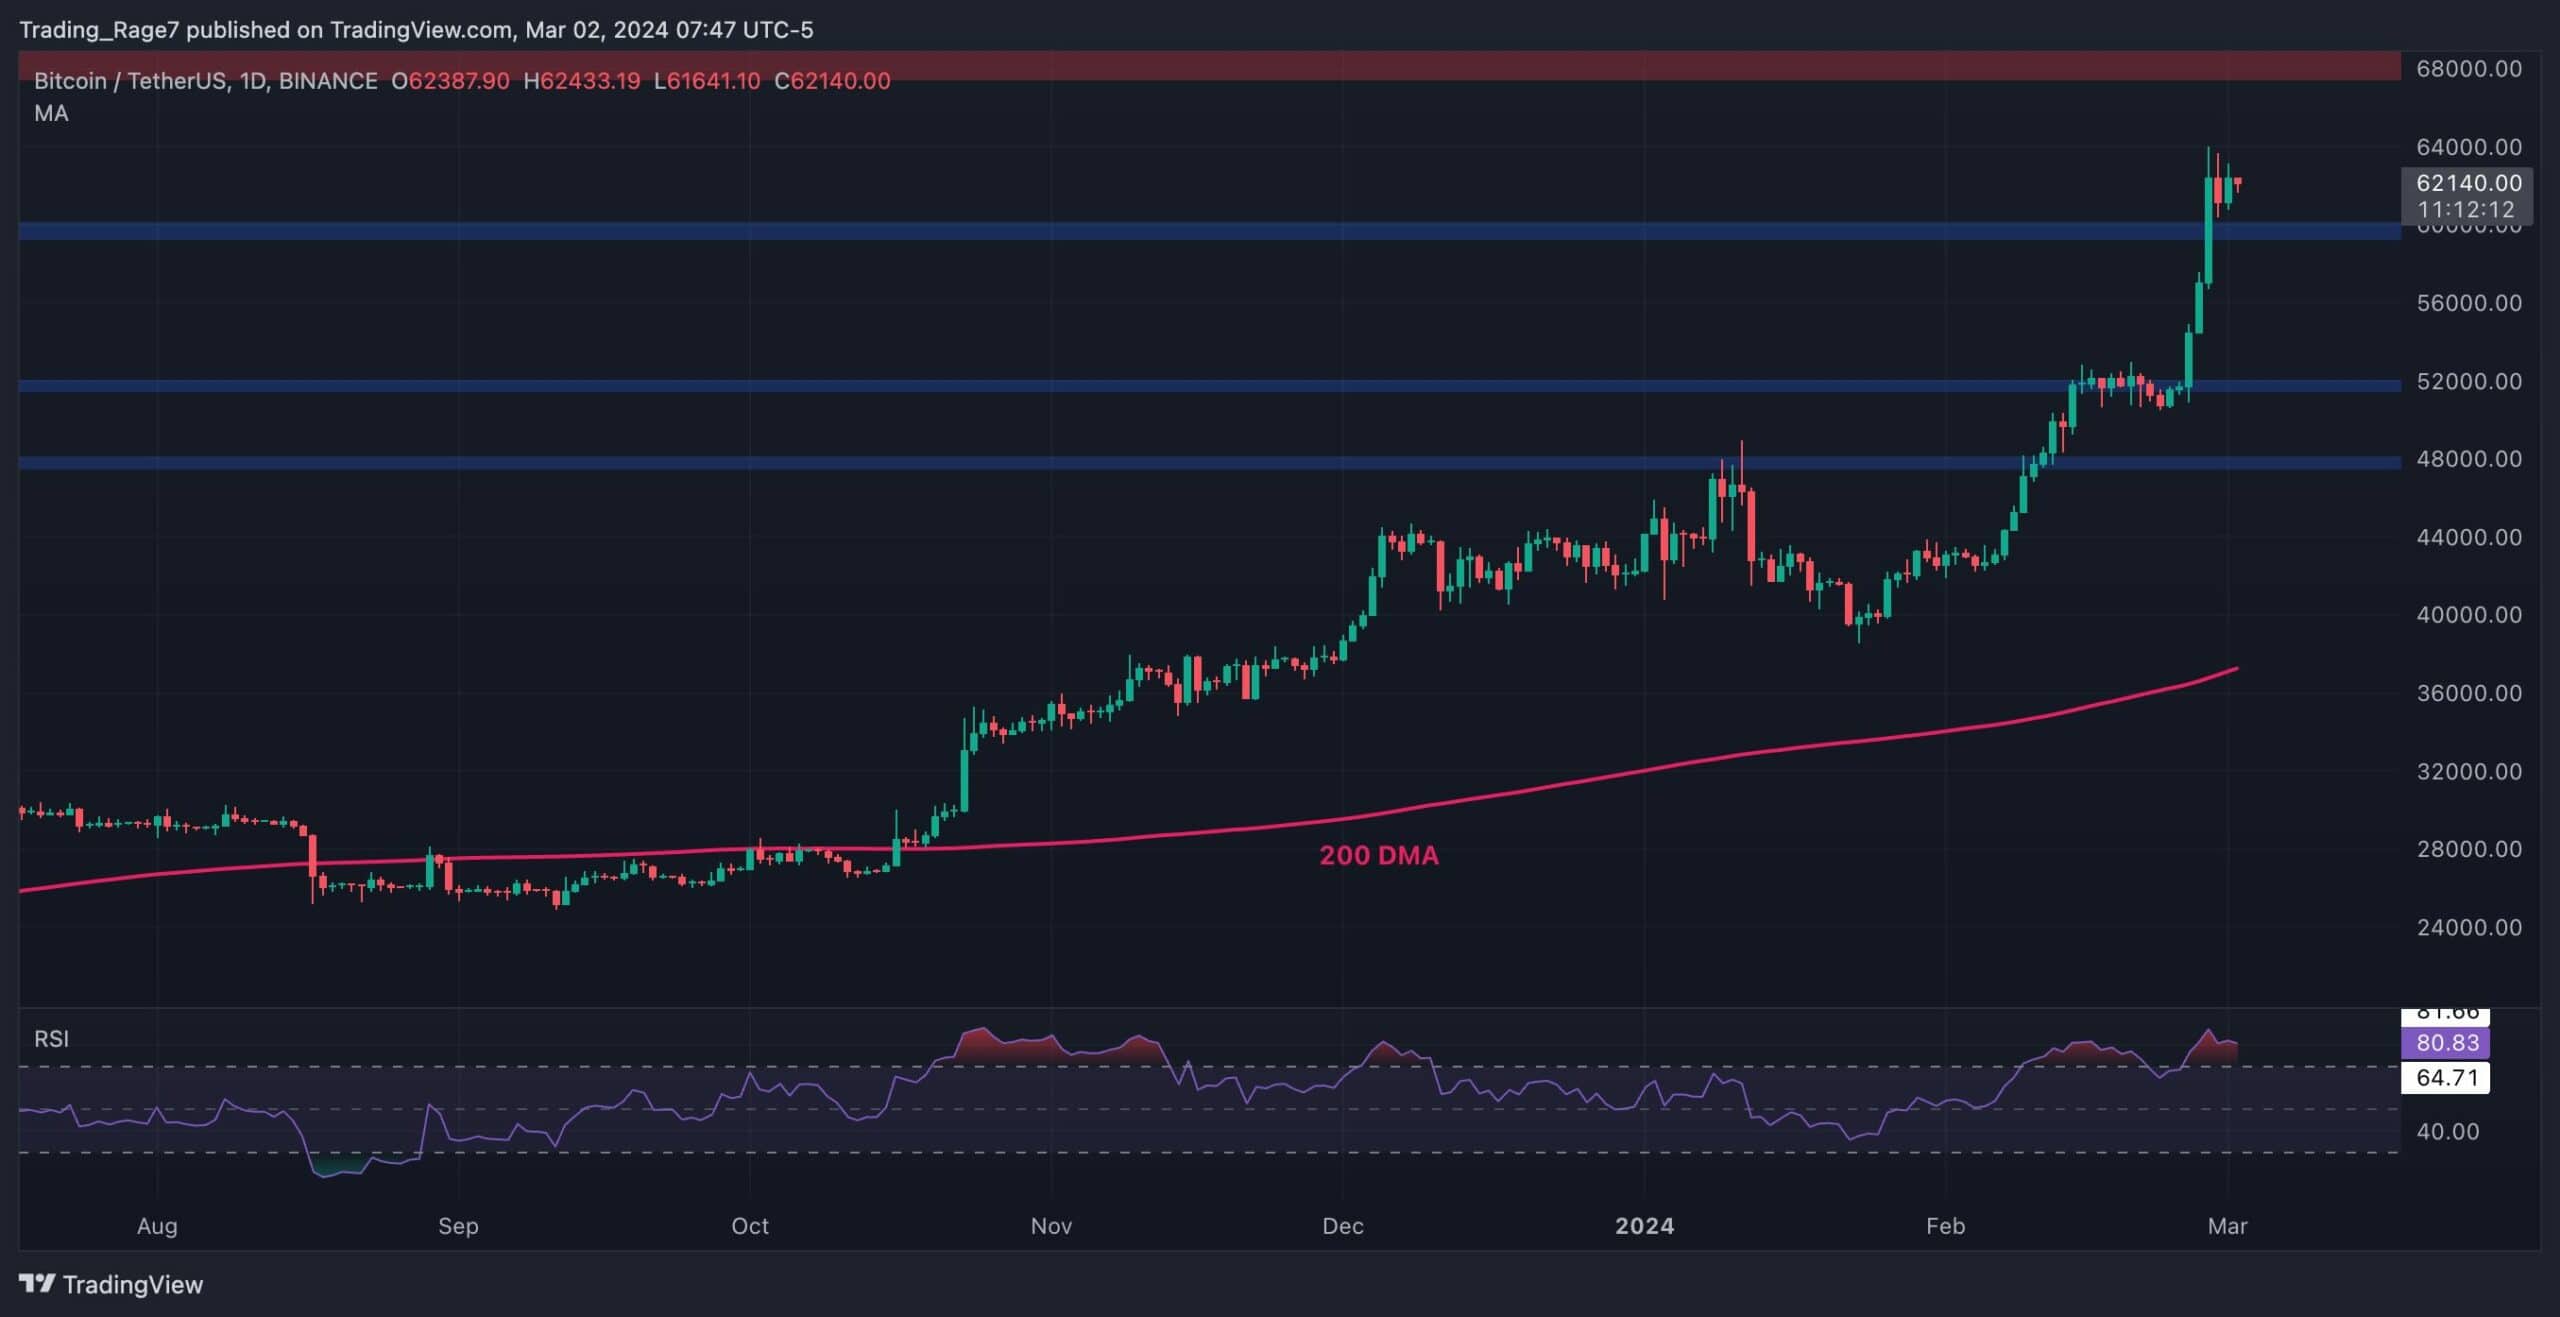
The Daily Chart
On the daily timeframe, it is evident that the price has been rallying aggressively during the last month, breaking past several significant resistance levels. The market is currently one step away from making a new all-time high, as there are no significant long-term resistance levels left apart from the $69K level itself.
Yet, the Relative Strength Index demonstrates a clear overbought signal that could point to a potential consolidation or pullback in the coming days.
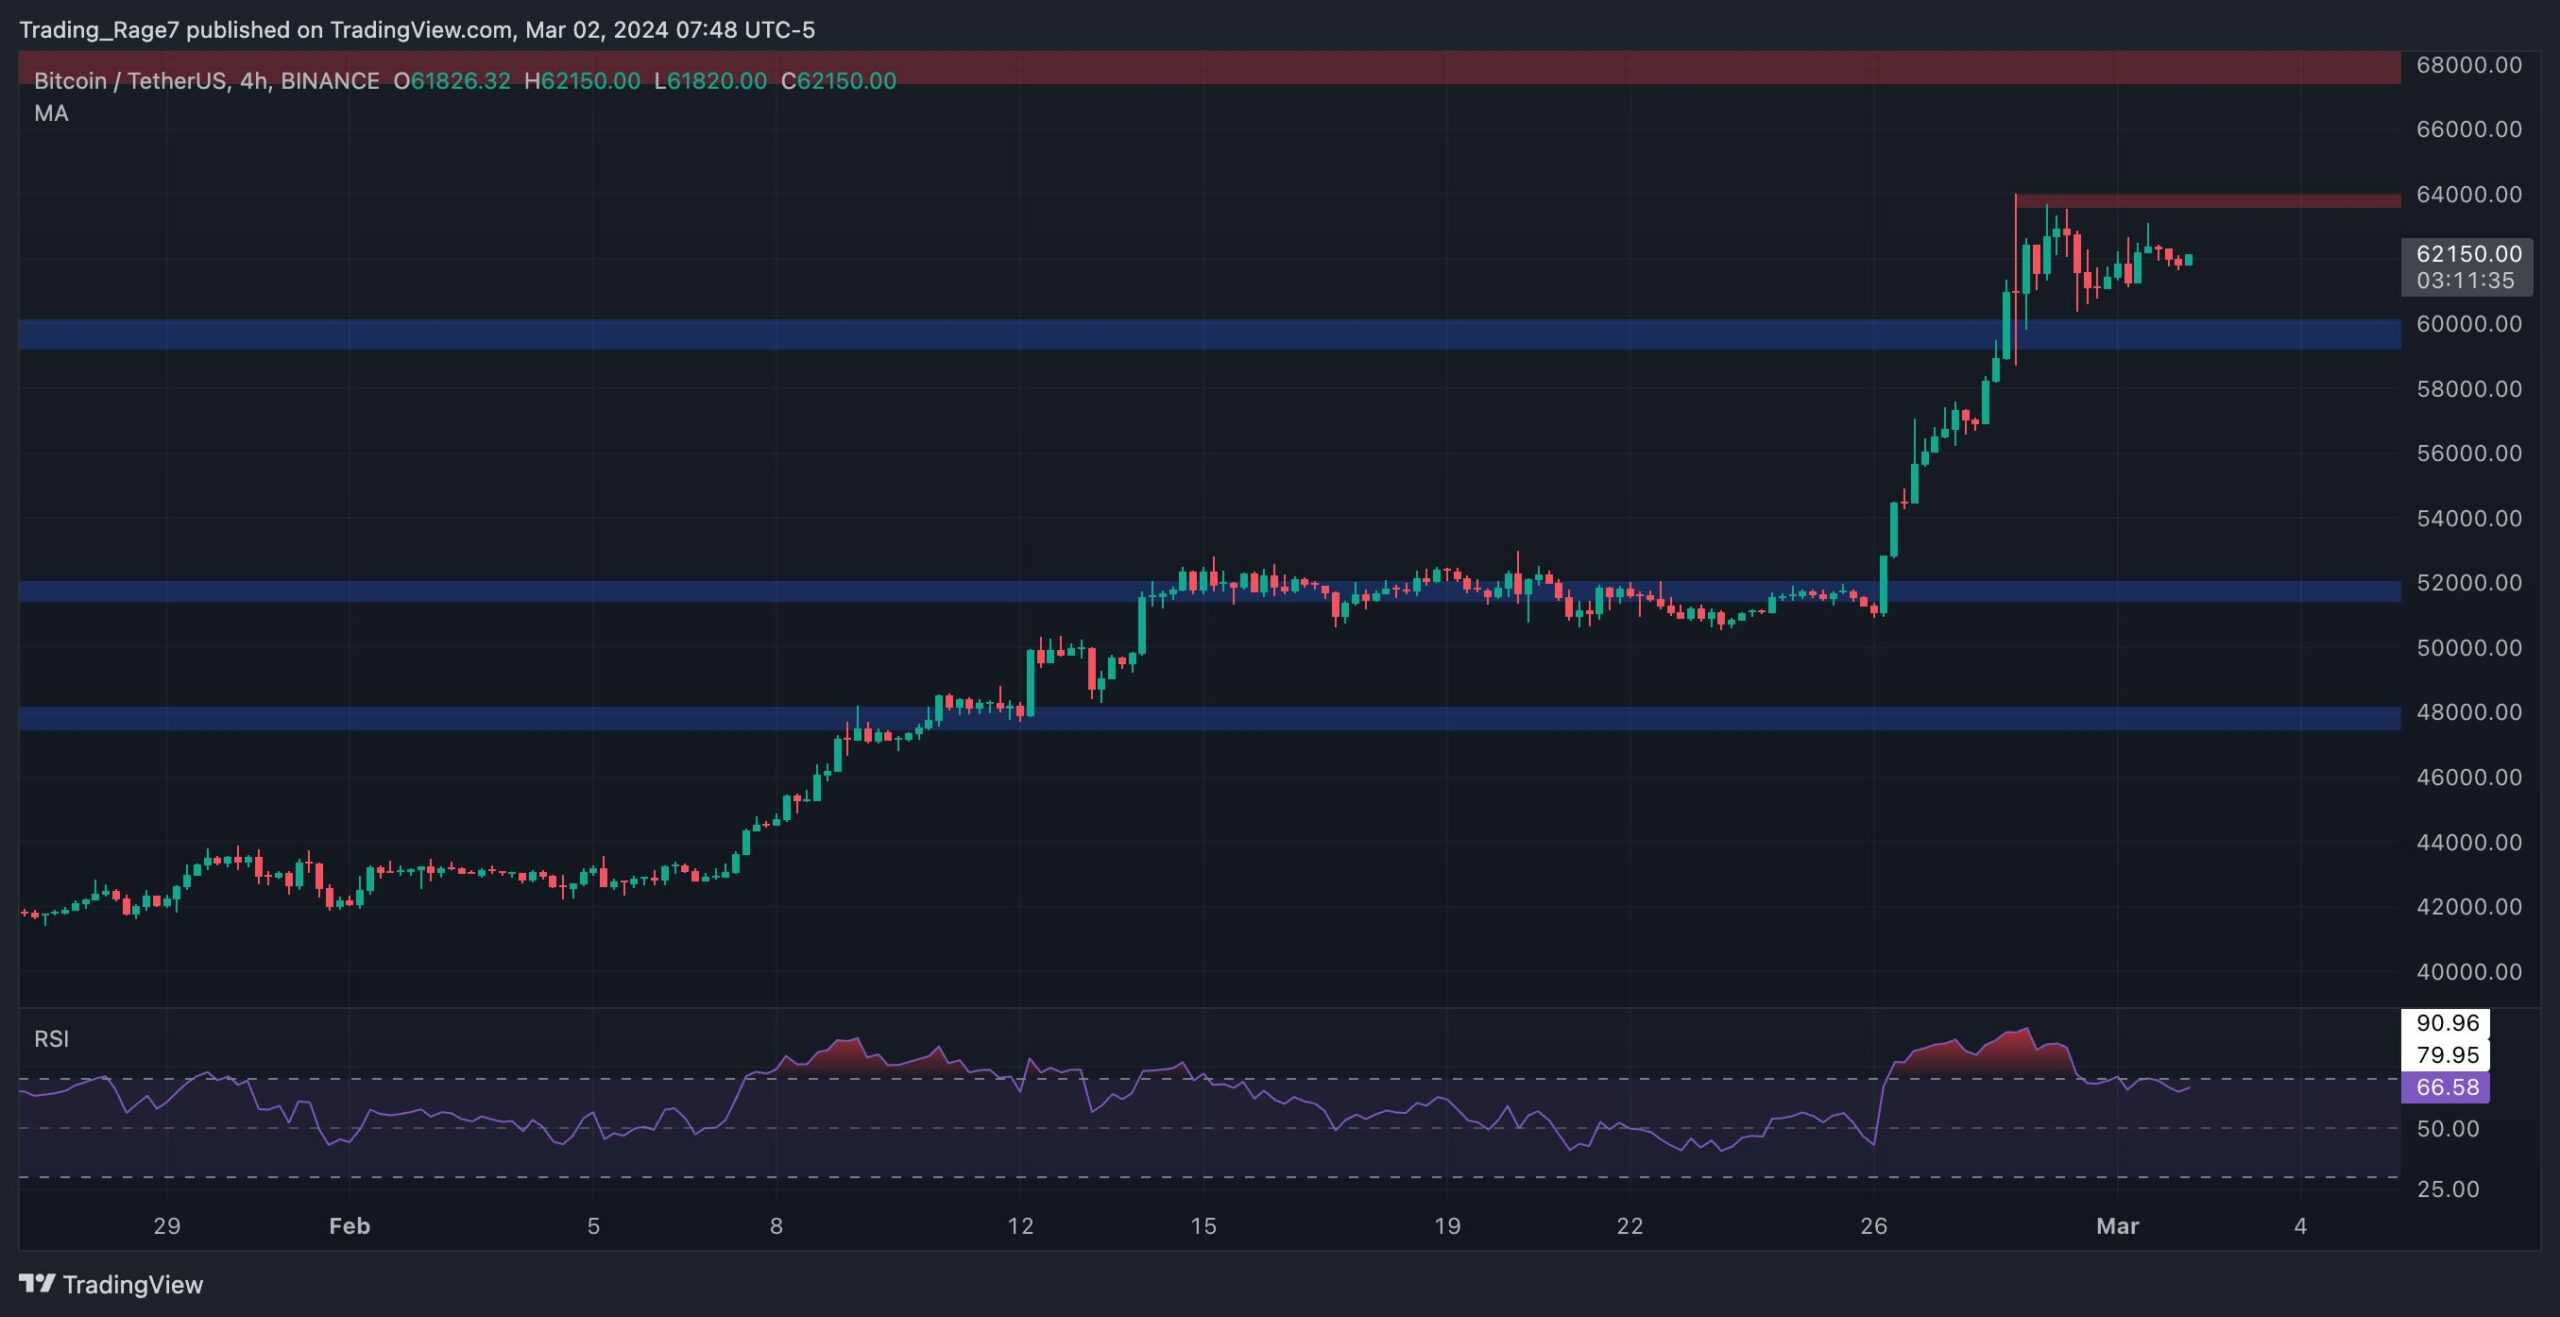
The 4-Hour Chart
Looking at the 4-hour timeframe, the price has created a short-term resistance level at the $64K mark. BTC has been consolidating between this level and the $60K support level recently.
Meanwhile, the Relative Strength Index is retreating from the overbought zone without the price showing a significant drop. This can be interpreted as a cooldown for momentum and hint at a potential continuation soon after a breakout from the $64K level.
Sentiment Analysis
By TradingRage
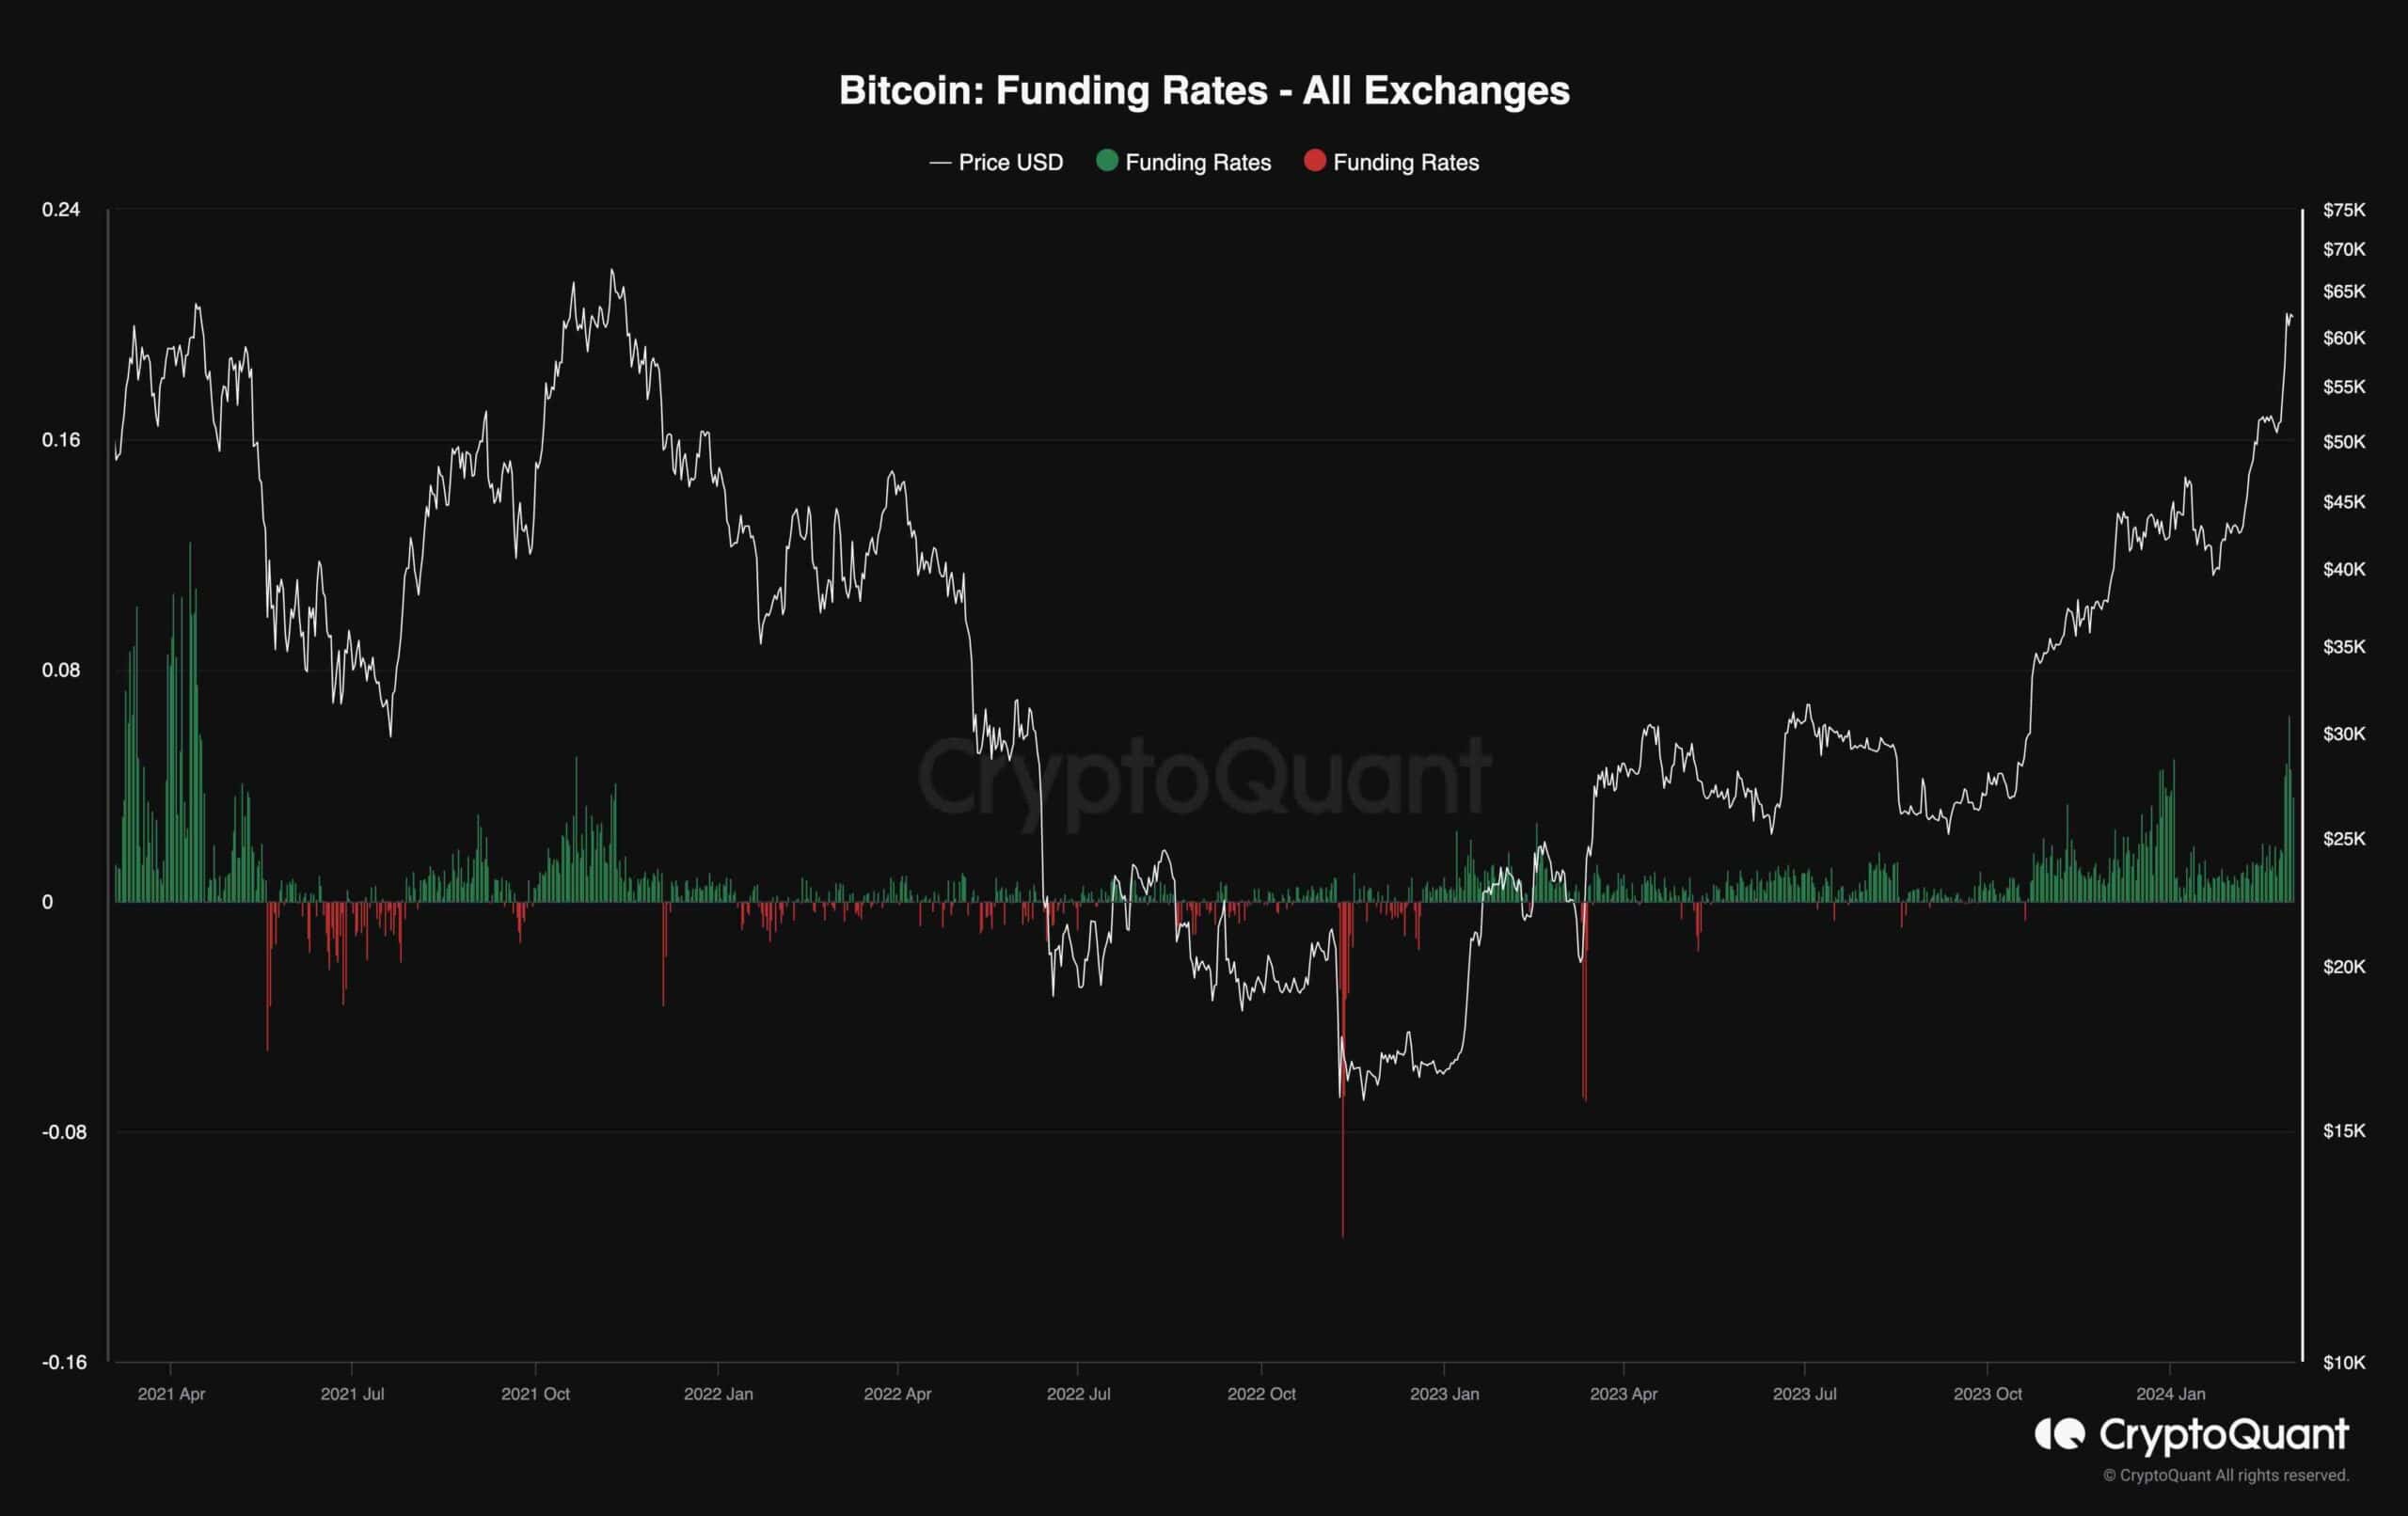
Bitcoin Funding Rates
While Bitcoin’s price is quickly approaching its all-time high, the market attracts many buyers and speculators. However, this extreme optimism might be costly in the short term.
This chart demonstrates the Bitcoin funding rates, one of the most valuable metrics for future market sentiment evaluation. Values above zero are associated with optimism, while negative values indicate bearish sentiment.
Currently, the funding rates are displaying high values, as they have spiked significantly in the last few days. This might result in a long liquidation cascade in the short term, which could then lead to a quick drop. Therefore, a correction might be due shortly before the bullish trend continues.