Bitcoin’s price has broken post a key level recently and is seemingly targeting a new all-time high in the short term. Technical Analysis By Edris Derakhshi (TradingRage) The Daily Chart On the daily chart, the price has finally broken above the K level and the 200-day moving average, which is located around the same mark. With the RSI also showing a clear bullish momentum, the cryptocurrency will likely continue its uptrend toward the K resistance zone in the short term. Otherwise, in case of a correction, the 200-day moving average is still likely to hold the price and push the market higher. Source: TradingViewThe 4-Hour Chart Looking at the 4-hour timeframe, the price has been creating higher highs and lows ever since its rebound from the K support level.
Topics:
CryptoVizArt considers the following as important: Bitcoin (BTC) Price, BTC Analysis, BTCEUR, BTCGBP, btcusd, btcusdt
This could be interesting, too:
Chayanika Deka writes XRP, SOL, and ADA Inclusion in US Crypto Reserve Pushes Traders on Edge
Chayanika Deka writes Why Arthur Hayes Is Bullish on Bitcoin Under Trump’s Economic Strategy
Mandy Williams writes Why the Bitcoin Market Is Stuck—and the Key Metric That Could Change It: CryptoQuant CEO
Wayne Jones writes Metaplanet Acquires 156 BTC, Bringing Total Holdings to 2,391
Bitcoin’s price has broken post a key level recently and is seemingly targeting a new all-time high in the short term.
Technical Analysis
By Edris Derakhshi (TradingRage)
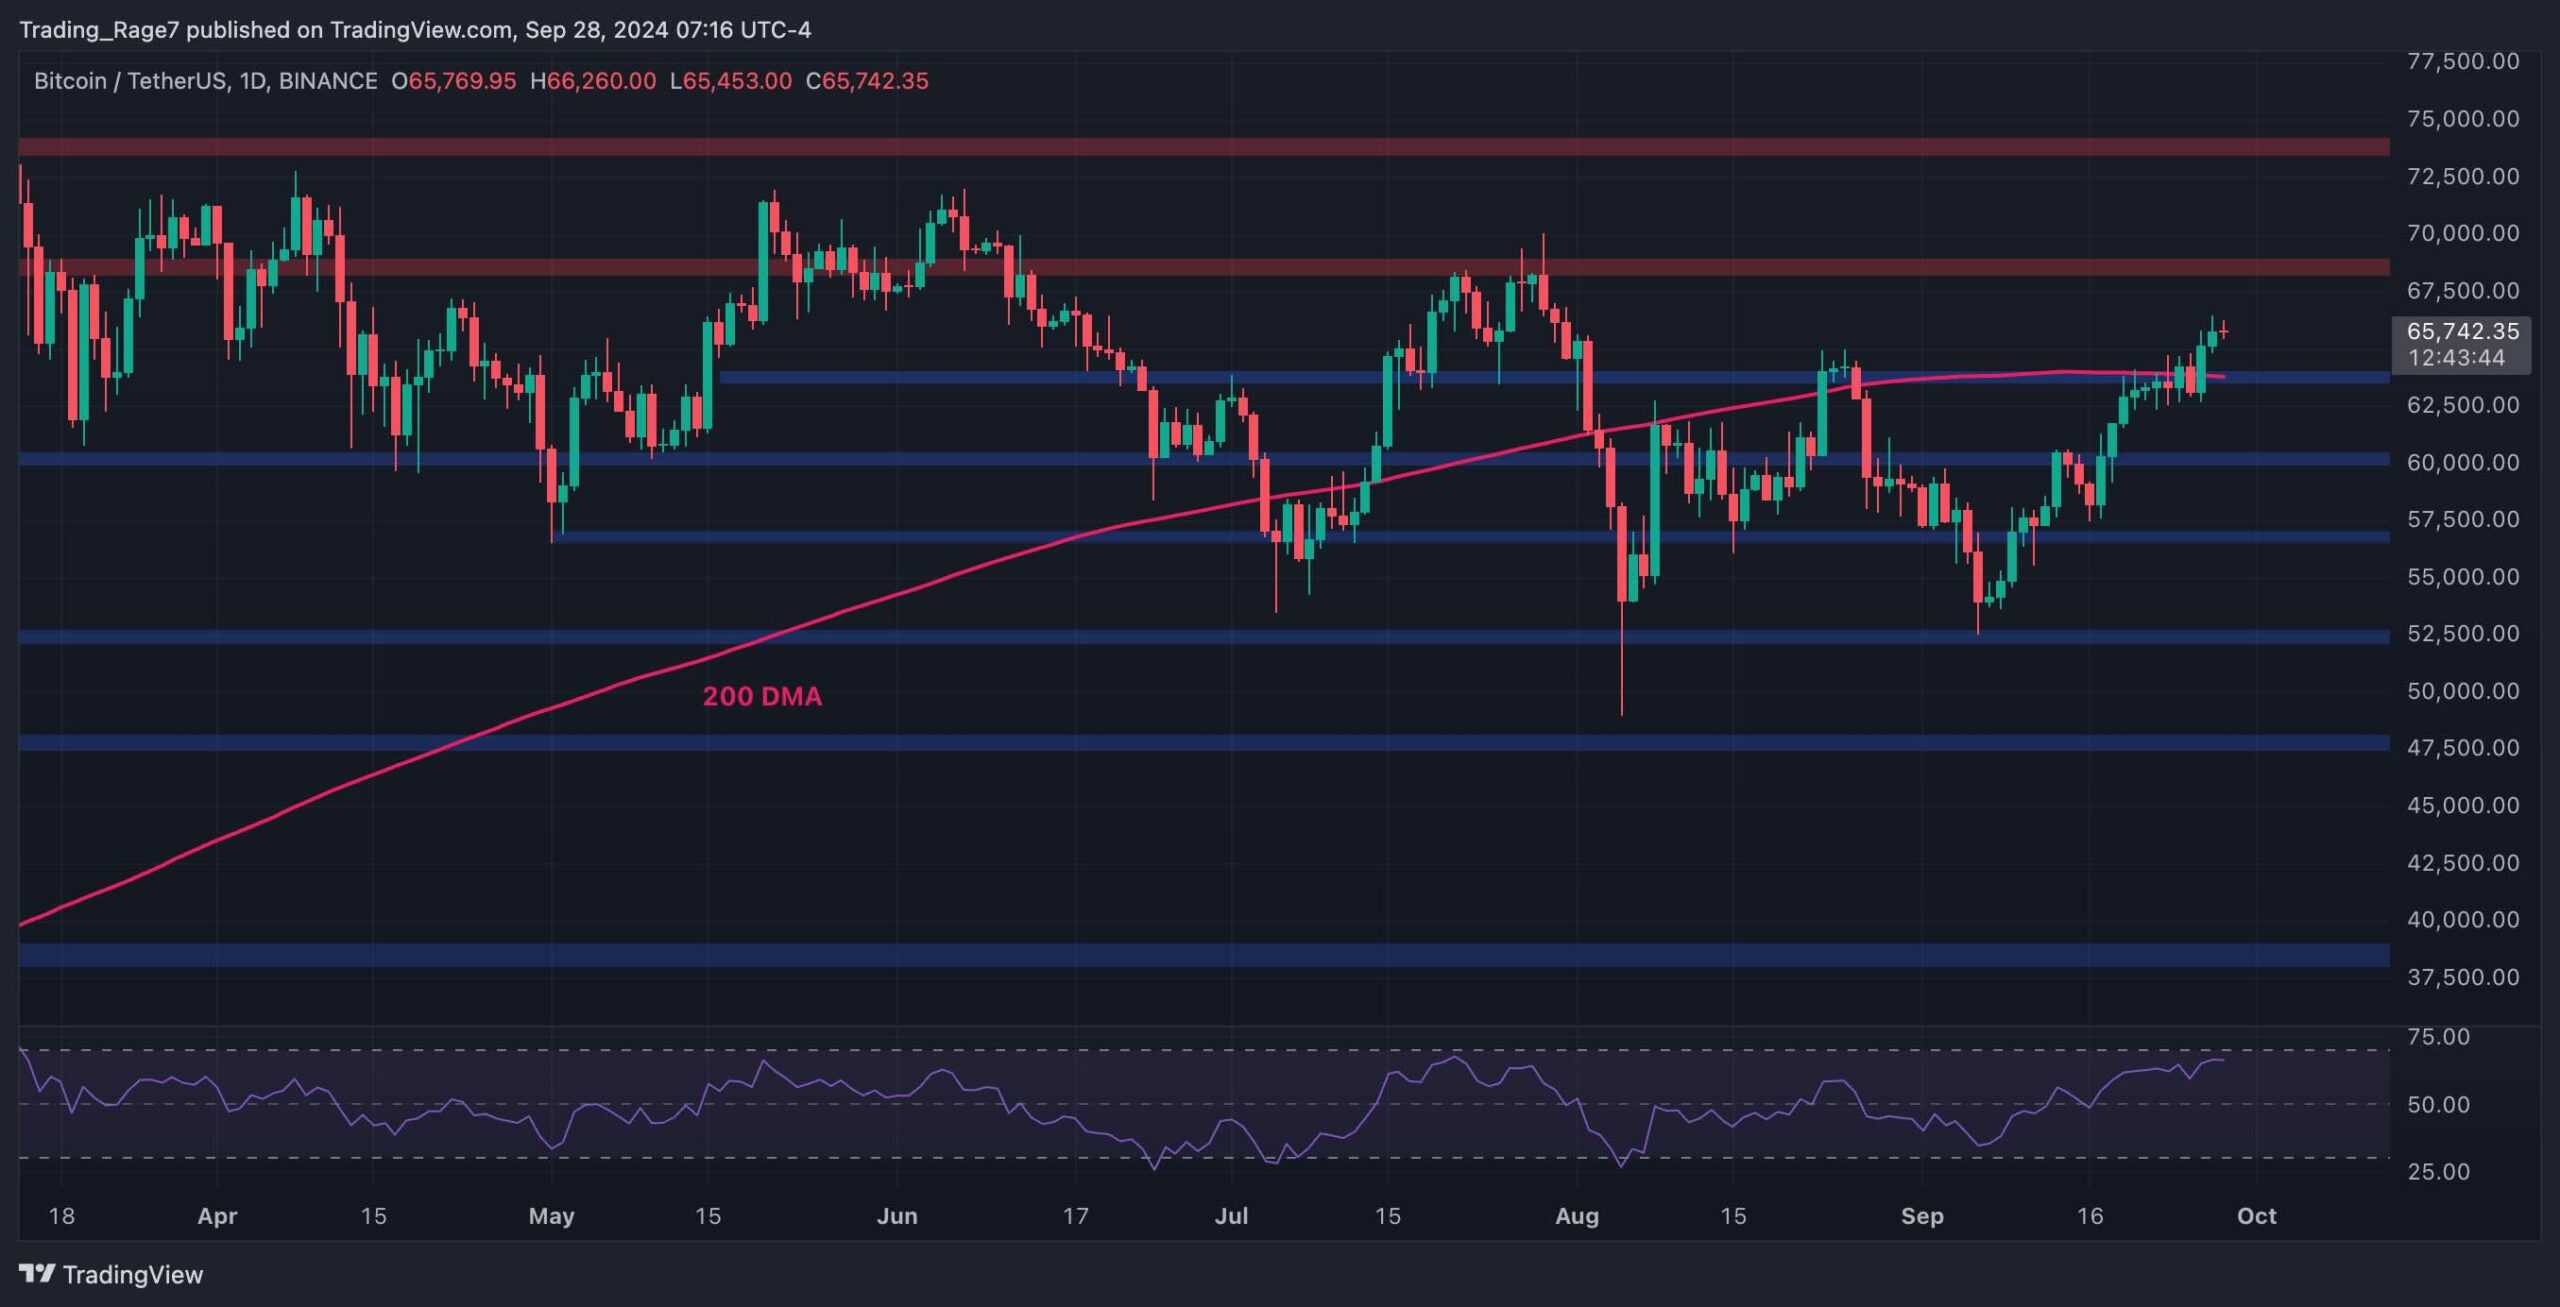
The Daily Chart
On the daily chart, the price has finally broken above the $64K level and the 200-day moving average, which is located around the same mark.
With the RSI also showing a clear bullish momentum, the cryptocurrency will likely continue its uptrend toward the $68K resistance zone in the short term.
Otherwise, in case of a correction, the 200-day moving average is still likely to hold the price and push the market higher.
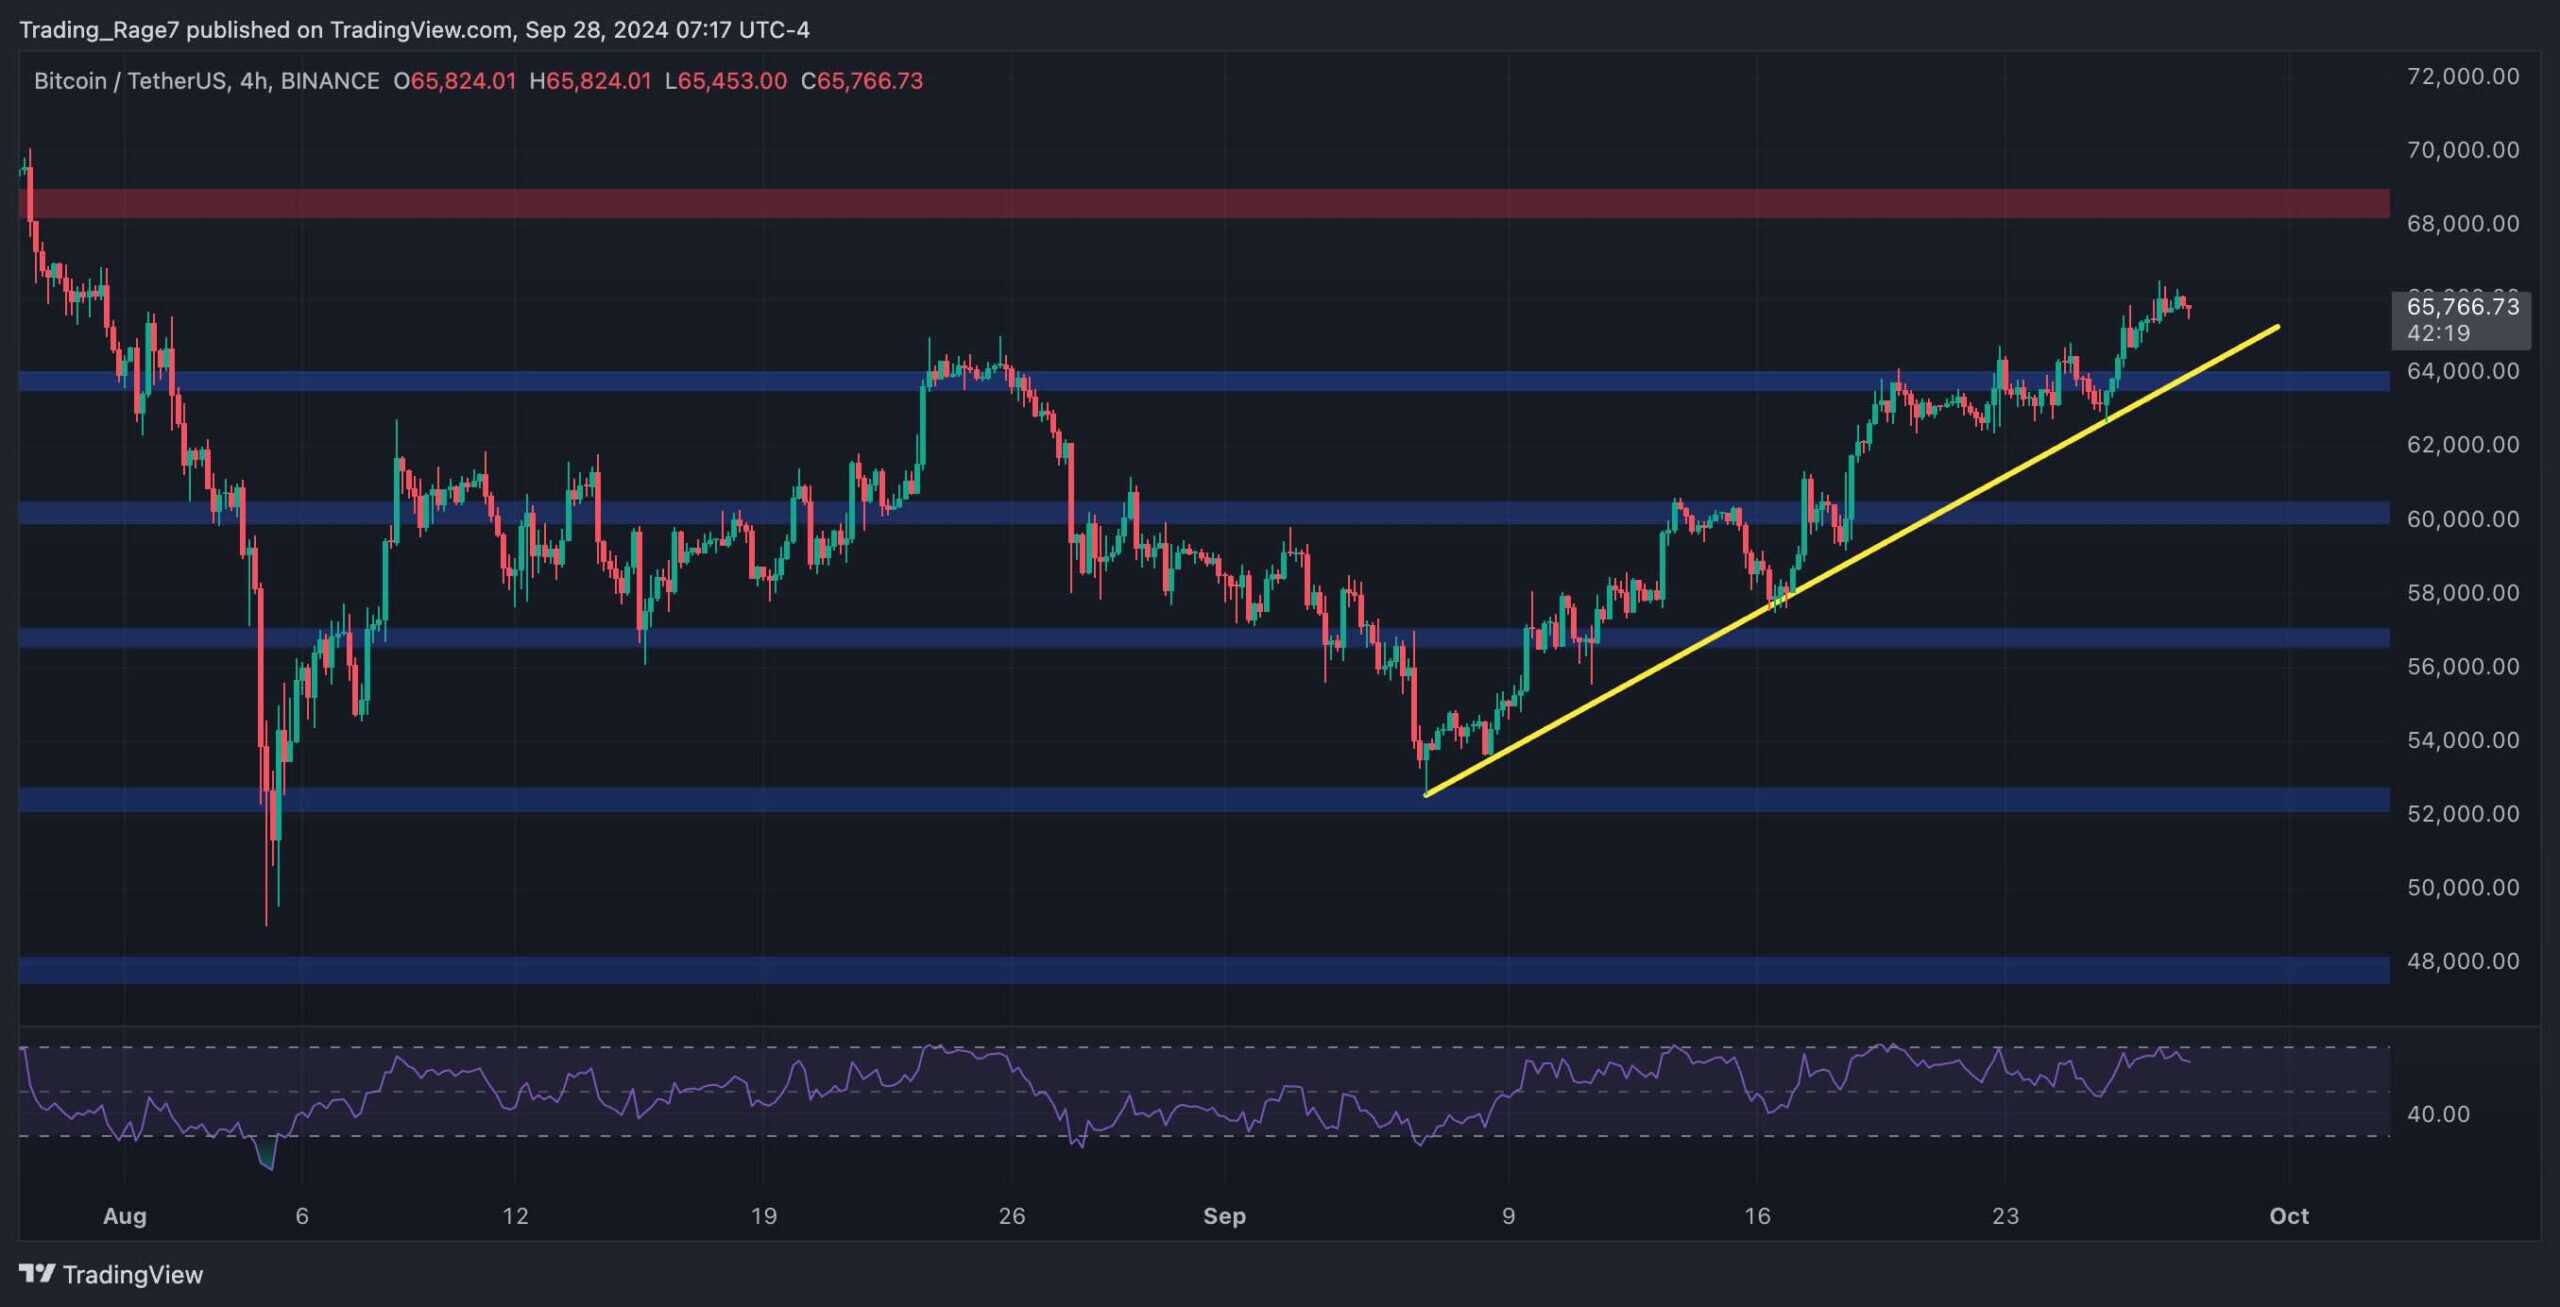
The 4-Hour Chart
Looking at the 4-hour timeframe, the price has been creating higher highs and lows ever since its rebound from the $52K support level.
The market’s bullish move has created a clear trendline, which has been supporting Bitcoin for weeks. If this trend remains intact, it will only be a matter of time before the market reaches the $68K level.
On the other hand, if the trendline gets broken to the downside, at least a pullback to the $60K level would be probable.
On-Chain Analysis
By Edris Derakhshi (TradingRage)
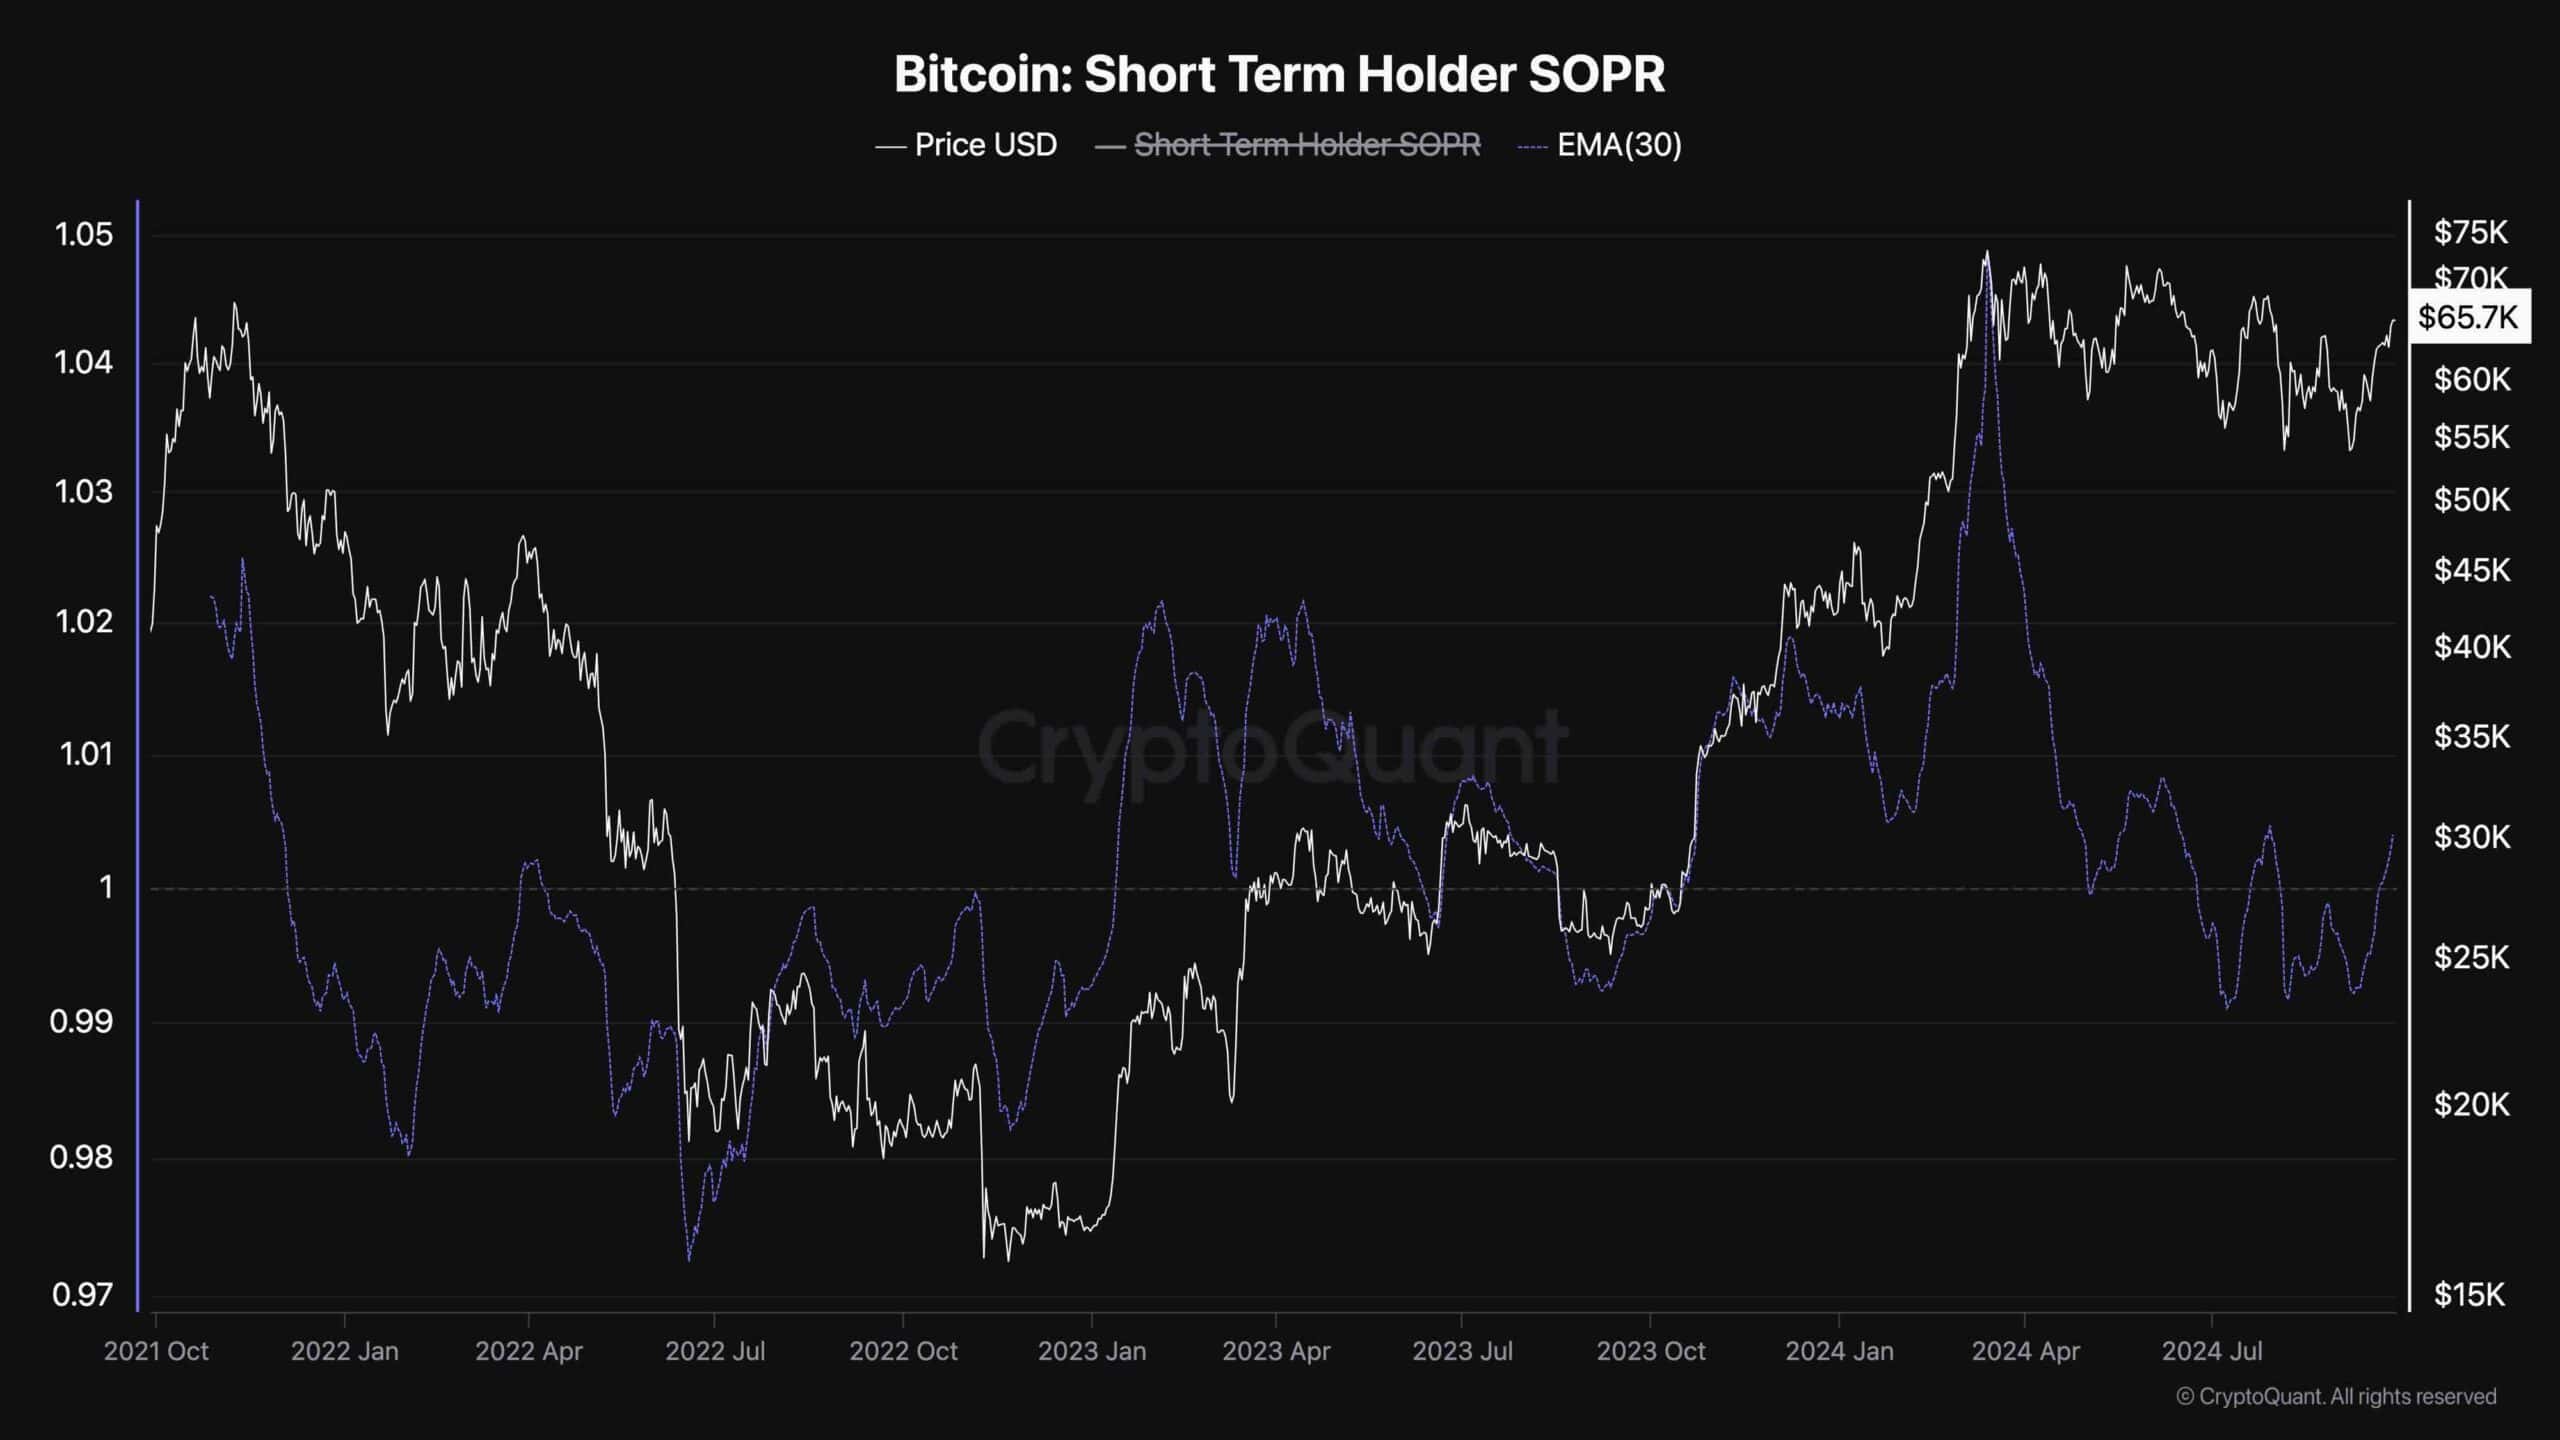
Bitcoin Short-Term Holder SOPR
During the recent Bitcoin price consolidation and gradual correction, many short-term holders, even those not in profit, panicked and sold their coins. This chart shows the Bitcoin Short-Term Holder SOPR, which measures the ratio of profits/losses realized by short-term investors.
As the chart suggests, the STH SOPR made a new record high when the price hit $70K first, but it has rapidly declined during the past few months. Short-term holders have even been realizing losses since July, as the metric has dropped below one. However, with the recent price rally, these investors are now realizing profits once again.
While this is a natural behavior in bull markets, if the selling pressure resulting from this profit-taking is not met with sufficient demand, the price could drop lower again.