Bitcoin’s price experienced a massive drop yesterday, fluctuating over 10% in 24 hours. While the cryptocurrency has yet to break below any significant support level, analyzing the root of this move and what it means for the market is essential. Yesterday’s crash, albeit caused by a questionable report, provides some insightful data from a technical perspective. Technical Analysis By TradingRage The Daily Chart On the daily chart, it is evident that the price has been consistently making higher highs and lows for months, rising above K once more. The bullish trend has especially gained momentum since breaking back above the 200-day moving average. However, the price is now trading so far above the moving average, which is located around the K mark. This significant
Topics:
CryptoVizArt considers the following as important: Bitcoin (BTC) Price, BTC Analysis, BTCEUR, BTCGBP, btcusd, btcusdt
This could be interesting, too:
Chayanika Deka writes XRP, SOL, and ADA Inclusion in US Crypto Reserve Pushes Traders on Edge
Chayanika Deka writes Why Arthur Hayes Is Bullish on Bitcoin Under Trump’s Economic Strategy
Mandy Williams writes Why the Bitcoin Market Is Stuck—and the Key Metric That Could Change It: CryptoQuant CEO
Wayne Jones writes Metaplanet Acquires 156 BTC, Bringing Total Holdings to 2,391
Bitcoin’s price experienced a massive drop yesterday, fluctuating over 10% in 24 hours. While the cryptocurrency has yet to break below any significant support level, analyzing the root of this move and what it means for the market is essential.
Yesterday’s crash, albeit caused by a questionable report, provides some insightful data from a technical perspective.
Technical Analysis
By TradingRage
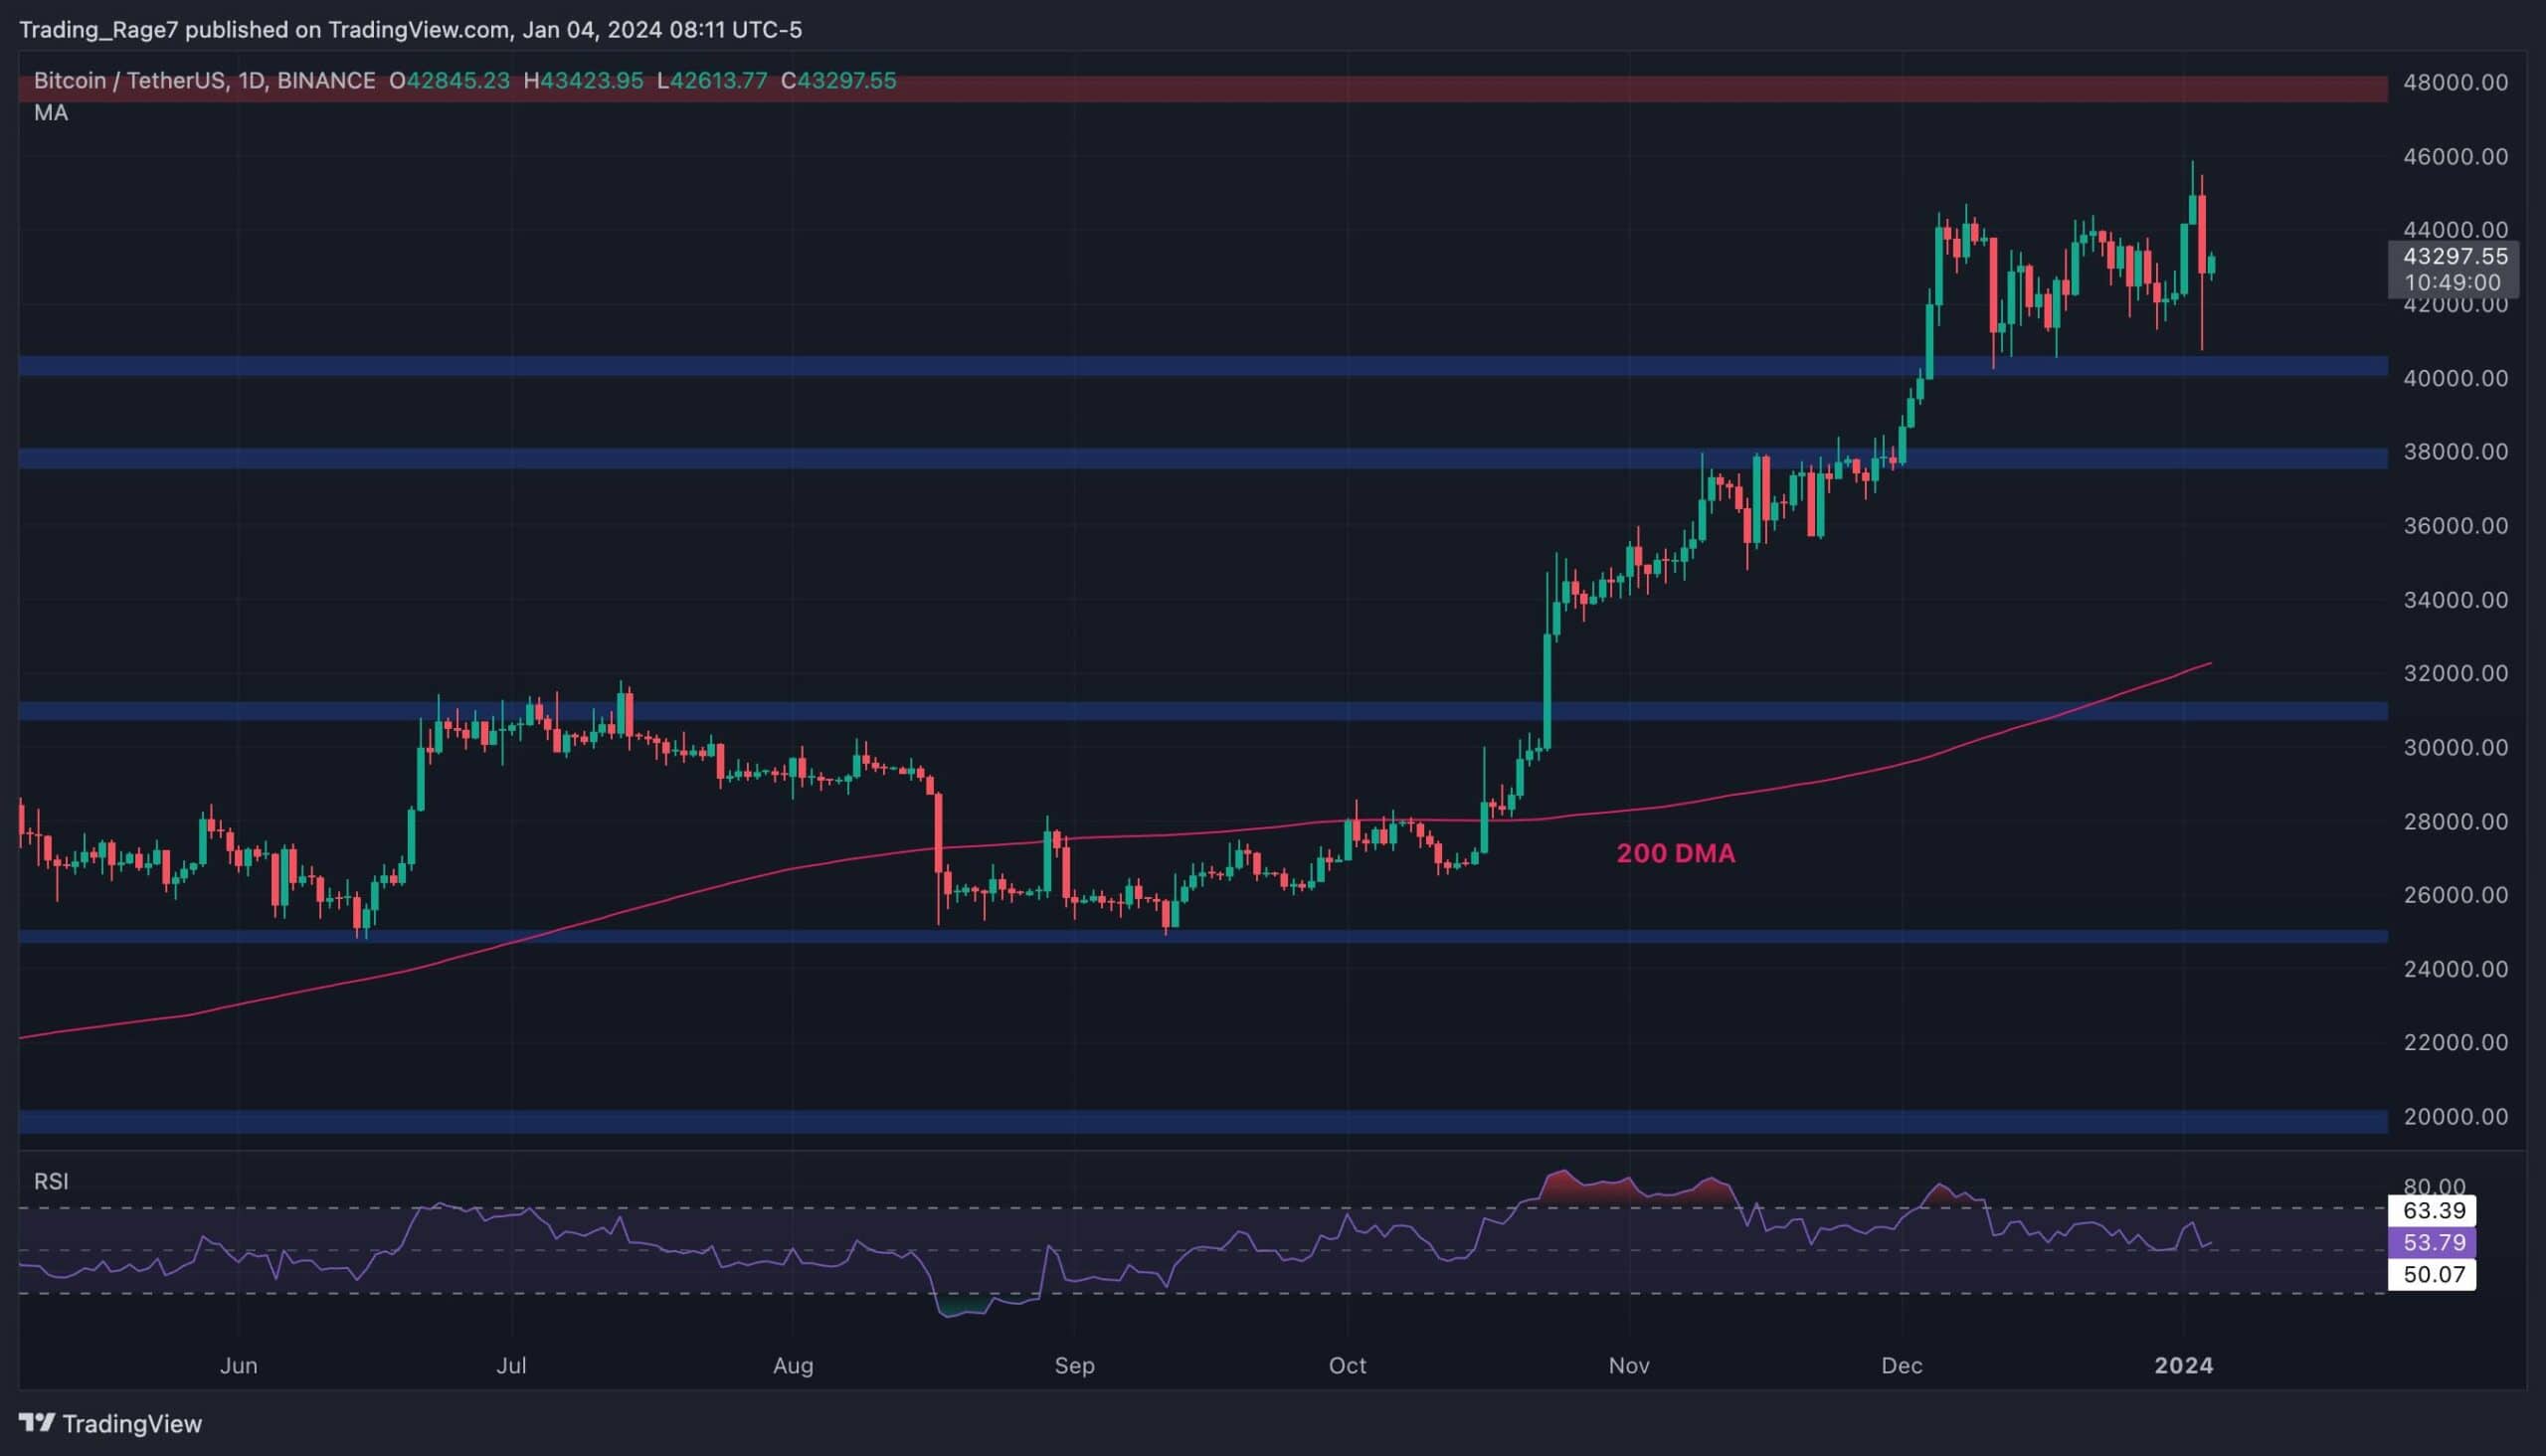
The Daily Chart
On the daily chart, it is evident that the price has been consistently making higher highs and lows for months, rising above $40K once more. The bullish trend has especially gained momentum since breaking back above the 200-day moving average. However, the price is now trading so far above the moving average, which is located around the $32K mark. This significant distance in itself is a sign of over-valuation for BTC.
Yesterday’s drop could be the beginning of a deeper pullback toward the 200-day moving average in the short term. Yet, for this pullback to materialize, the $40K level should be broken down first, or a bullish continuation will still be the case.
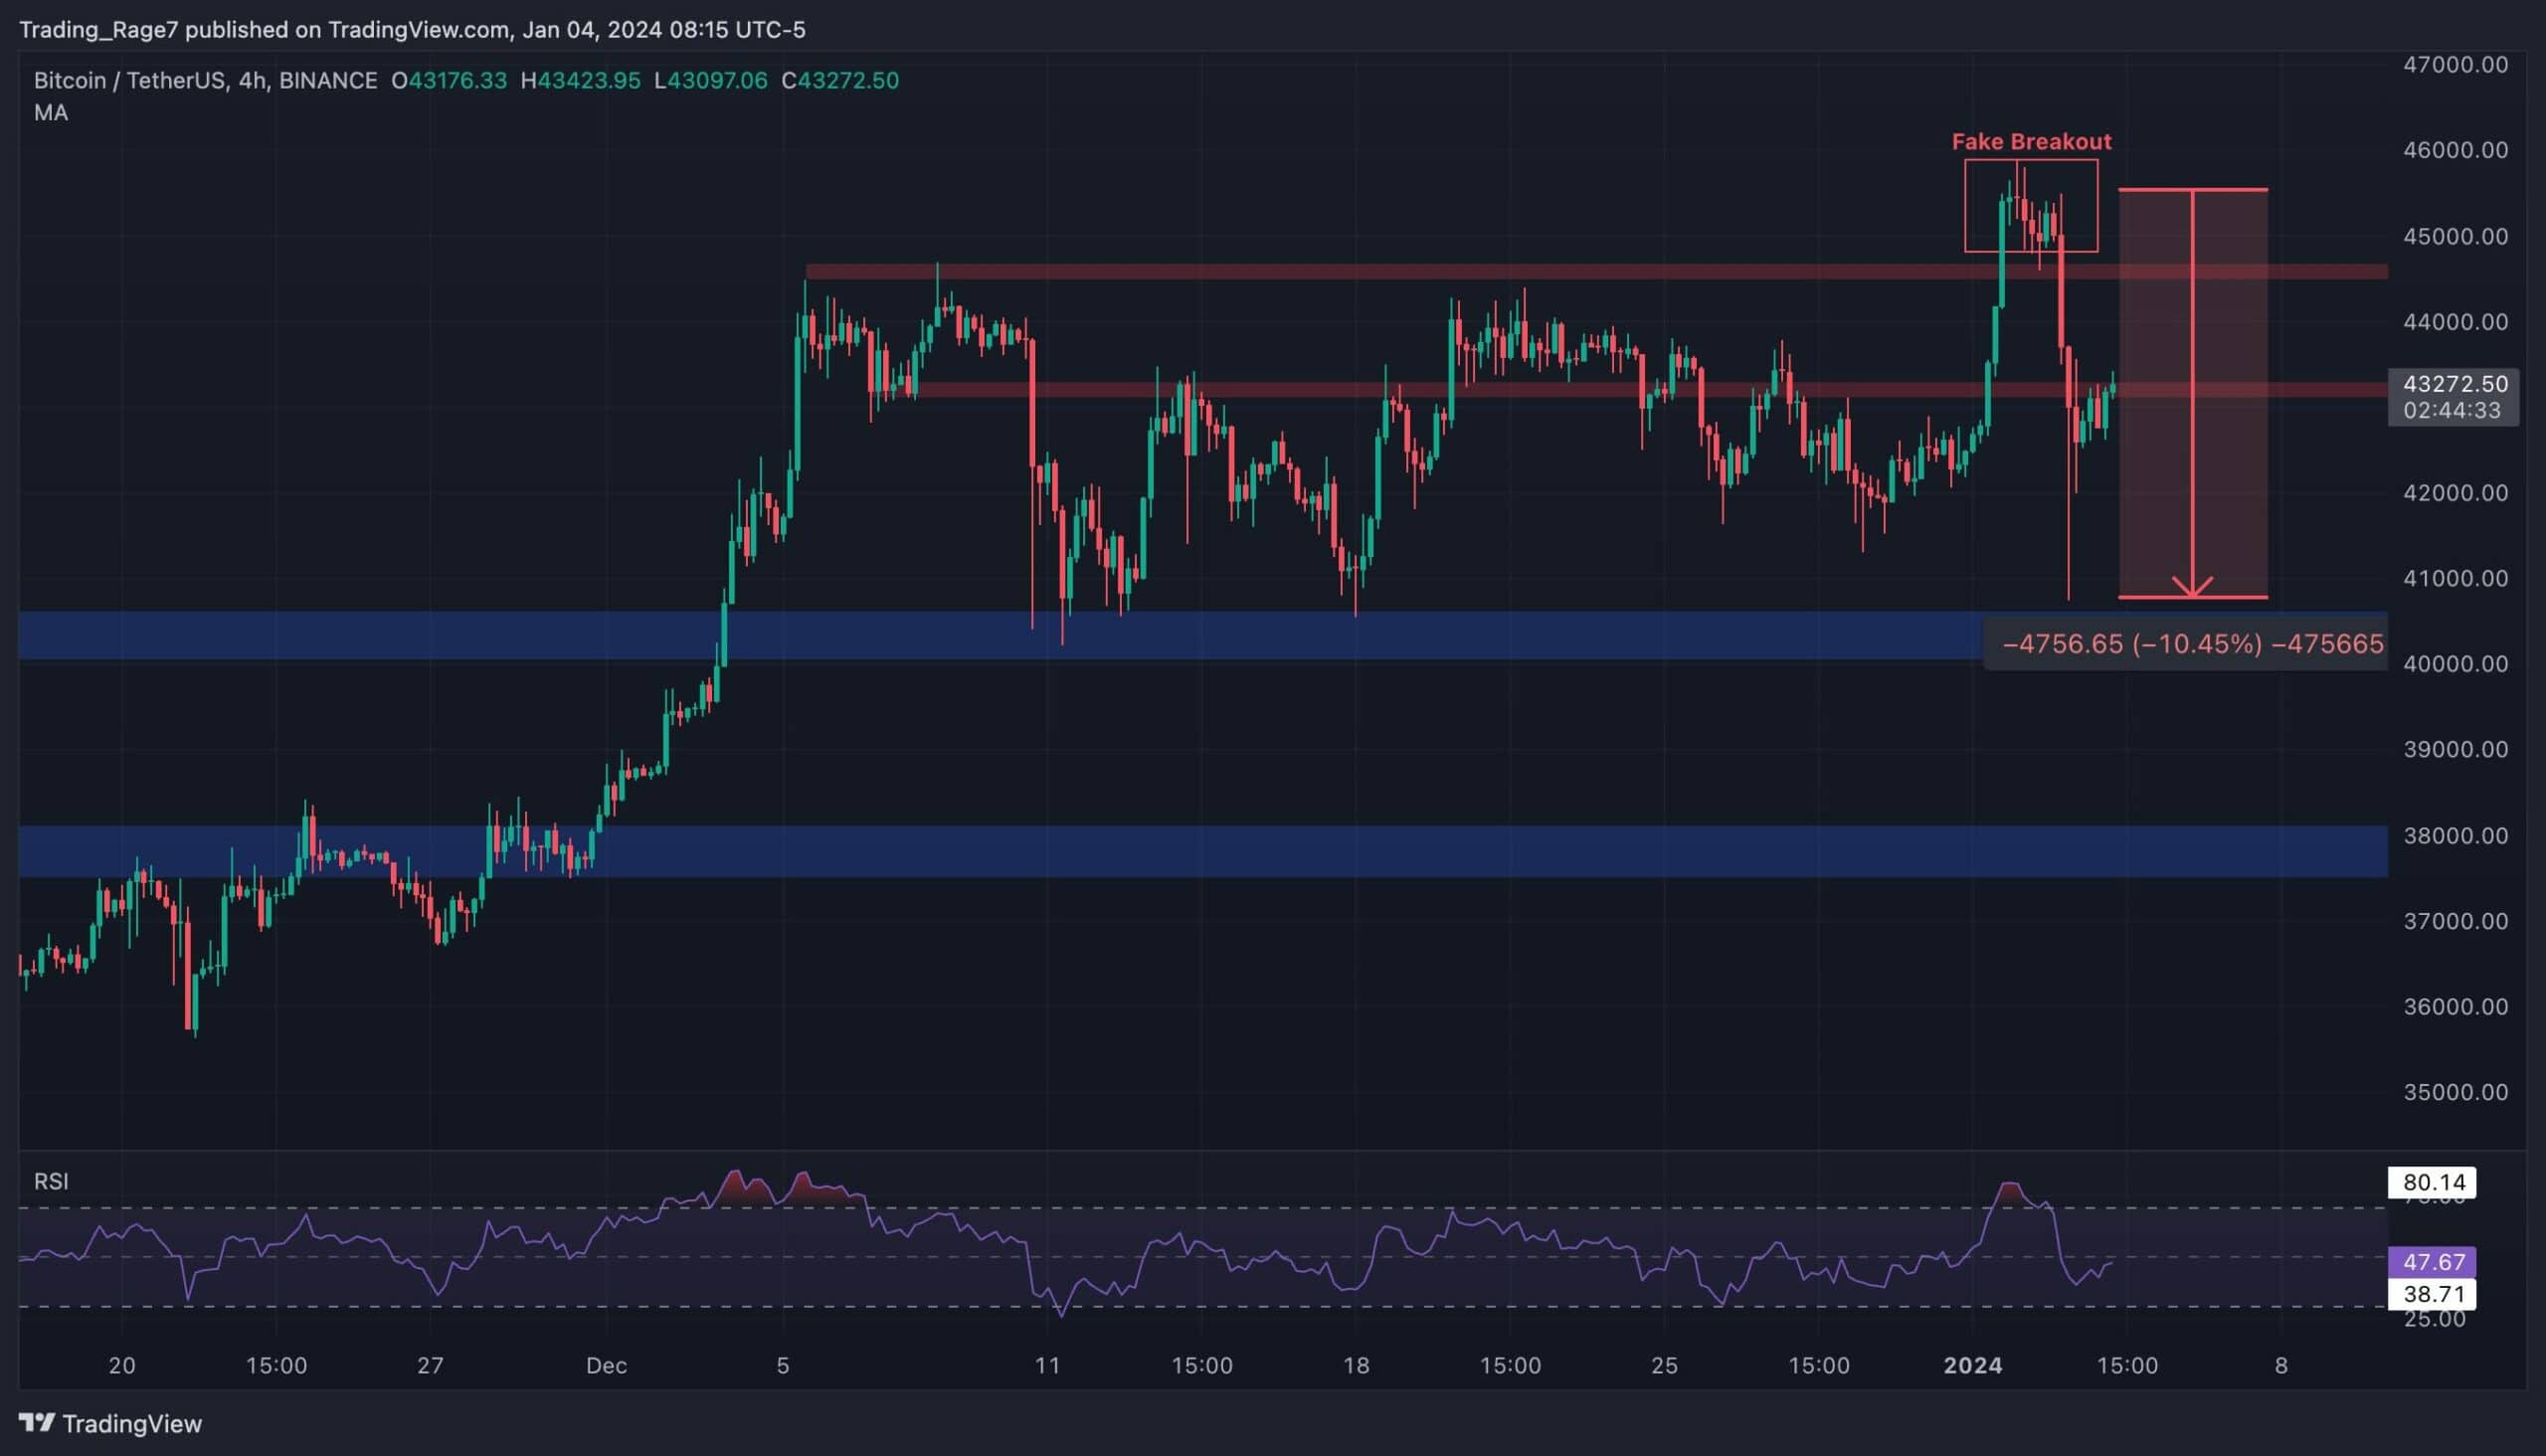
The 4-Hour Chart
The 4-hour chart paints a much more meaningful picture, giving clues about why yesterday’s drop occurred. After consolidating between the $40K and $45K levels for almost a month, BTC’s price finally broke the range to the upside earlier this week.
However, with the Relative Strength Index showing a clear overbought signal and a sudden drop afterward, the bullish move was clearly a fake breakout. Currently, the price is testing the short-term resistance level around the $43,300 mark. In case it fails to climb back above, a future drop toward the $40K level would be imminent. The fate of BTC’s short-term trend would then rely on the price’s reaction to the $40K area.
On-Chain Analysis
By TradingRage
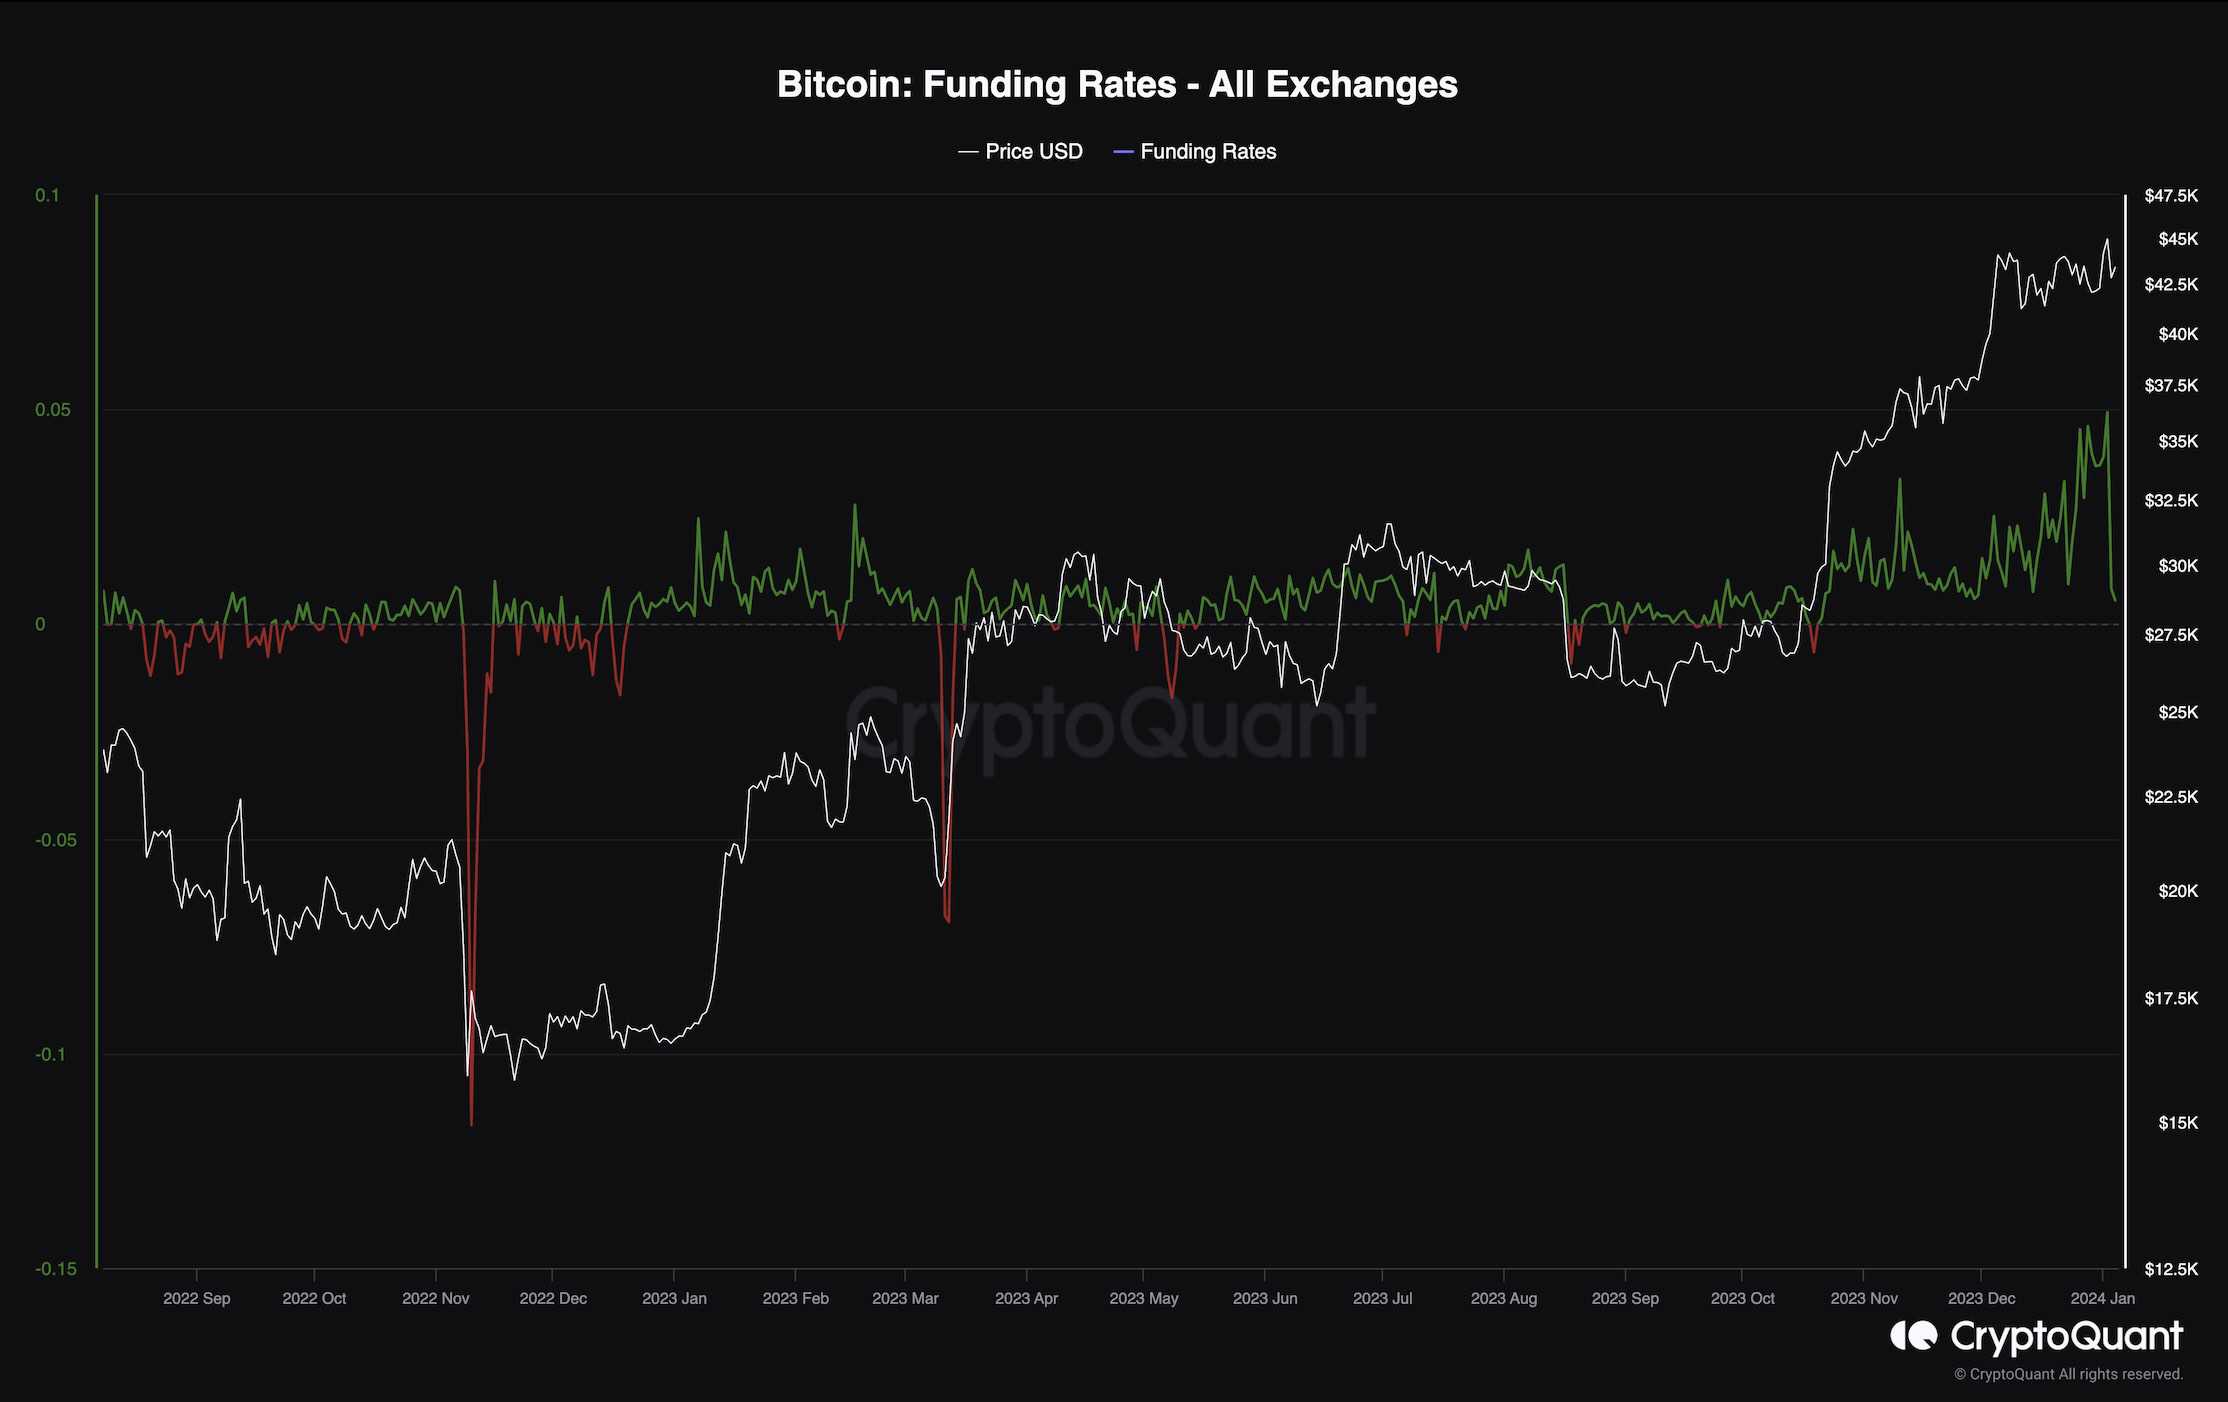
Bitcoin Funding Rates
Bitcoin’s recovery following the drop to $15K in December 2022 has been one to watch. The price has been rising with increasing momentum, and BTC is now trading above $40K once again. This bullish trend shift has drawn many investors and traders back to the market, especially the perpetual futures market, which is the speculators’ favorite.
This chart represents the funding rates, one of the most important metrics when it comes to futures market sentiment evaluation. This metric demonstrates whether the buyers or the sellers are executing more aggressively (taker orders) on aggregate. Positive values indicate bullish sentiment, while negative ones are considered bearish.
During the recent rally, the funding rates have spiked significantly, pointing to the fact that the investors have been very optimistic about the future trend. Yet, yesterday’s sudden drop was an apparent side effect. High funding rates increase the likelihood of long liquidation cascades, leading to rapid price declines, which is precisely what happened yesterday.
The funding rates are still positive but back to more conservative values, which is a good sign, as the futures market is no longer overheated. This paves the way for a more sustainable bullish trend in the coming months if things do not change drastically.