Ripple’s price has been trending lower against BTC and consolidating against USDT. While XRP has been underperforming over the last few months, investors can still be optimistic as significant support levels are available. Technical Analysis By TradingRage The USDT Paired Chart Against USDT, the XRP price has been steadily declining since failing to break through the %excerpt%.7 resistance level. However, support has been found to be around %excerpt%.6, preventing further drops. Should this mark fail, there’s potential for a turnaround near the 200-day moving average, situated around %excerpt%.57, offering another possible support level for XRP. On the other hand, a rebound from this level can lead to a potential rise toward %excerpt%.7. Source: TradingViewThe BTC Paired Chart Examining the Bitcoin
Topics:
CryptoVizArt considers the following as important: Ripple (XRP) Price, XRP Analysis, xrpbtc, xrpusd
This could be interesting, too:
Jordan Lyanchev writes Ripple’s (XRP) Surge to Triggers Over Million in Short Liquidations
Jordan Lyanchev writes Trump Confirms Work on Strategic Crypto Reserve: XRP, ADA, SOL Included
Dimitar Dzhondzhorov writes Is a Major Ripple v. SEC Lawsuit Development Expected This Week? Here’s Why
Mandy Williams writes Ripple Releases Institutional DeFi Roadmap for XRP Ledger in 2025
Ripple’s price has been trending lower against BTC and consolidating against USDT. While XRP has been underperforming over the last few months, investors can still be optimistic as significant support levels are available.
Technical Analysis
By TradingRage
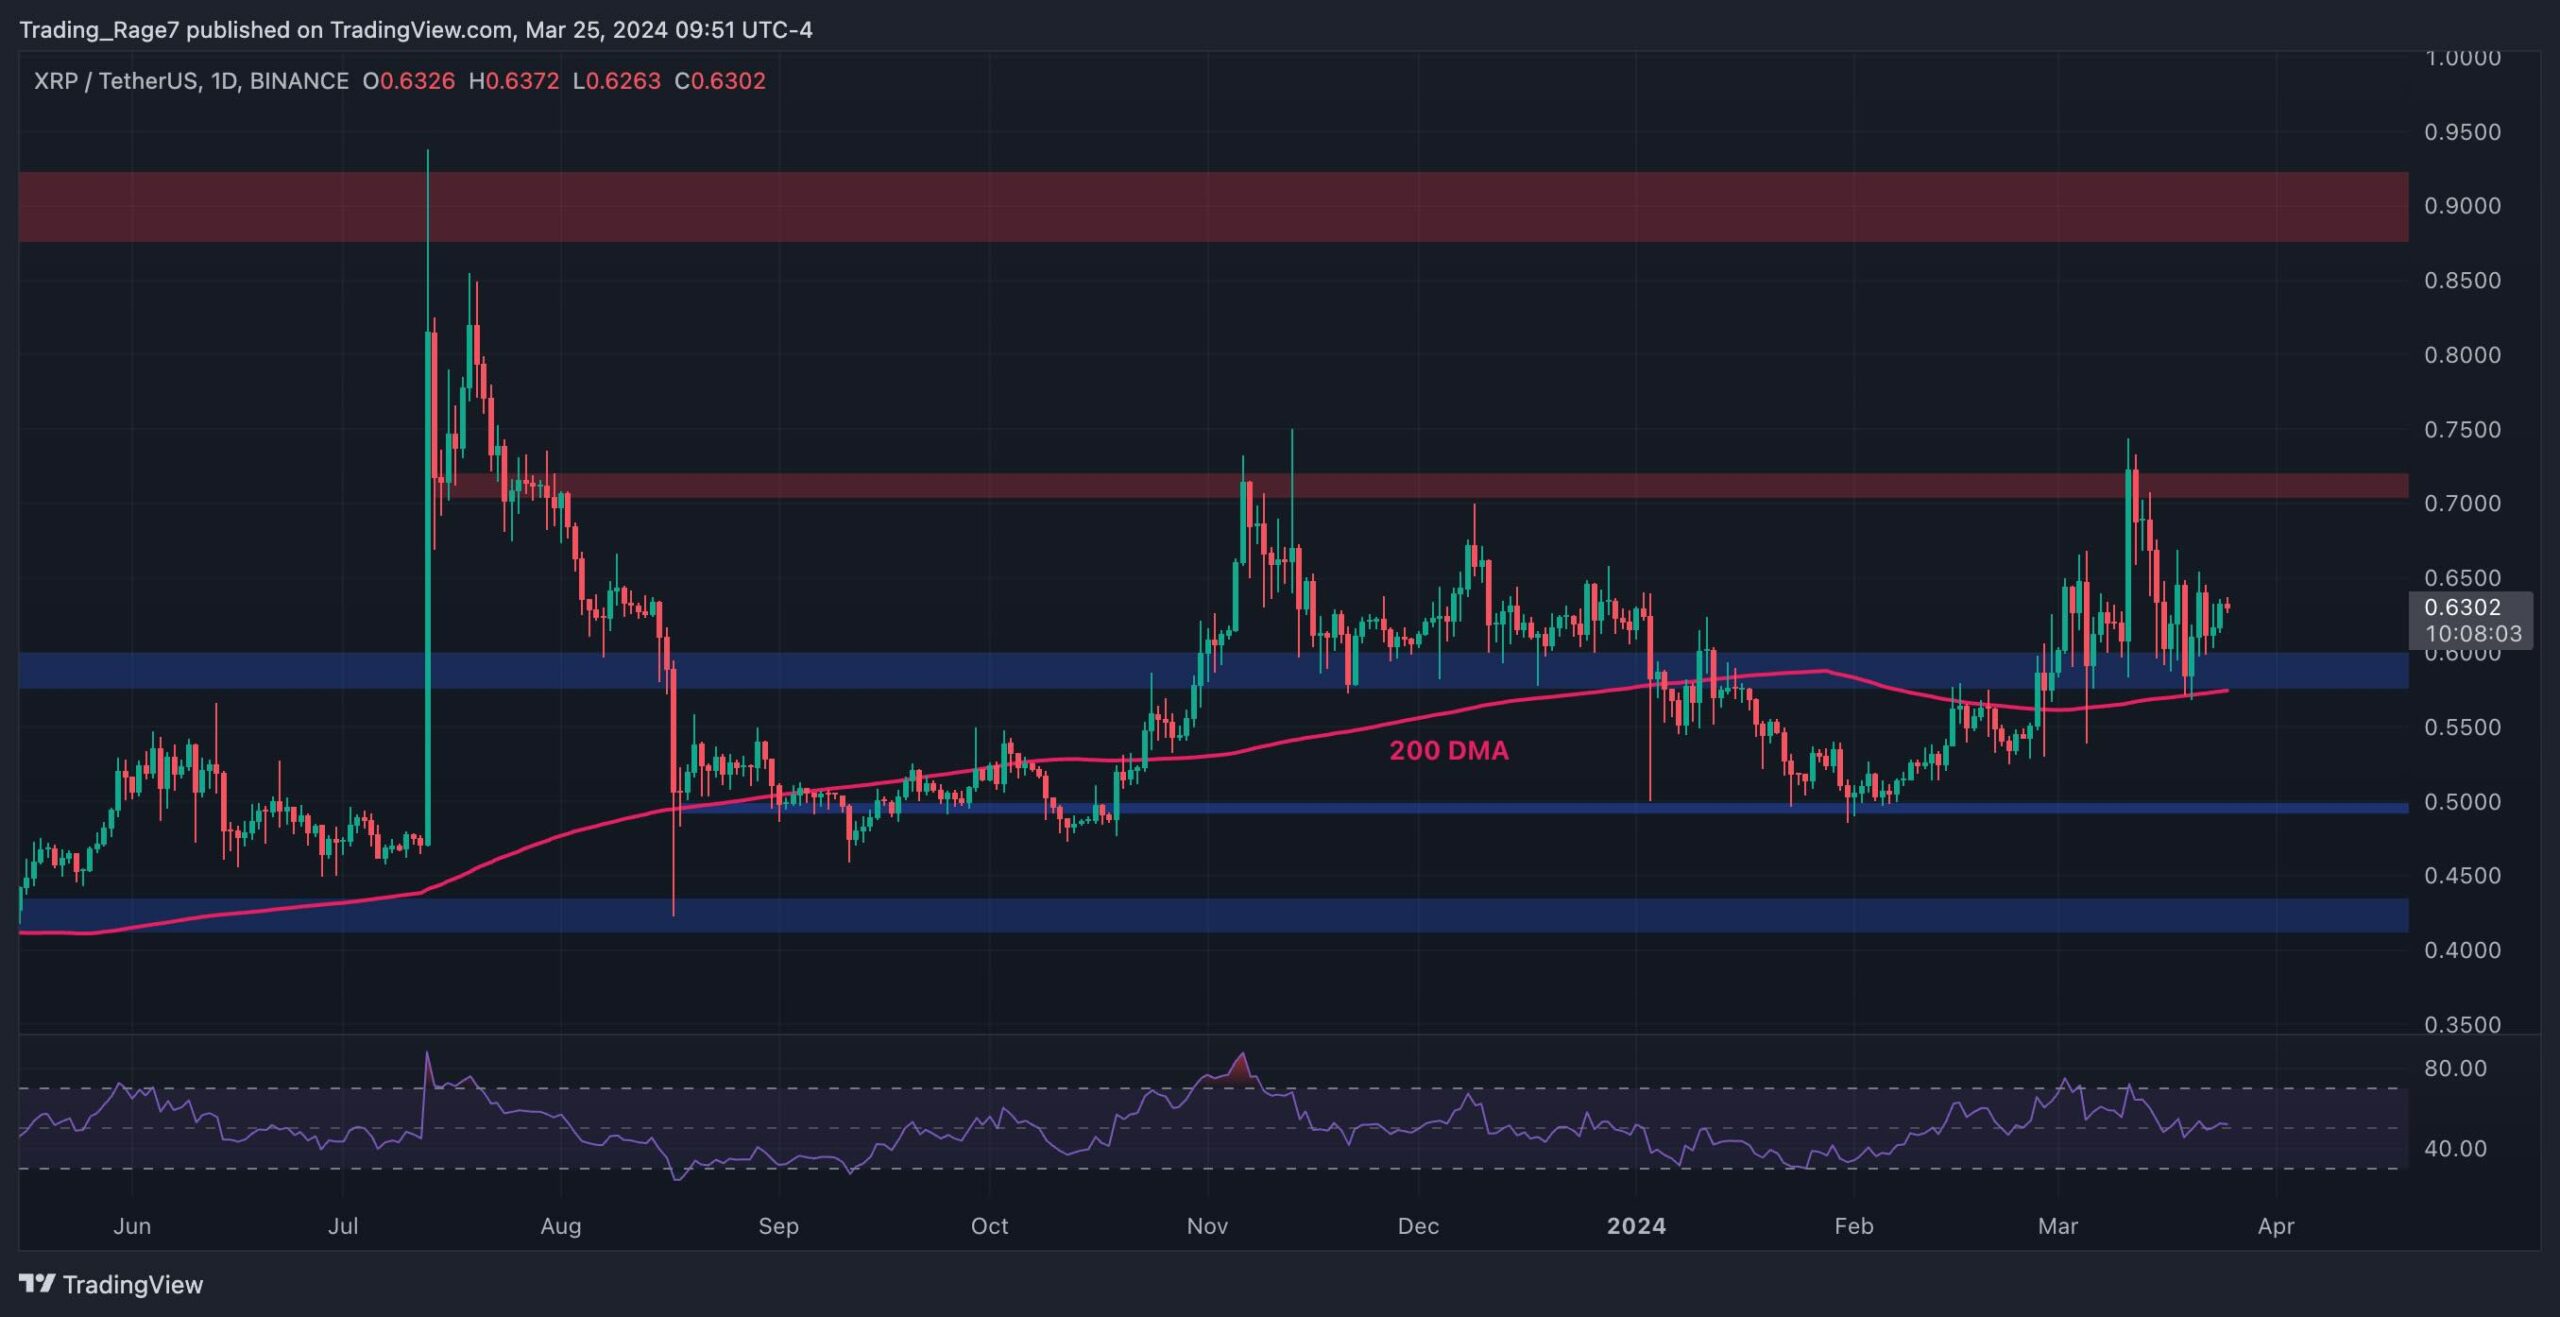
The USDT Paired Chart
Against USDT, the XRP price has been steadily declining since failing to break through the $0.7 resistance level. However, support has been found to be around $0.6, preventing further drops.
Should this mark fail, there’s potential for a turnaround near the 200-day moving average, situated around $0.57, offering another possible support level for XRP. On the other hand, a rebound from this level can lead to a potential rise toward $0.7.
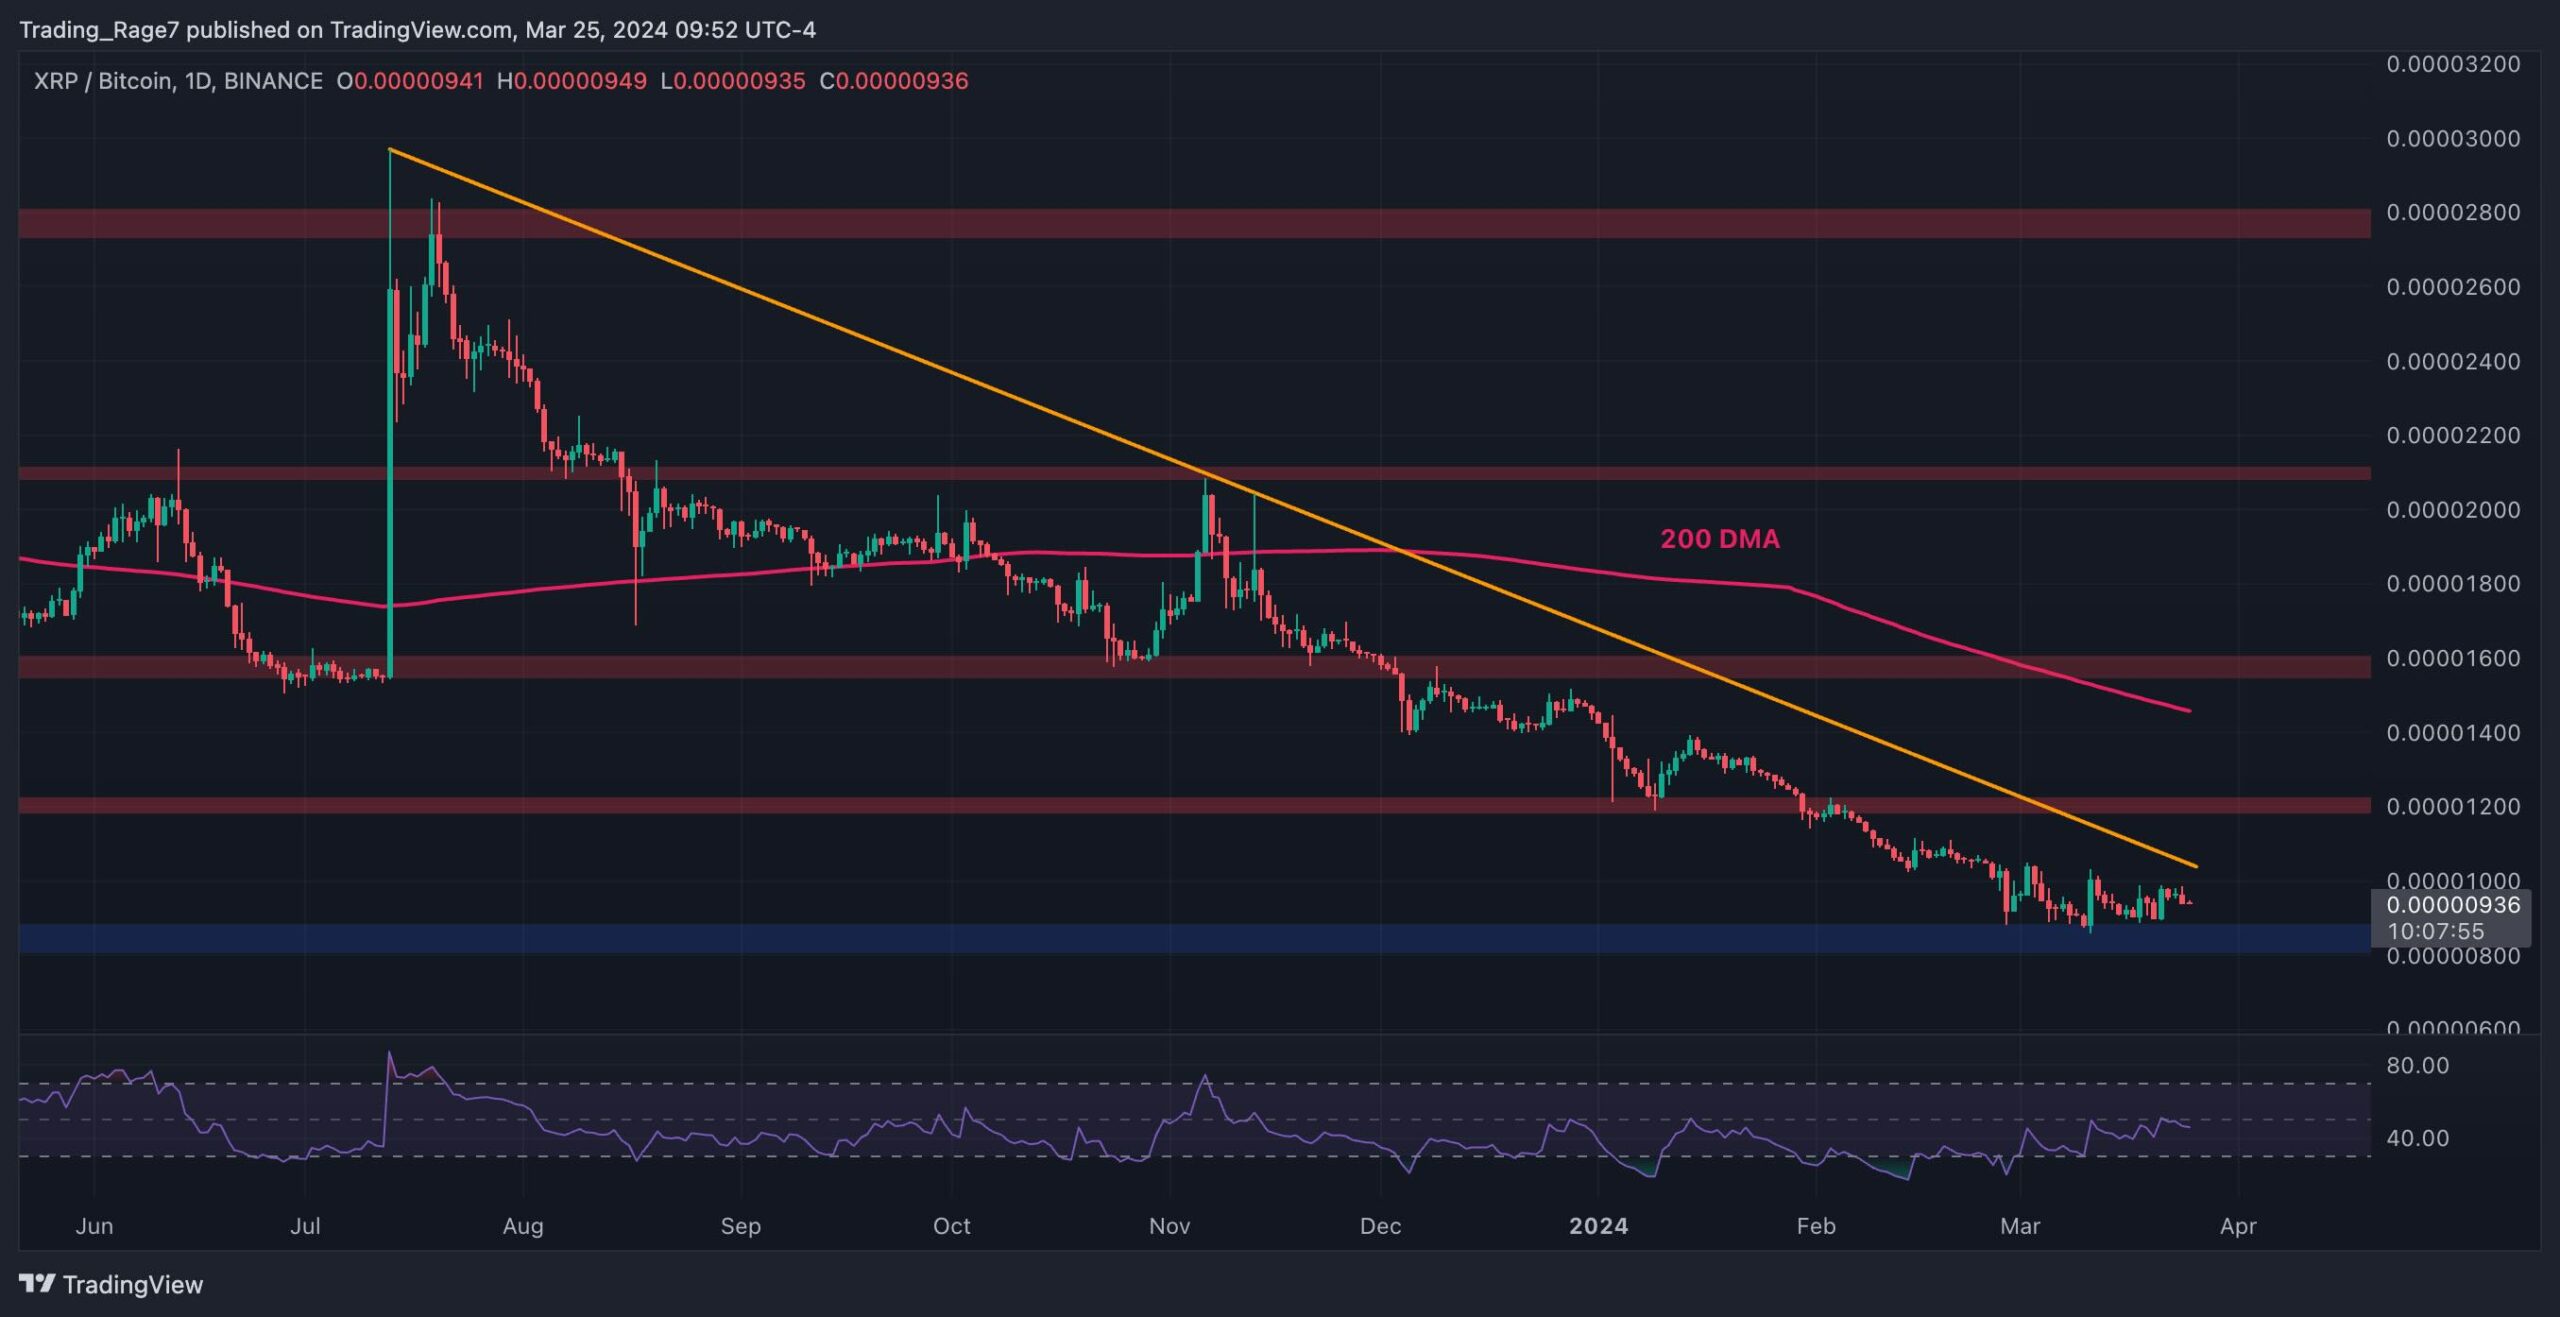
The BTC Paired Chart
Examining the Bitcoin pair, there’s been a prolonged downward trend in the market. Currently, the XRP price is revisiting the 900 SAT support area.
A successful bounce from this level could prompt an attempt to breach the long-standing bearish trendline. Should this occur, the next objective would likely be the 1200 SAT resistance level.
Conversely, a failure to hold above the 900 SAT support zone could have dire consequences, potentially triggering a substantial downturn in the market.