Ripple has been one of the underperforming cryptocurrencies during the recent bull market, as it failed to rise like Bitcoin and Ethereum over the last few months. Yet, things might be about to change soon. Ripple Price Analysis: Technicals By TradingRage The USDT Paired Chart Against USDT, the cryptocurrency has recently rebounded from the %excerpt%.43 and %excerpt%.50 support levels and is on its way to testing the %excerpt%.6 resistance zone. The 200-day moving average is also around the %excerpt%.6 level and can provide additional resistance. However, if the price successfully climbs back above this area, investors can be hopeful that a rally toward the %excerpt%.7 mark and potentially beyond is probable. Source: TradingViewThe BTC Paired Chart The Bitcoin pair’s weekly chart shows that the price has
Topics:
CryptoVizArt considers the following as important: Ripple (XRP) Price, XRP Analysis, xrpbtc, xrpusd
This could be interesting, too:
Jordan Lyanchev writes Ripple’s (XRP) Surge to Triggers Over Million in Short Liquidations
Jordan Lyanchev writes Trump Confirms Work on Strategic Crypto Reserve: XRP, ADA, SOL Included
Dimitar Dzhondzhorov writes Is a Major Ripple v. SEC Lawsuit Development Expected This Week? Here’s Why
Mandy Williams writes Ripple Releases Institutional DeFi Roadmap for XRP Ledger in 2025
Ripple has been one of the underperforming cryptocurrencies during the recent bull market, as it failed to rise like Bitcoin and Ethereum over the last few months. Yet, things might be about to change soon.
Ripple Price Analysis: Technicals
By TradingRage
The USDT Paired Chart
Against USDT, the cryptocurrency has recently rebounded from the $0.43 and $0.50 support levels and is on its way to testing the $0.6 resistance zone. The 200-day moving average is also around the $0.6 level and can provide additional resistance.
However, if the price successfully climbs back above this area, investors can be hopeful that a rally toward the $0.7 mark and potentially beyond is probable.
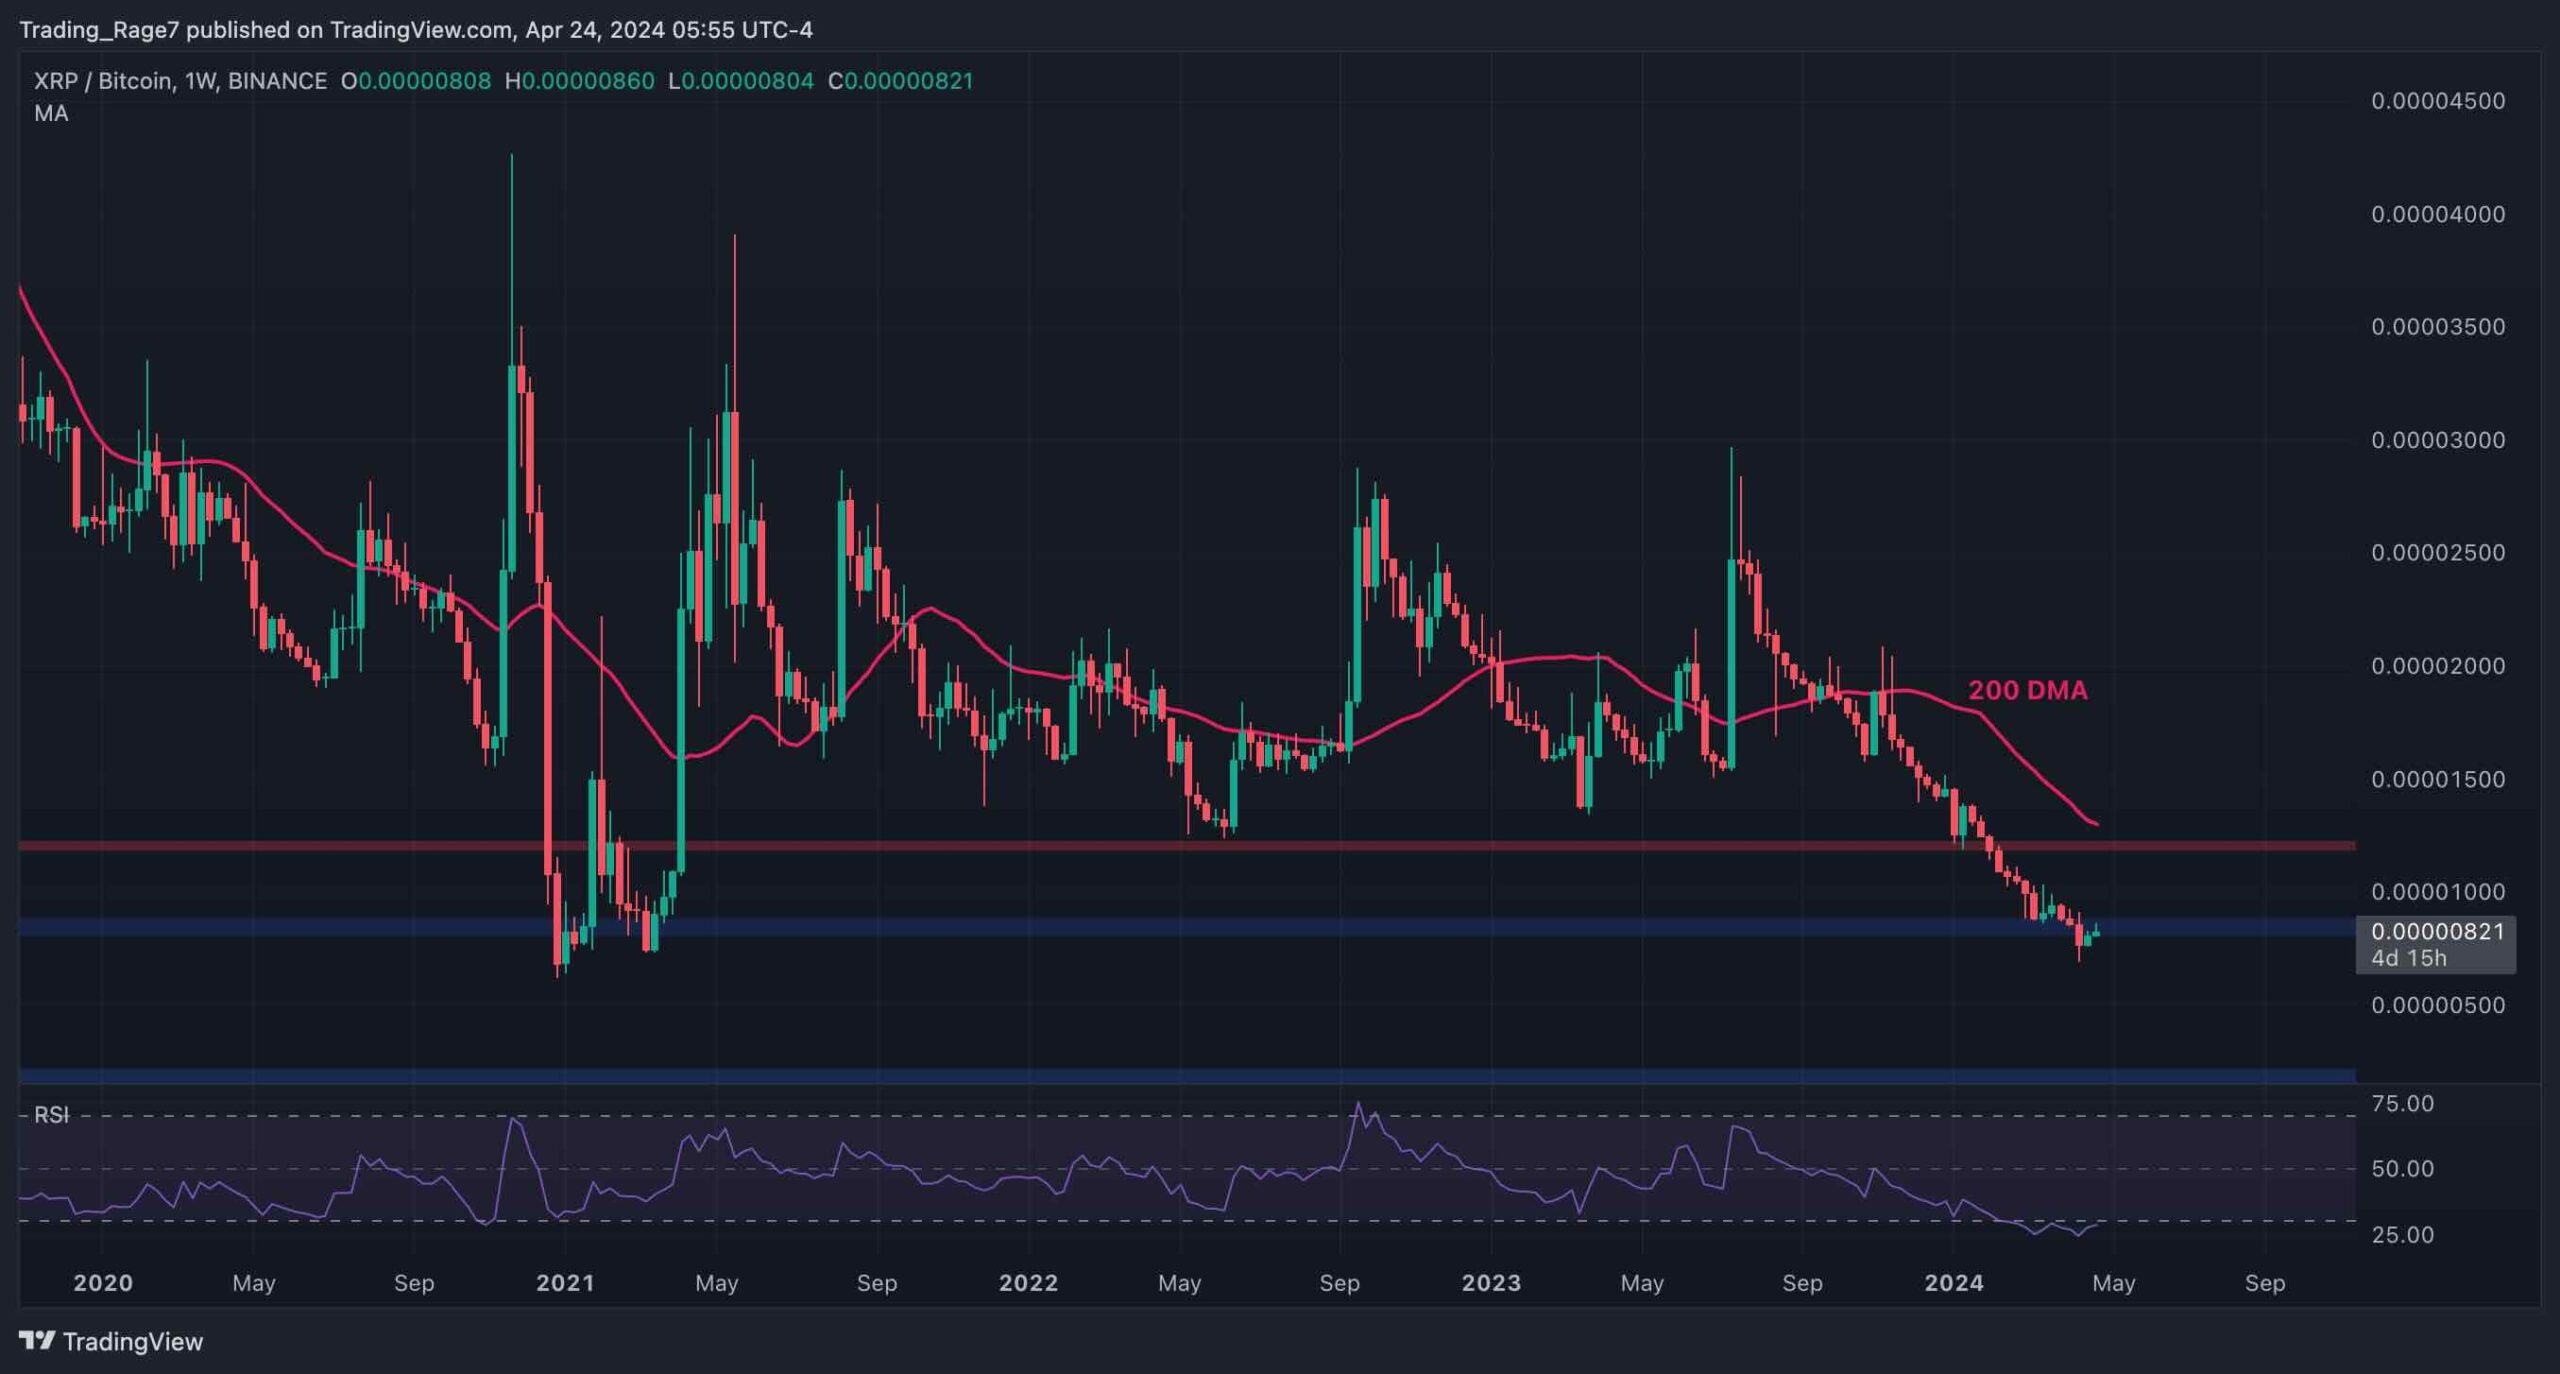
The BTC Paired Chart
The Bitcoin pair’s weekly chart shows that the price has been consistently trending down since dropping below the 200-day moving average. It is currently testing the 600 SAT support level. If the level breaks down, it would be catastrophic as XRP can experience a much deeper decline in the upcoming months.
On the other hand, the Relative Strength Index shows a clear oversold signal, and the market is more likely to finally rebound from the level.
In this case, a rise toward the 1200 SAT level and the 200-day moving average nearby would be highly probable in the short term.