Ripple’s price action against both USDT and BTC has been bearish for the last few months. Analyzing the charts might provide clues on the potential direction of the market in the short term. Technical Analysis By TradingRage Ripple Price Analysis: The USDT Paired Chart Against USDT, XRP has been on the decline since getting rejected from the resistance %excerpt%.7 level. The price has been trapped inside a descending channel, failing to break it to the upside on multiple occasions. The 200-day moving average, located near the %excerpt%.6 price mark, has also been broken, and the market seems more likely to drop toward the channel’s lower boundary and even the %excerpt%.43 support area in the upcoming weeks. Source: TradingViewThe BTC Paired Chart The BTC paired chart demonstrates a similar
Topics:
CryptoVizArt considers the following as important: Ripple (XRP) Price, XRP Analysis, xrpbtc, xrpusd
This could be interesting, too:
Jordan Lyanchev writes Ripple’s (XRP) Surge to Triggers Over Million in Short Liquidations
Jordan Lyanchev writes Trump Confirms Work on Strategic Crypto Reserve: XRP, ADA, SOL Included
Dimitar Dzhondzhorov writes Is a Major Ripple v. SEC Lawsuit Development Expected This Week? Here’s Why
Mandy Williams writes Ripple Releases Institutional DeFi Roadmap for XRP Ledger in 2025
Ripple’s price action against both USDT and BTC has been bearish for the last few months. Analyzing the charts might provide clues on the potential direction of the market in the short term.
Technical Analysis
By TradingRage
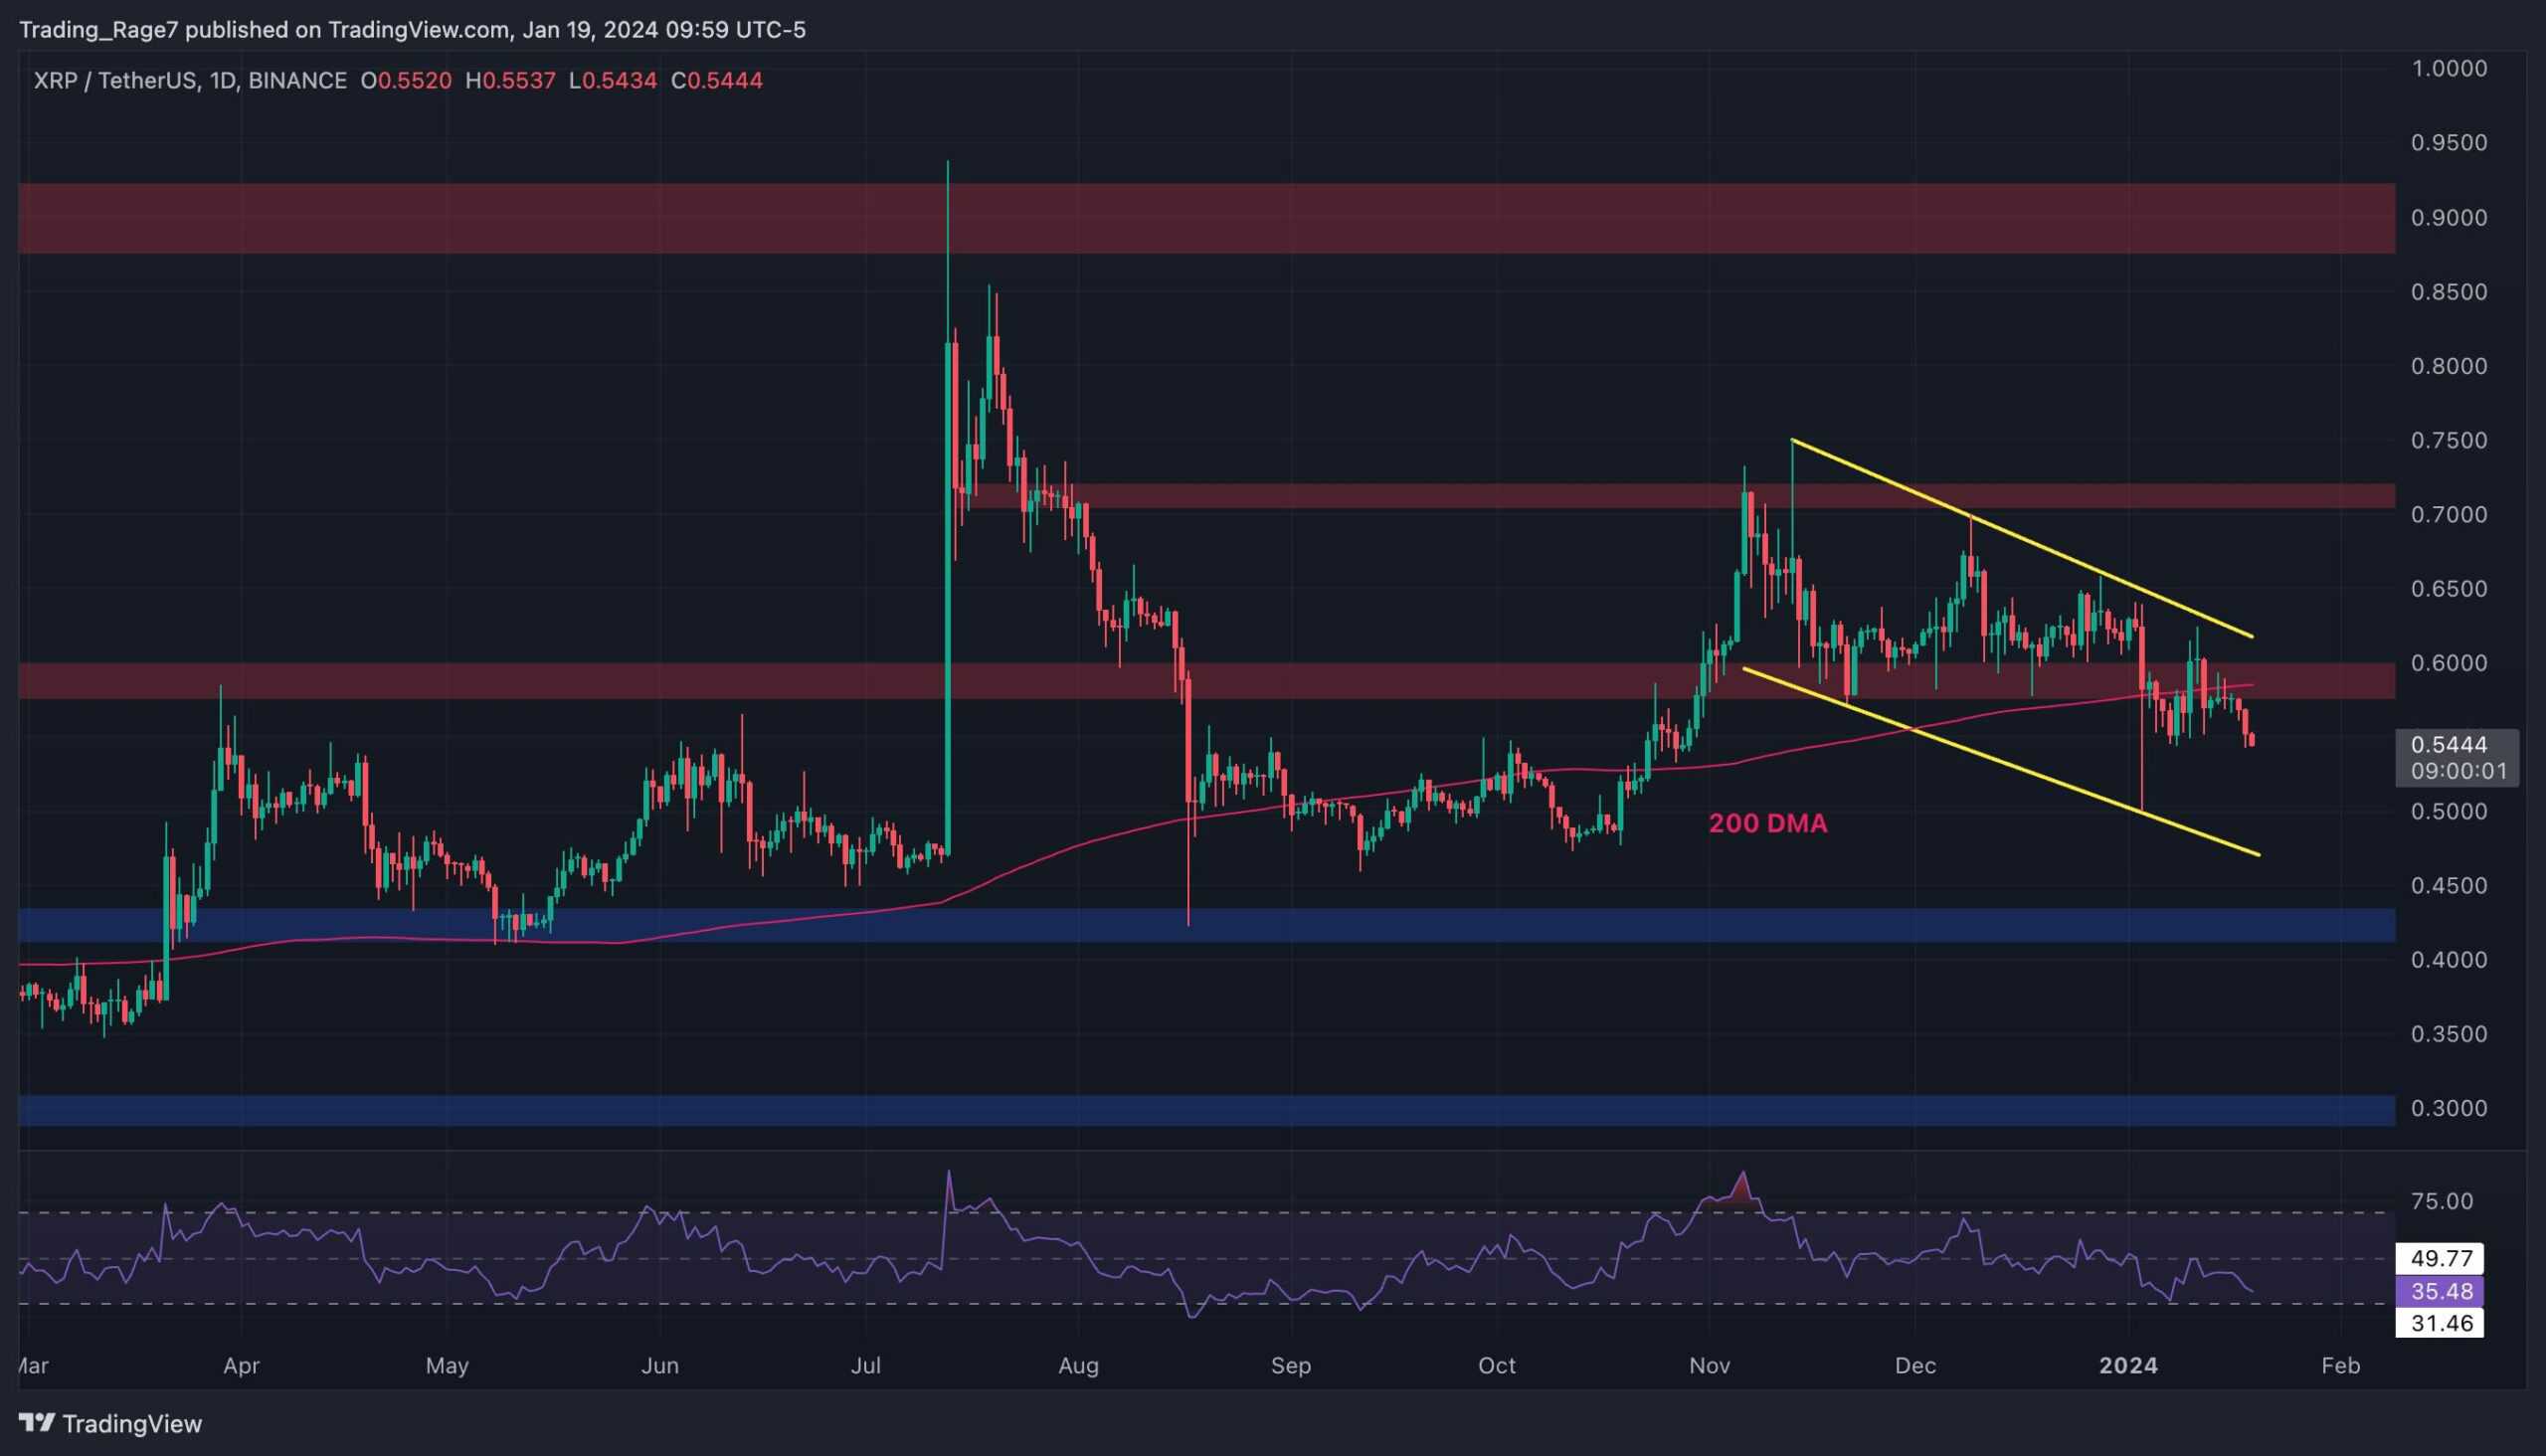
Ripple Price Analysis: The USDT Paired Chart
Against USDT, XRP has been on the decline since getting rejected from the resistance $0.7 level. The price has been trapped inside a descending channel, failing to break it to the upside on multiple occasions.
The 200-day moving average, located near the $0.6 price mark, has also been broken, and the market seems more likely to drop toward the channel’s lower boundary and even the $0.43 support area in the upcoming weeks.
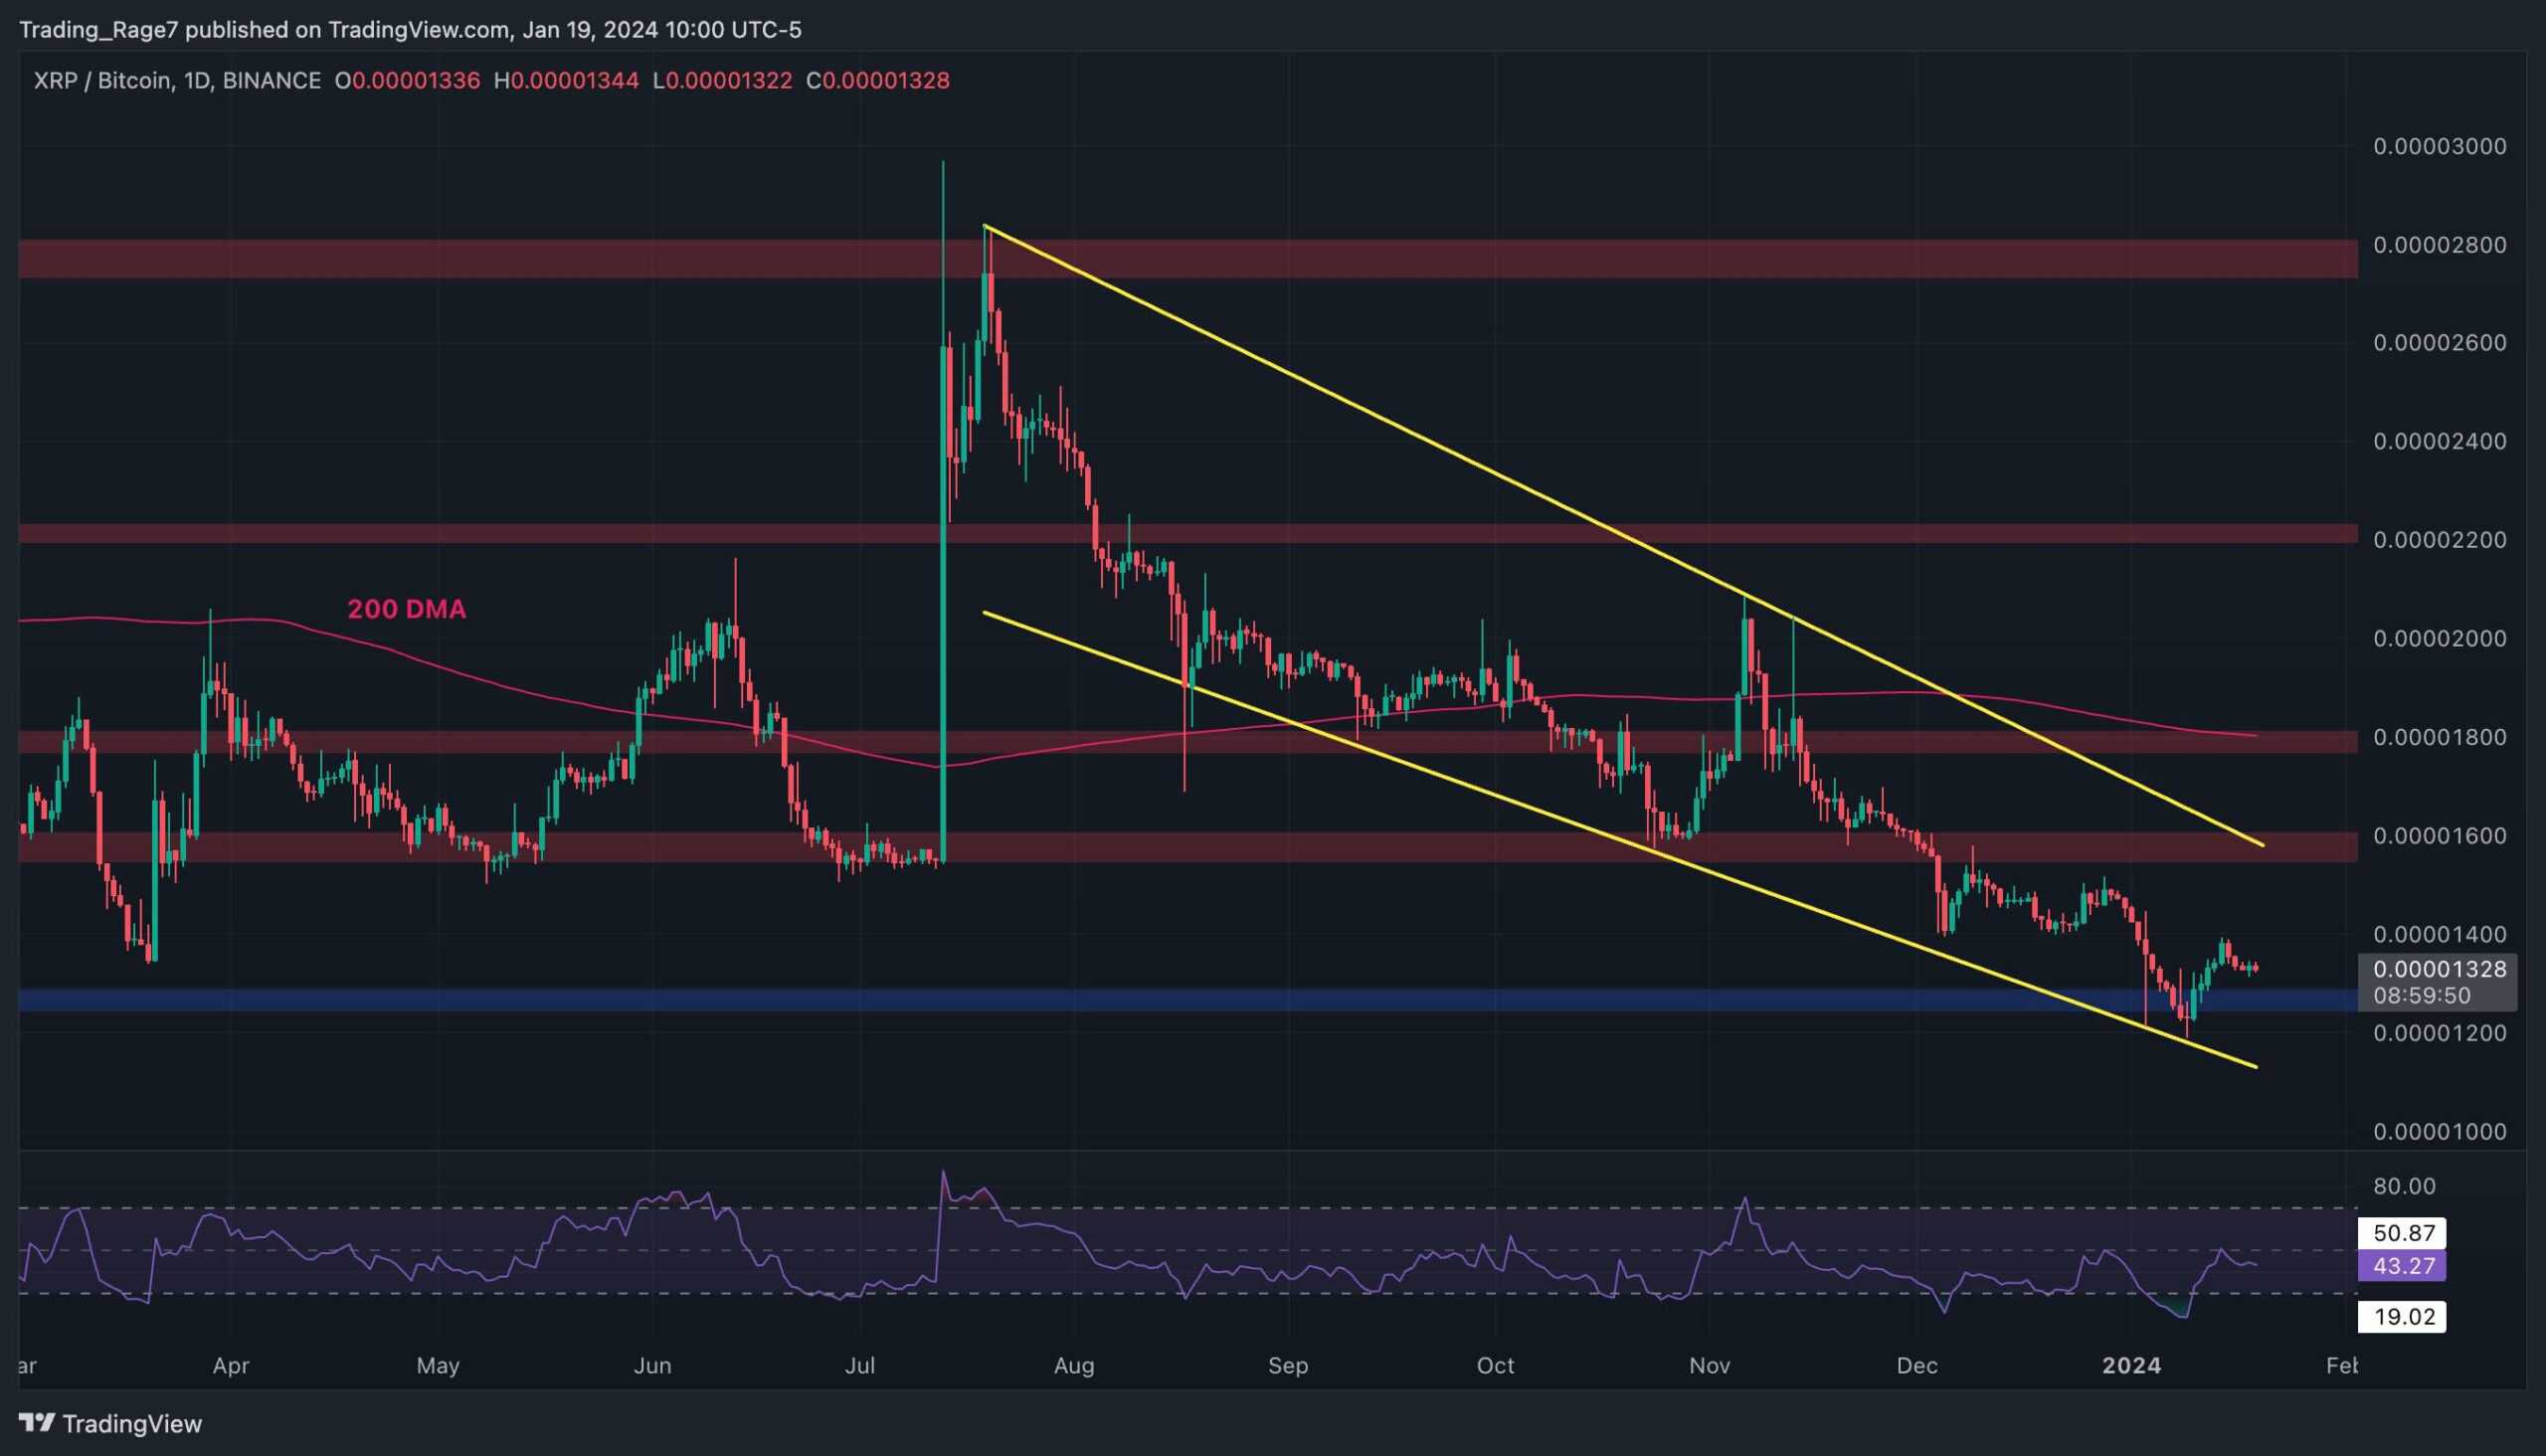
The BTC Paired Chart
The BTC paired chart demonstrates a similar situation for Ripple. XRP has been depreciating against Bitcoin for the last few months, declining inside a large falling wedge. Yet, the price has recently rebounded from the lower boundary of the pattern and the 1300 SAT support level.
While this is a positive sign, no bullish predictions can be made with high accuracy until the wedge is broken to the upside. The 200-day moving average is also a key indicator, and until XRP trades below it, the market trend is considered bearish.