Bitcoin’s price has been dropping rapidly over the past few days, making investors worried that the bull market is over. However, there is still hope left, as the market is getting supported in a key area. Technical Analysis By Edris Derakhshi (TradingRage) The Daily Chart On the daily chart, the asset has been on a steep decline since last week and is yet to recover. Yet, the 200-day moving average, located near the K support level, is currently supporting the cryptocurrency, preventing a further downward move. As things stand, a rebound to the K level seems likely. On the other hand, if these levels are broken to the downside, things could get even worse, and a drop to the K area would be highly probable. The 4-Hour Chart The 4-hour chart shows a more positive
Topics:
CryptoVizArt considers the following as important: Bitcoin (BTC) Price, BTC Analysis, BTCEUR, BTCGBP, btcusd, btcusdt
This could be interesting, too:
Chayanika Deka writes XRP, SOL, and ADA Inclusion in US Crypto Reserve Pushes Traders on Edge
Chayanika Deka writes Why Arthur Hayes Is Bullish on Bitcoin Under Trump’s Economic Strategy
Mandy Williams writes Why the Bitcoin Market Is Stuck—and the Key Metric That Could Change It: CryptoQuant CEO
Wayne Jones writes Metaplanet Acquires 156 BTC, Bringing Total Holdings to 2,391
Bitcoin’s price has been dropping rapidly over the past few days, making investors worried that the bull market is over.
However, there is still hope left, as the market is getting supported in a key area.
Technical Analysis
By Edris Derakhshi (TradingRage)
The Daily Chart
On the daily chart, the asset has been on a steep decline since last week and is yet to recover. Yet, the 200-day moving average, located near the $80K support level, is currently supporting the cryptocurrency, preventing a further downward move.
As things stand, a rebound to the $90K level seems likely. On the other hand, if these levels are broken to the downside, things could get even worse, and a drop to the $74K area would be highly probable.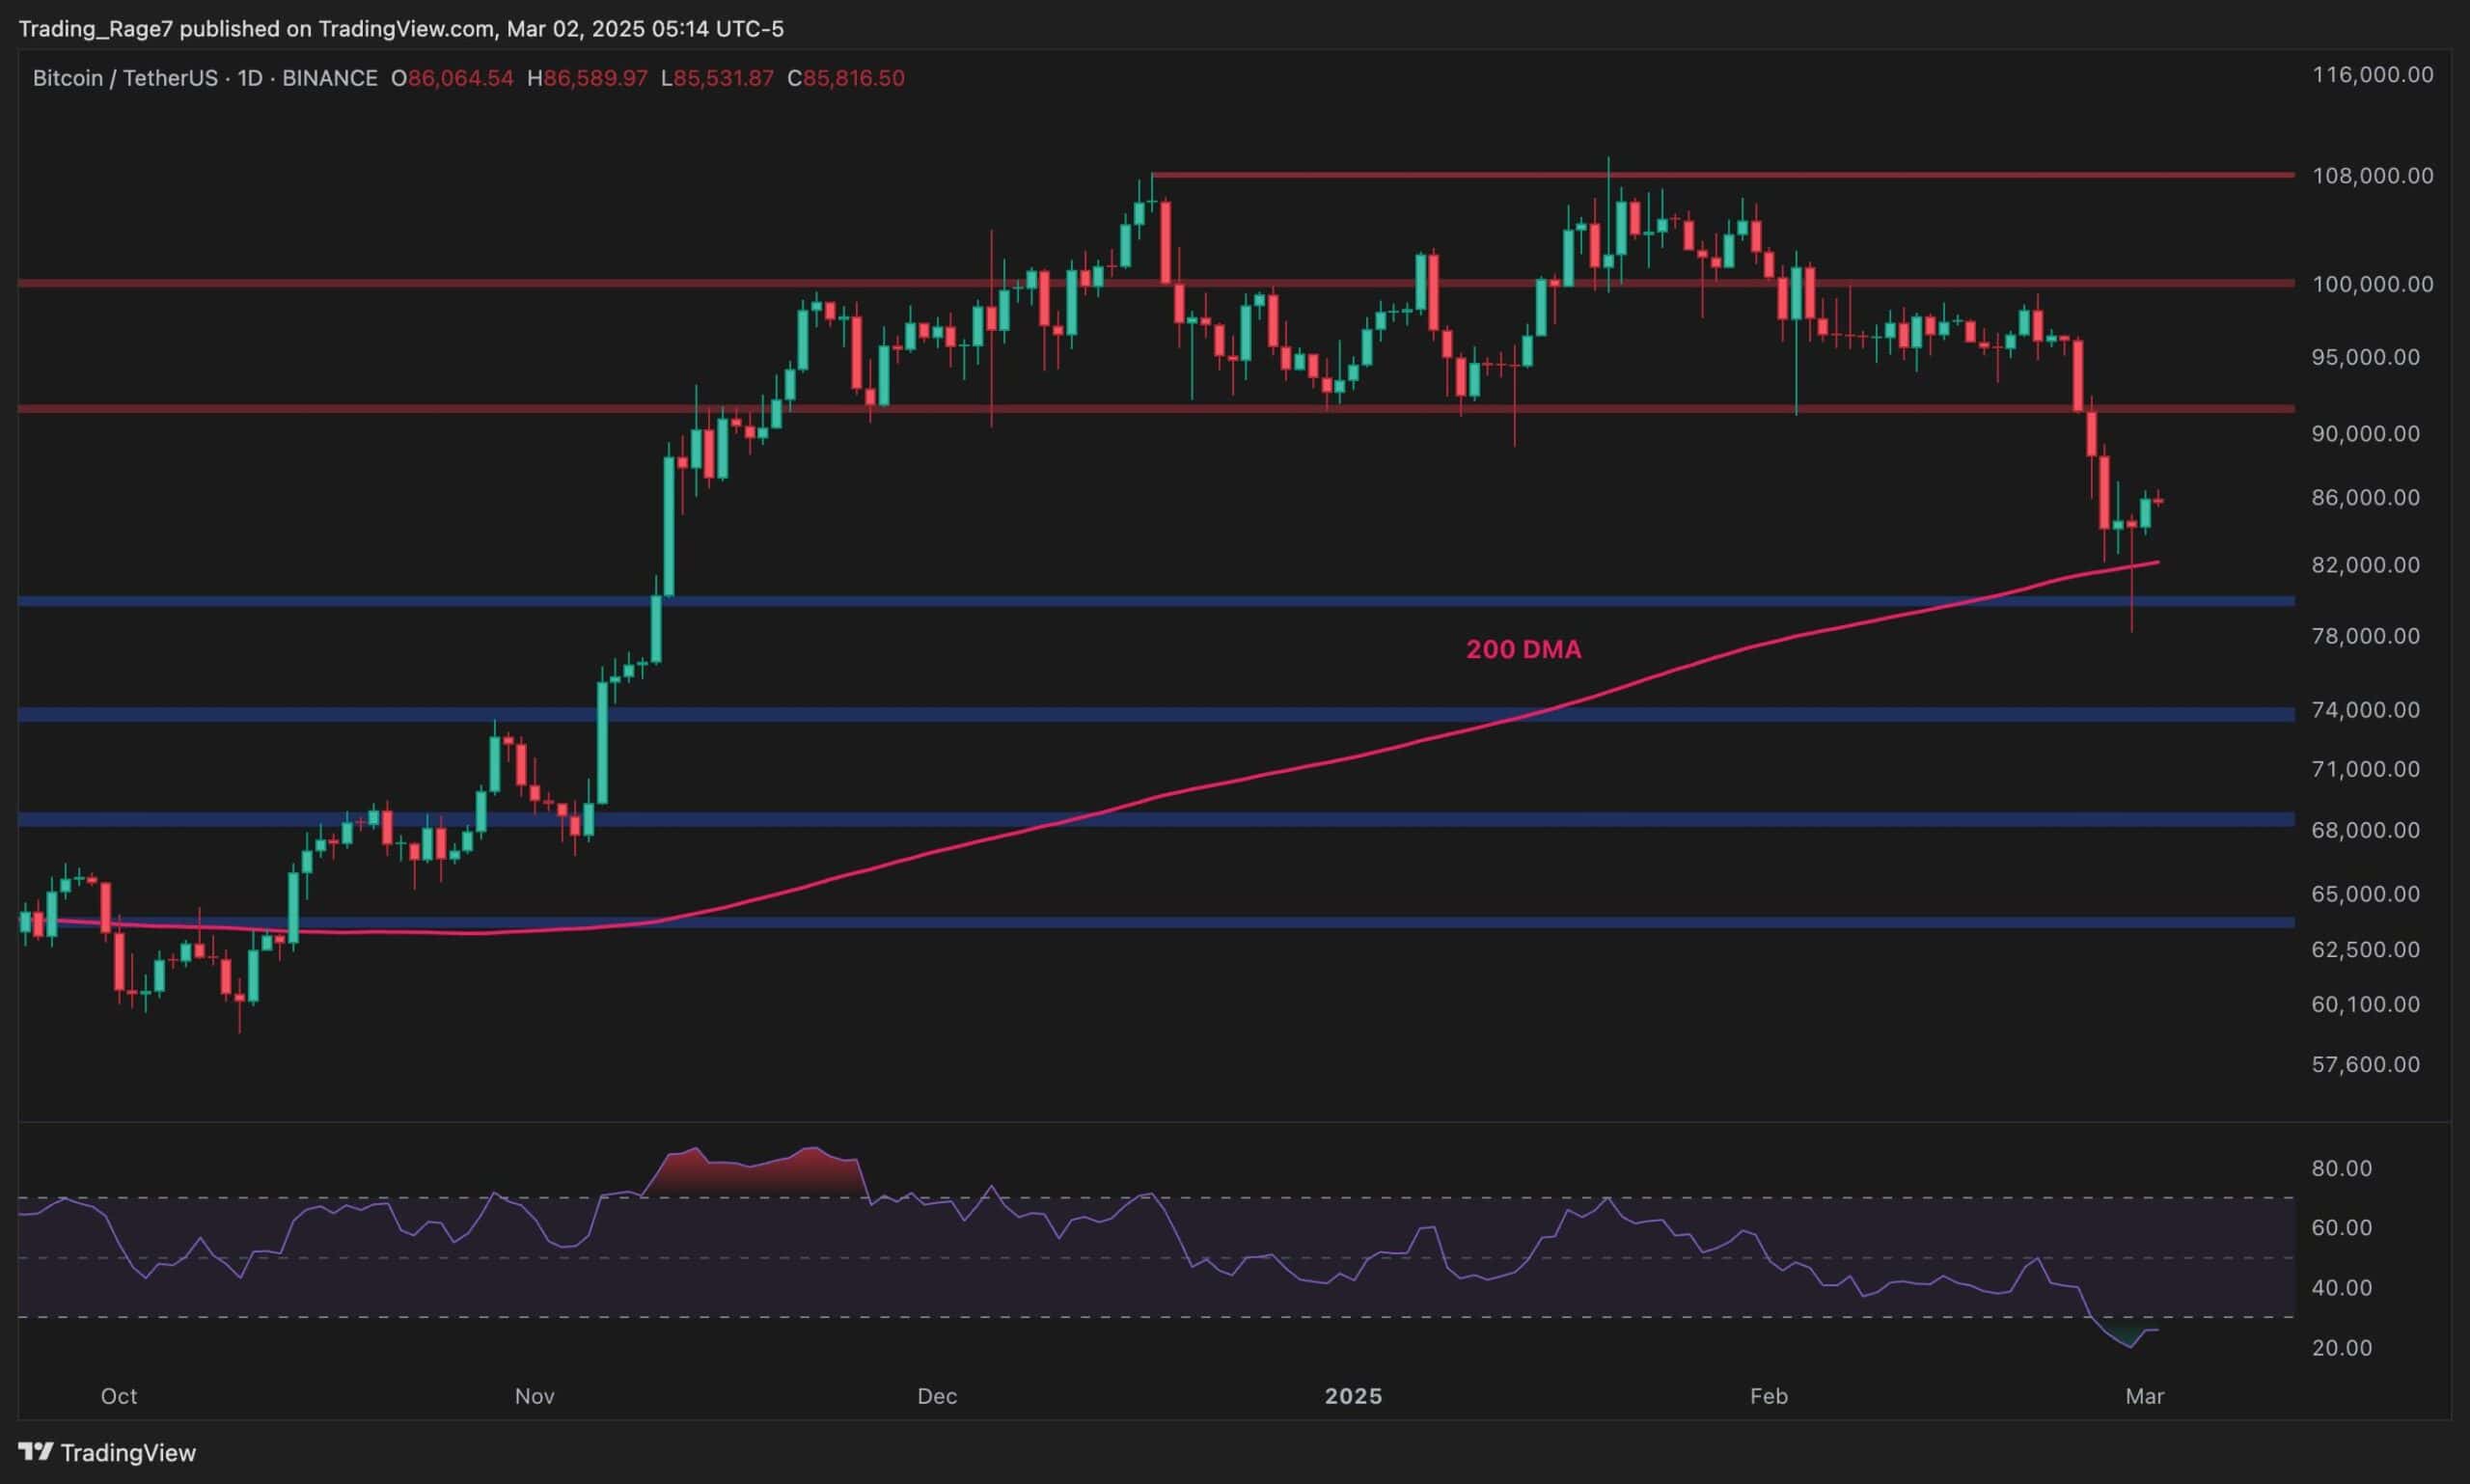
The 4-Hour Chart
The 4-hour chart shows a more positive picture of the recent price action, as the market has bounced decisively from the $80K level. The RSI’s bullish divergence also showed the probability of such a move beforehand.
Yet, as long as the price has not risen back above the $87K high, the trend cannot be considered bullish again, as the market needs to make higher highs and lows once again.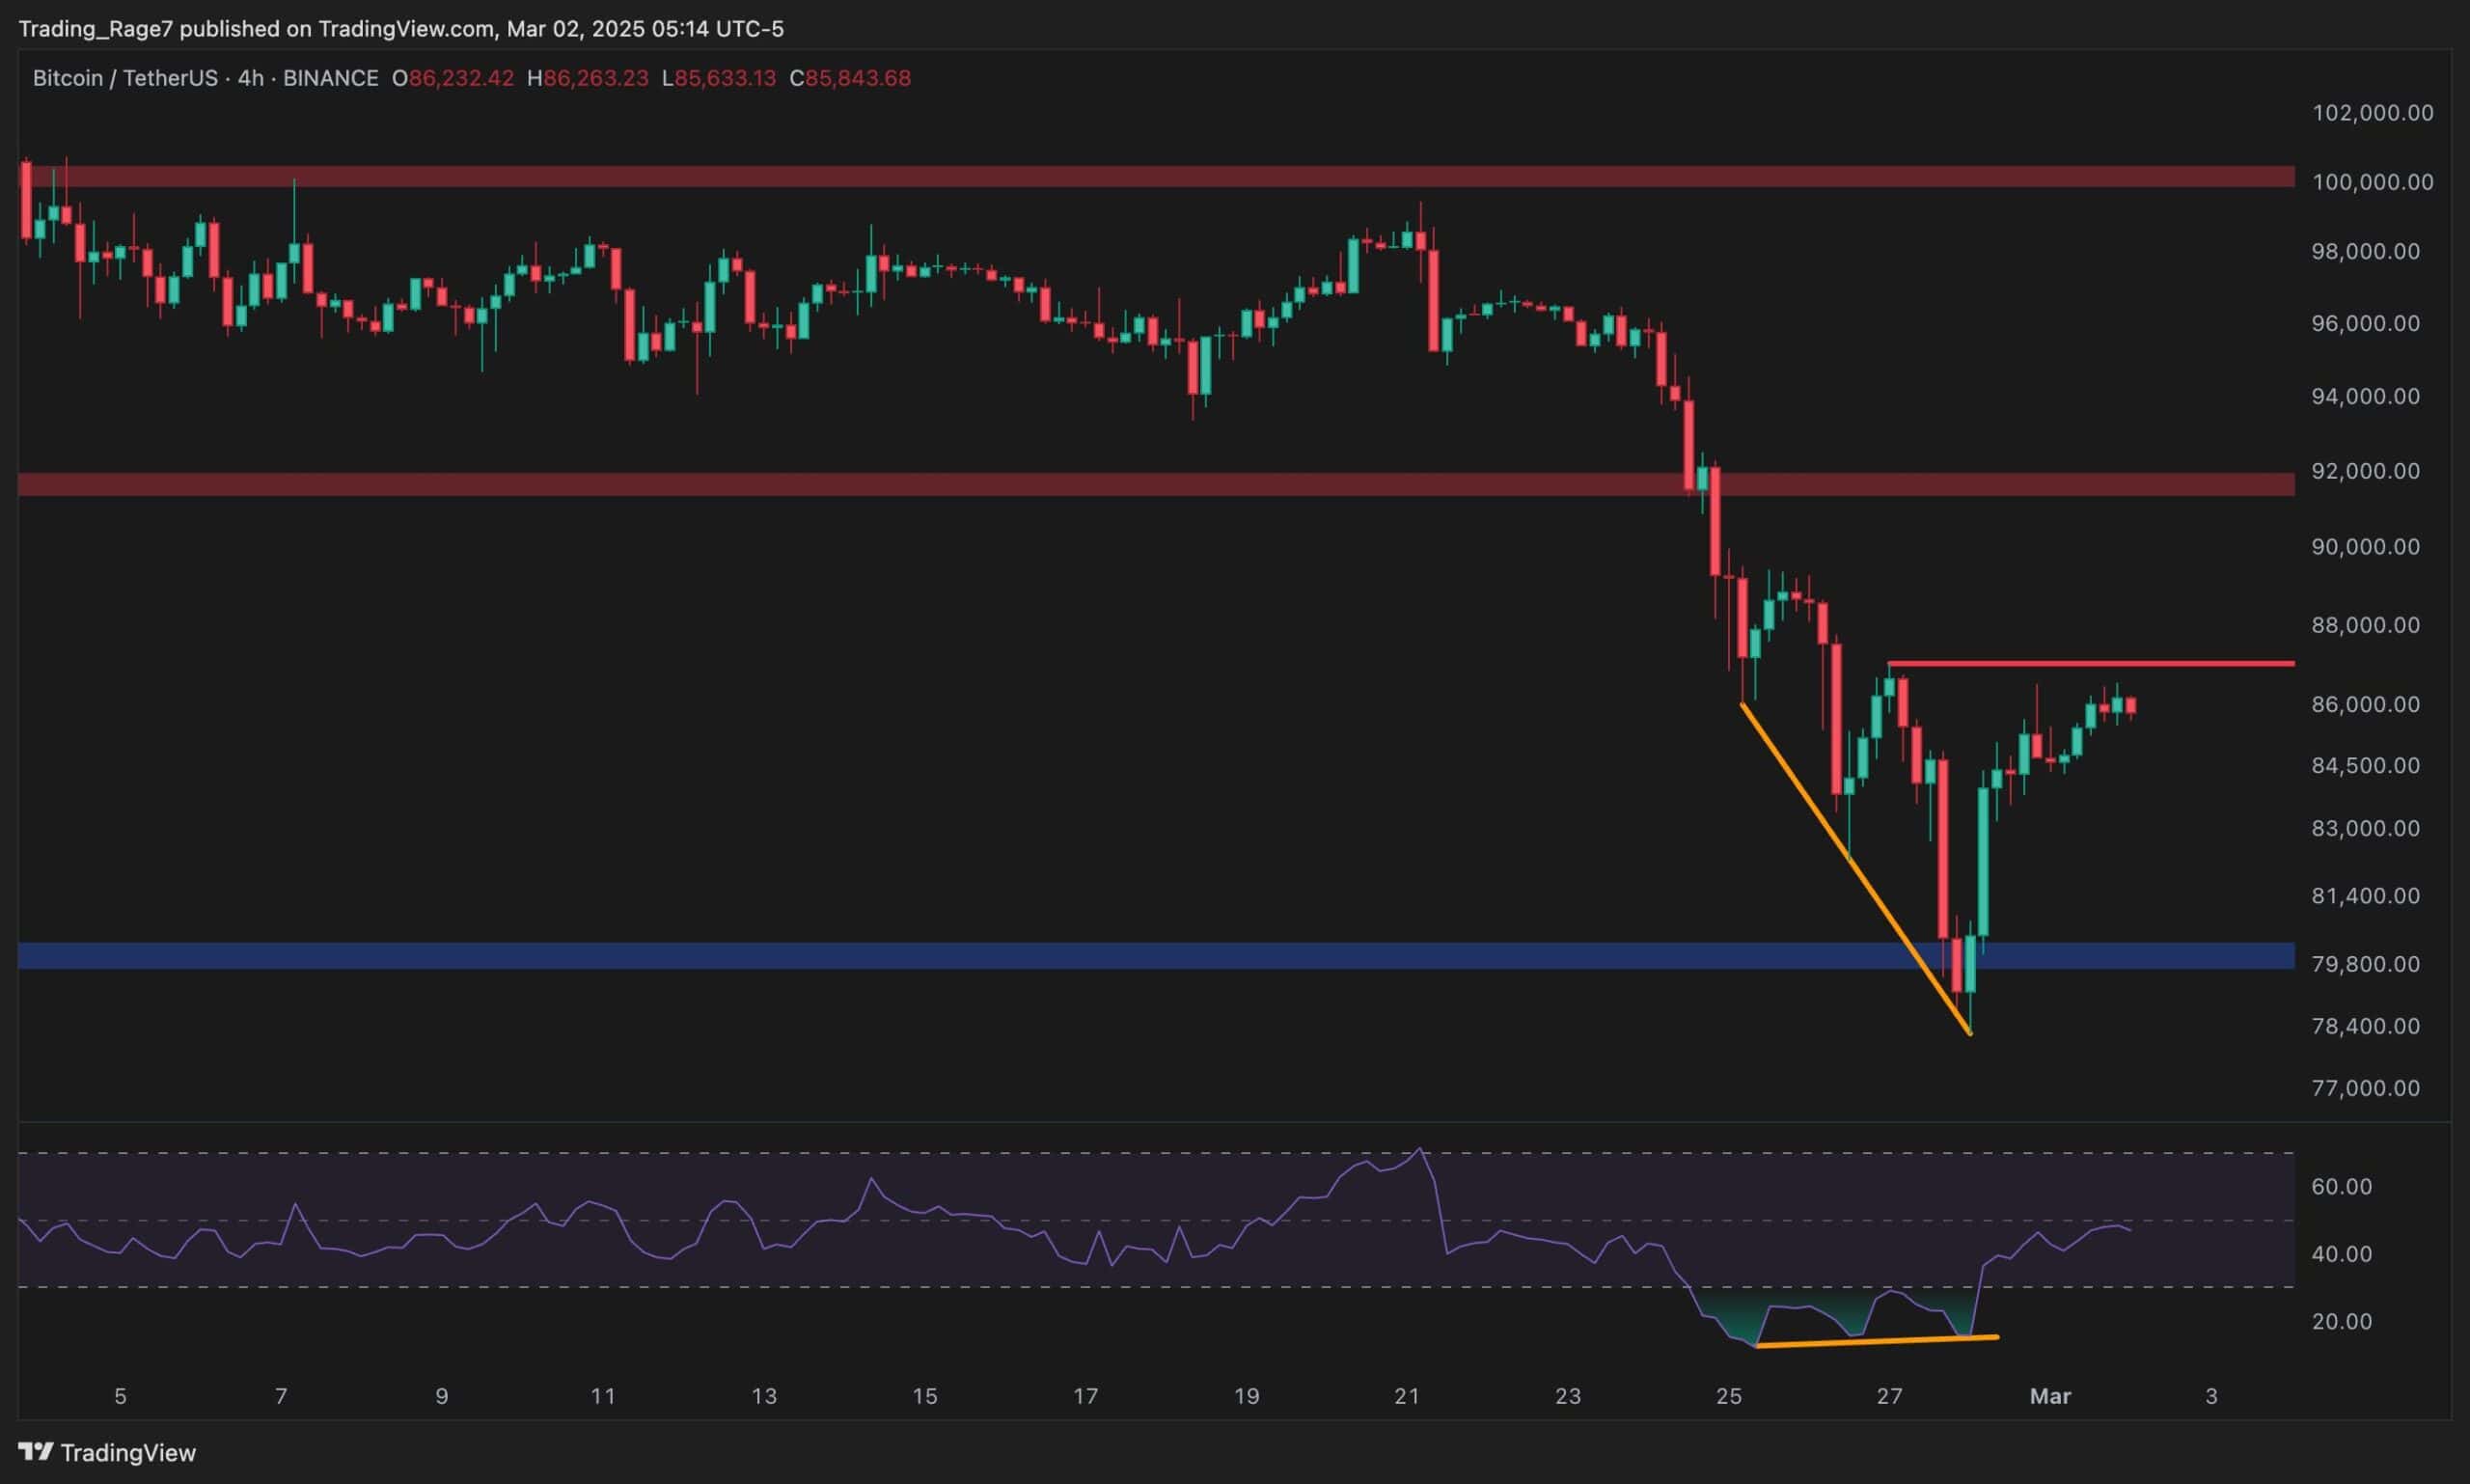
Sentiment Analysis
By Edris Derakhshi (TradingRage)
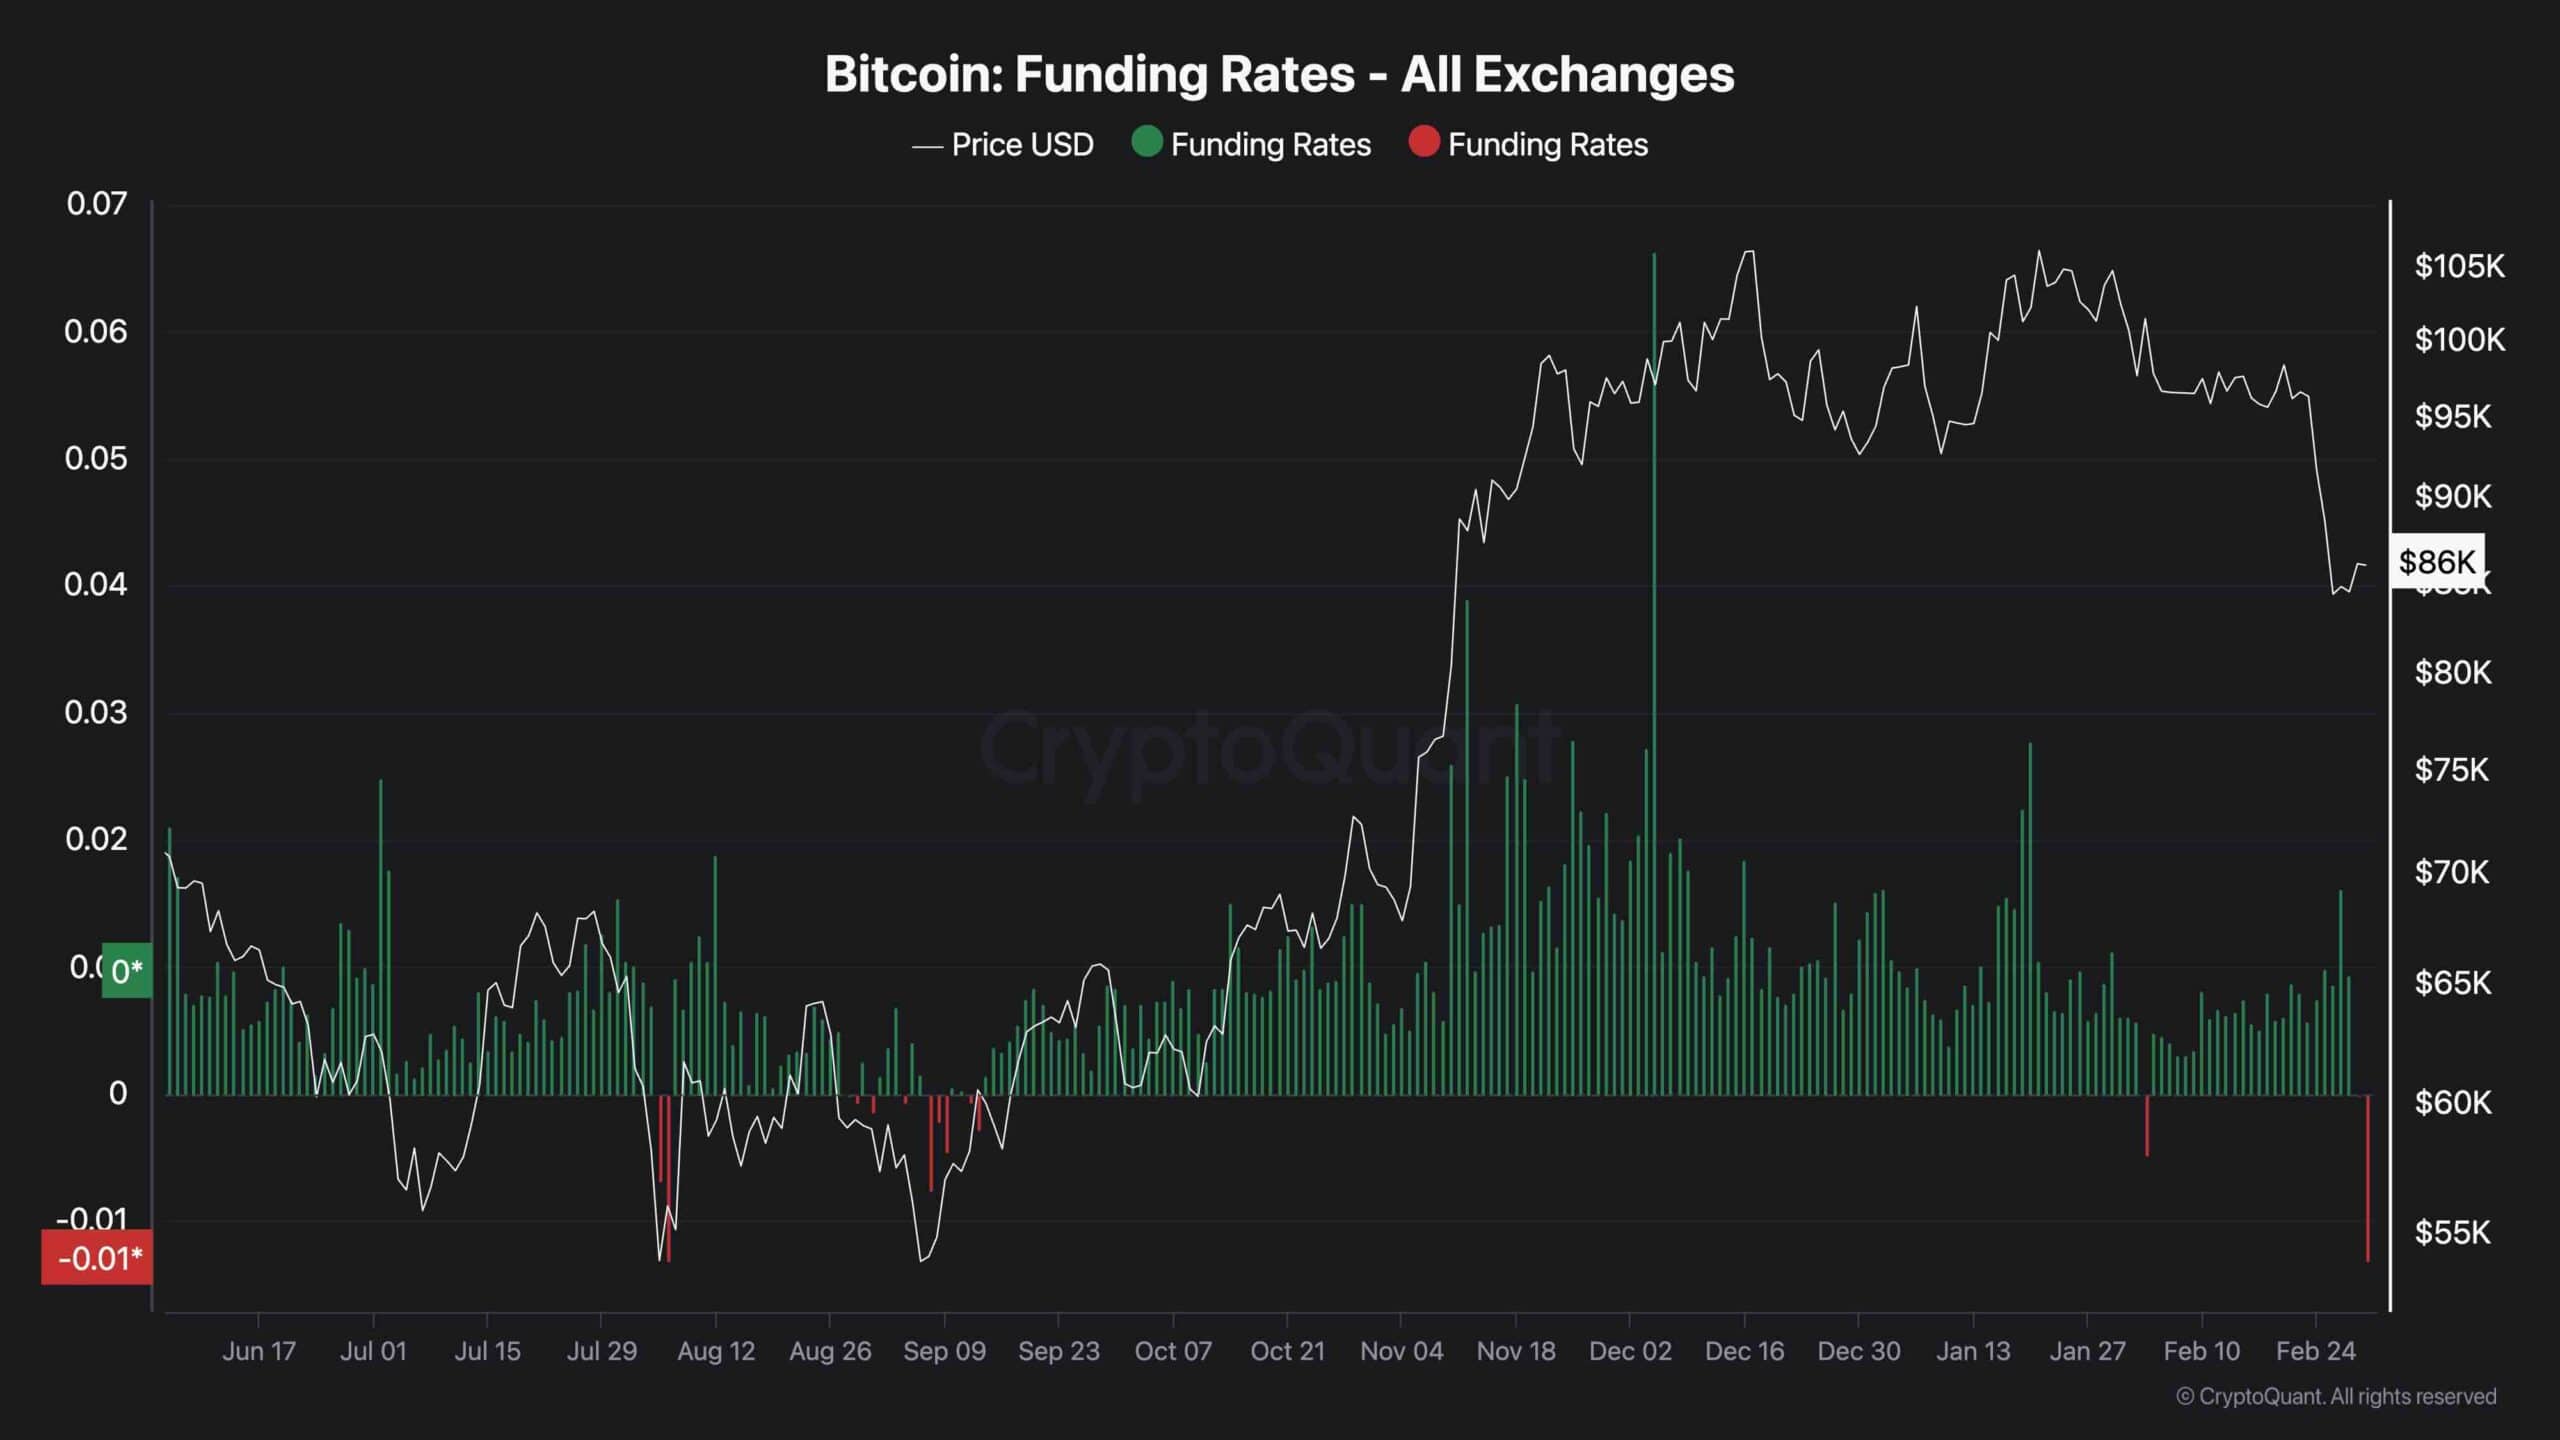
Funding Rates
Analyzing the futures market sentiment has always provided helpful insights over the past few years, and one of the most helpful metrics is the funding rates. This metric demonstrates whether the buyers or the sellers are in control of the futures market.
As the chart depicts, the funding rates metric has just printed the most negative reading over the past few days, indicating that the sellers are aggressively executing leveraged shorts.
While this might seem worrying, it could also be the beginning of the end for this downtrend, as a small bullish pullback could lead to a short-liquidation cascade that pushes the price back higher again. As a result, the next few days are very important for BTC’s mid- to long-term future.