CryptoVizArt
September 1, 2023
Bitcoin (BTC), Crypto news, Ripple (XRP), Tether (USDT)
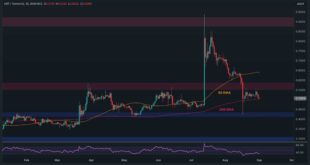
Ripple’s price shows bearish signs; if the current key support level breaks – the drop could escalate even faster.
Technical Analysis
By Edris
The USDT Paired Chart
On the USDT paired chart, the price has held above the 200-day moving average, around the $0.5 mark, over the past few weeks. However, the price is currently testing the 200-day moving average. If this moving average breaks down, the price will drop quickly towards the $0.43 level.
On the other hand, if the price...
Read More »
Aayush Jindal
August 31, 2023
Altcoins, Bitcoin (BTC), Crypto news, Ethereum (ETH), Litecoin (LTC), Markets, Ripple (XRP)
Litecoin is slowly moving higher from the $60 support against the US Dollar.
LTC price is now trading above $65 and the 55 simple moving average (4 hours).
There is a key bearish trend line forming with resistance near $68.00 on the 4-hour chart of the LTC/USD pair (data feed from Coinbase).
The pair could gain bullish momentum if it clears the $68 and $70 resistance levels.
Litecoin price is recovering from the $60 zone against the US Dollar, similar to Bitcoin....
Read More »
Mandy Williams
August 30, 2023
Bitcoin (BTC), Crypto news, Ethereum (ETH), Ripple (XRP), Tether (USDT)
Leading cryptocurrency exchange OKX has released its tenth proof-of-reserves (PoR) report, becoming the first digital asset platform to release ten consecutive monthly PoR reports.
According to a press release, the latest numbers show balances of $10.4 billion in primary crypto assets like bitcoin (BTC), ether (ETH), and Tether (USDT).
OKX Publishes 10th PoR Report
The Seychelles-based exchange covered 22 digital assets, including USD Coin (USDC), Ripple (XRP), Dogecoin...
Read More »
Jordan Lyanchev
August 29, 2023
Crypto news, Ripple (XRP)
In the ongoing debate on Ripple (XRP) and its intrinsic value, attorney Deaton’s response to Australian-based lawyer Bill Morgan’s criticism of the U.S. Securities and Exchange Commission’s (SEC) stance has sparked further discussion.
The central point of contention lies in whether XRP possesses intrinsic value, a question that holds significant implications for the regulatory classification of the cryptocurrency.
Maybe the SEC should read Howey again:
“The test is whether...
Read More »
Andrew Throuvalas
August 28, 2023
Crypto news, Ethereum (ETH), Ripple (XRP)
A little-discussed memo from the Securities and Exchange Commission (SEC) from five years ago may suggest that the agency faced internal struggles in concluding whether XRP was a security, according to crypto lawyer John Deaton.
This may indicate that Ripple – the company behind XRP – was not legally reckless in issuing the token years prior, as the SEC has often alleged.
The SEC’s Memo
According to Deaton, the “Howey memo” was written by SEC enforcement lawyers, and received...
Read More »
Wayne Jones
August 28, 2023
Crypto news, Ripple (XRP)
On-chain data tracker Whale Charts just flagged a massive XRP transaction, which could spell doom for the popular crypto asset.
As per Whale Charts’ tweet, an anonymous investor moved about 28.4 million Ripple (XRP), equivalent to roughly $14.9 million, into Bitstamp. The amount was transferred from wallet r4wf7enWPx to another Bitstamp wallet, rDsbeomae4.
Of course, substantial transfers are not new to XRP. Nonetheless, the shift towards an exchange wallet signaled a...
Read More »
Nick Marinoff
August 28, 2023
Altcoins, Crypto news, Ripple (XRP)
Ripple is feeling very confident following its recent SEC victory. So confident, in fact, that in a recent interview, representatives said they think many banks will want to use XRP (the official cryptocurrency of Ripple) to aid in cross-border payments.
Ripple Wants XRP to Be a Primary Cross-Border Tool
The company stated it’s already engaged in several talks with banks and other traditional financial institutions throughout the U.S. about the use of XRP in...
Read More »
Aayush Jindal
August 28, 2023
Altcoins, Bitcoin (BTC), Crypto news, Markets, Ripple (XRP)
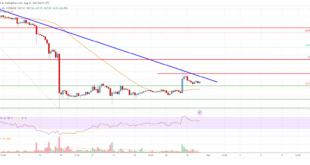
Ripple price is facing resistance near the $0.535 level against the US dollar.
The price is now trading below $0.525 and the 55 simple moving average (4 hours).
There is a major bearish trend line forming with resistance near $0.540 on the 4-hour chart of the XRP/USD pair (data source from Kraken).
The pair could start another decline if it stays below $0.540 and $0.564.
Ripple price is struggling below $0.540 against the US Dollar, like Bitcoin. XRP price must...
Read More »
Chayanika Deka
August 27, 2023
Bitcoin (BTC), Crypto news, Ethereum (ETH), Ripple (XRP)
Even as XRP encountered considerable upheaval due to escalating regulatory challenges, South Korean investors have remained unfazed. In fact, the asset has emerged as the most preferred one in their portfolios, especially those in their 20s. This is evident by new findings, which show XRP comprising 20.7% of their investments, surpassing the combined 17.5% allocation for Bitcoin and Ethereum.
Overall, the proportion of XRP in the portfolios of individuals in their twenties...
Read More »
Jordan Lyanchev
August 27, 2023
Crypto news, Ethereum (ETH), Ripple (XRP)
John Deaton, founder of CryptolawUS and an advocate for XRP holders, spoke out against the SEC’s “aiding and abetting” allegations against Brad Garlinghouse, CEO of Ripple.
Deaton claims that the situation might have been prevented if the SEC had allowed previous executives Bill Hinman and Jay Clayton to testify sooner.
In the Ripple v. SEC litigation, Digital Asset Investor said that he would have called former SEC employees Jay Clayton and Bill Hinman, as well as a16z...
Read More »
 Ripple (XRP)