Binance Coin saw a small price decline of around 0.48% over the past 24 hours and it currently trades at .34. However, the cryptocurrency is now down by about 13% over the past week and by 30% over the past 90 days, making it the weakest performing altcoin out of the top 10 projects.Binance Coin is now the eighth-largest cryptocurrency with a market cap of .88 billion.Since our previous analysis, BNB rolled over at the resistance provided by the 200-days EMA and started to fall. It continued to drop beneath until finding the current support at .16.From above: The nearest level of resistance lies at .64 and . Above this, resistance is at .80 and . If the bulls can climb above , resistance is located at .92 (100-day EMA) and .80 (200-days EMA).From below: The
Topics:
Yaz Sheikh considers the following as important: binance coin price, bnb, Price Analysis
This could be interesting, too:
Bena Ilyas writes GraFun Launches on BNB Chain with 3.8M Pre-Registrations
CryptoVizArt writes ETH’s Path to K Involves Maintaining This Critical Support (Ethereum Price Analysis)
Bhushan Akolkar writes BNB Chain Boosts Stablecoin Infrastructure with Gasless Payments Initiative
Steve Muchoki writes Binance Charity to Airdrop M in BNB to Its Vietnam Users Affected by Typhoon Yagi
Binance Coin saw a small price decline of around 0.48% over the past 24 hours and it currently trades at $18.34. However, the cryptocurrency is now down by about 13% over the past week and by 30% over the past 90 days, making it the weakest performing altcoin out of the top 10 projects.
Binance Coin is now the eighth-largest cryptocurrency with a market cap of $2.88 billion.
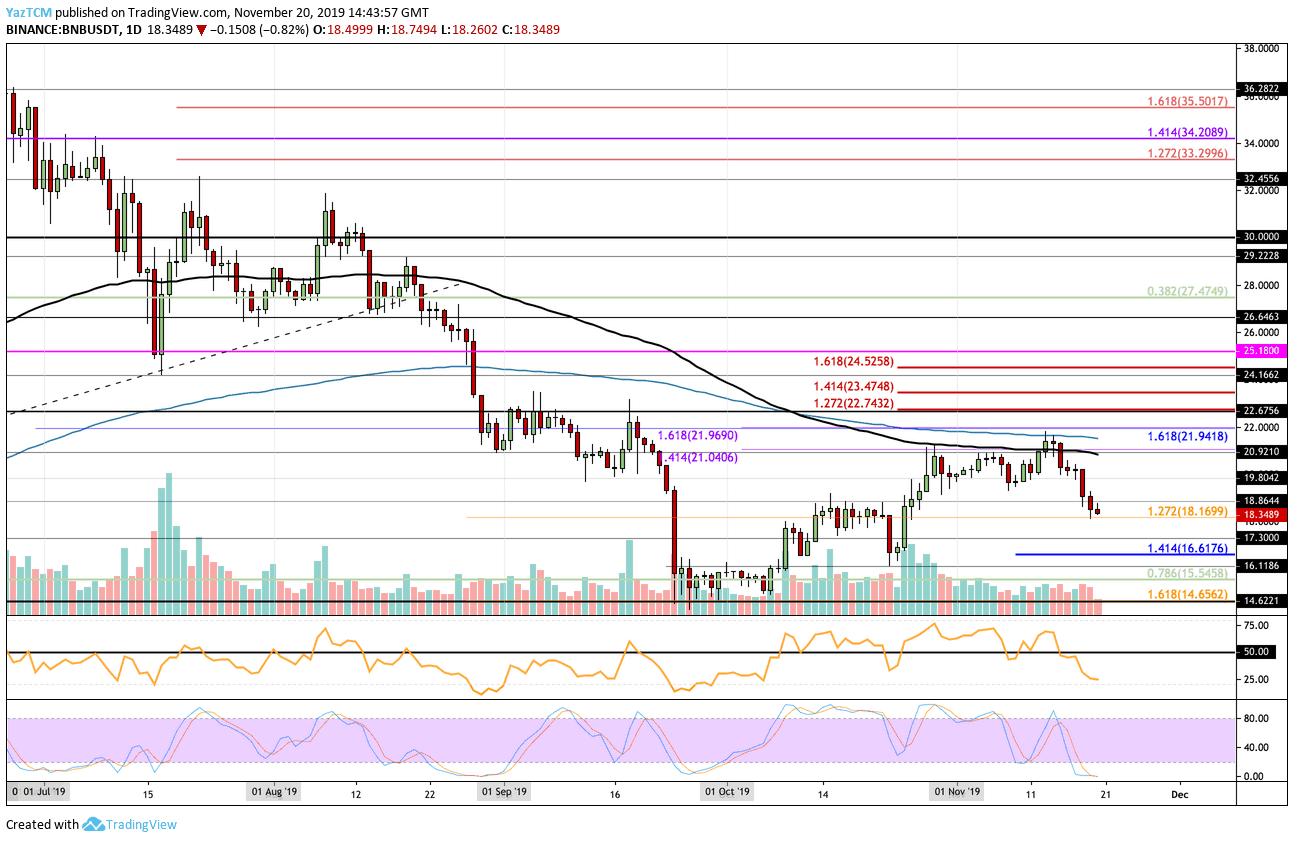
- Since our previous analysis, BNB rolled over at the resistance provided by the 200-days EMA and started to fall. It continued to drop beneath $20 until finding the current support at $18.16.
- From above: The nearest level of resistance lies at $18.64 and $19. Above this, resistance is at $19.80 and $20. If the bulls can climb above $20, resistance is located at $20.92 (100-day EMA) and $21.80 (200-days EMA).
- From below: The nearest levels of support lie at $18.16 and $18. Beneath $18, support is expected at $17.30, $17, $16.61, $16.11, and $16. If the selling proceeds beneath $16, support is found at $15.54, $15, and $14.65.
- The trading volume remains at the average level for the month.
- The RSI is in oversold territory which shows that the bulls control the market momentum. However, the Stochastic RSI is shaping up for a bullish crossover which should send the market higher.
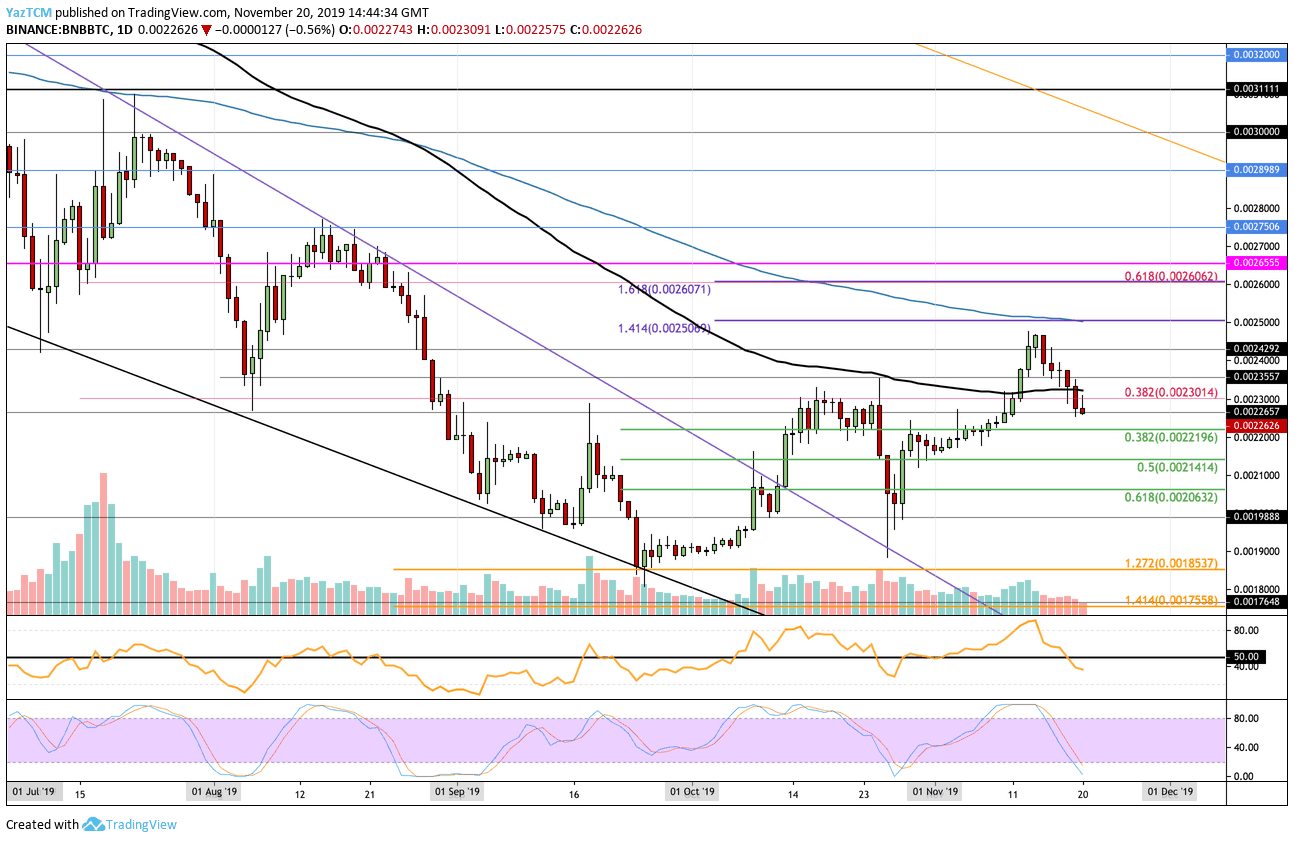
- Against Bitcoin, BNB failed to make it anywhere near the 0.0025 BTC level. It dropped beneath the support at 0.0023 BTC (provided by the 100-days EMA) and continued to decrease towards the current support at 0.002261 BTC.
- From above: The nearest level of resistance lies at 0.0023 BTC. Above this, resistance is found at 0.002355 BTC, 0.0024 BTC, 0.002429 BTC, and 0.0025 BTC (200-days EMA).
- From below: The nearest level of support is located at 0.002219 BTC (.382 Fib Retracement). Beneath this, support lies at 0.0022 BTC, 0.002141 BTC, and 0.0020 BTC.
- The trading volume remains at an average level.
- The RSI recently broke beneath the 50 level to show that the sellers have started to take control over the market momentum. For a recovery to be seen, we would need to see the RSI rise back above the 50 level.