Summary:
Stellar saw a sharp increase of around 8% over the past 24 hours and it currently trades at %excerpt%.068. The cryptocurrency went on a nice run in the second half of October after increasing by a total of 17% over the last 30 days.Stellar is now the tenth-largest cryptocurrency with a market cap of .39 billion.XLM suffered over the past 3 months after dropping by a total of 63% from June’s high to September’s support at %excerpt%.053. XLM rebounded here and started to ascend during October. The cryptocurrency is now facing resistance at the 100-days EMA at %excerpt%.070 and at the bearish .236 at %excerpt%.07297.From above: The nearest level of resistance lies at the aforementioned levels at %excerpt%.070 and %excerpt%.07297. Above this, resistance is expected at %excerpt%.075, %excerpt%.077 (1.272 Fib Extension), and %excerpt%.0799 (1.414 Fib
Topics:
Yaz Sheikh considers the following as important: Price Analysis
This could be interesting, too:
CryptoVizArt writes ETH’s Path to K Involves Maintaining This Critical Support (Ethereum Price Analysis)
Duo Nine writes Crypto Price Analysis June-29: ETH, XRP, ADA, DOGE, and DOT
Duo Nine writes Crypto Price Analysis June-15: ETH, XRP, ADA, DOGE, and DOT
Duo Nine writes Why is the Shiba Inu (SHIB) Price Down Today?
Stellar saw a sharp increase of around 8% over the past 24 hours and it currently trades at $0.068. The cryptocurrency went on a nice run in the second half of October after increasing by a total of 17% over the last 30 days.
Stellar is now the tenth-largest cryptocurrency with a market cap of $1.39 billion.
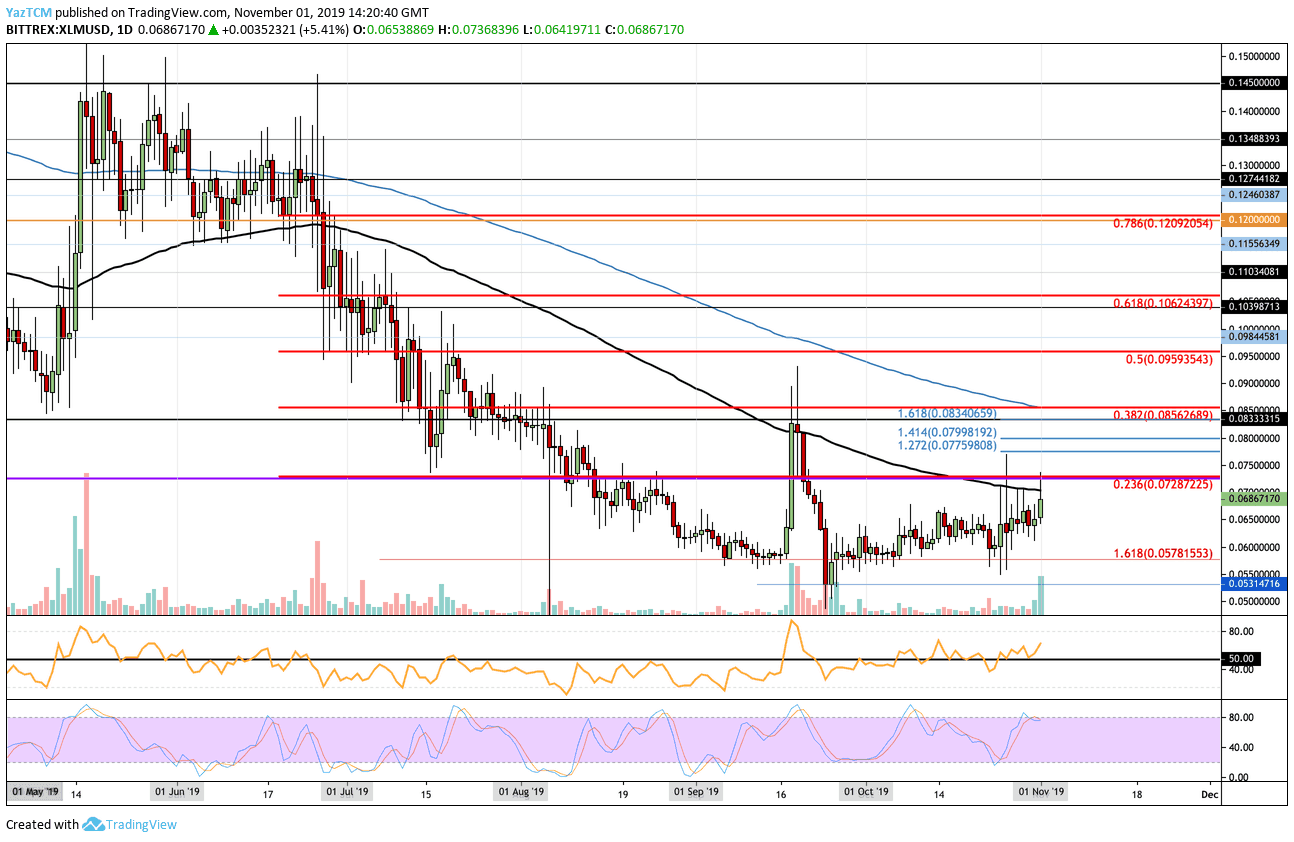
- XLM suffered over the past 3 months after dropping by a total of 63% from June’s high to September’s support at $0.053. XLM rebounded here and started to ascend during October. The cryptocurrency is now facing resistance at the 100-days EMA at $0.070 and at the bearish .236 at $0.07297.
- From above: The nearest level of resistance lies at the aforementioned levels at $0.070 and $0.07297. Above this, resistance is expected at $0.075, $0.077 (1.272 Fib Extension), and $0.0799 (1.414 Fib Extension). Above this, strong resistance is at $0.085 which is provided by the bearish .382 Fib Retracement and bolstered by the 200-days EMA.
- From below: The nearest level of support lies at $0.065 and $0.06. Beneath this, support is expected at $0.0578, $0.055, and $0.053.
- The trading volume has surged over the past two days.
- The RSI has recently penetrated above the 50 level to show that the bulls are in control over the market momentum. However, the Stochastic RSI has recently produced a bearish crossover signal which could send the market downward.
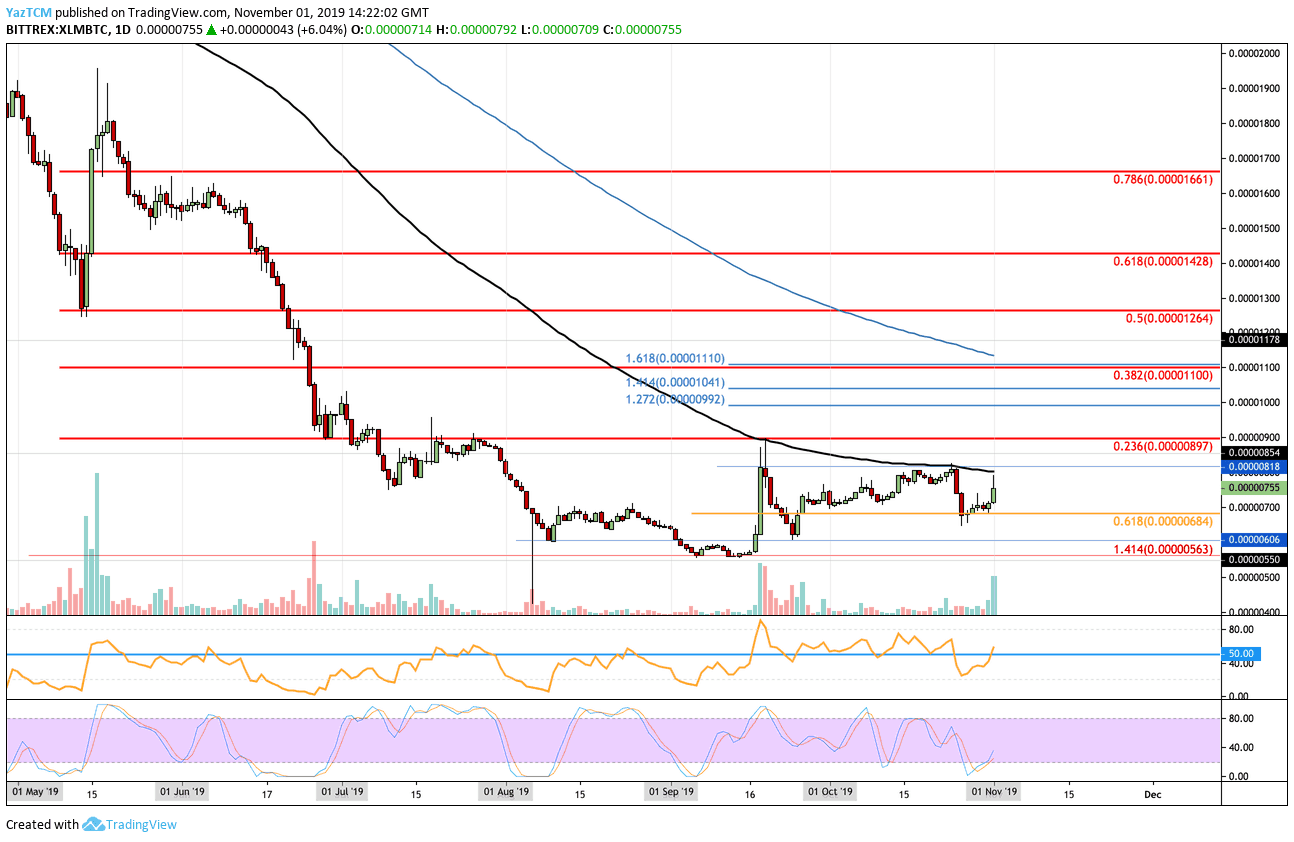
- Against Bitcoin, XLM fell from June through September until support was found at the 560 SAT level. It managed to rebound there but now it’s facing a by very strong resistance at the 818 SAT level. So far, the cryptocurrency hasn’t been able to break above during both September and October.
- From above: The nearest level of resistance lies at 818 SAT which is provided by the 100-days EMA. Above this, resistance is found at 854, 900 (bearish .236 Fib Retracement), 922 SAT (1.272 Fib Extension), 1041 SAT (1.414 Fib Extension), and 1100 SAT (bearish .382 Fib Retracement).
- From below: The nearest level of support lies at 684 SAT. Beneath this, support lies at 650 SAT, 600 SAT, and 560 SAT.
- The trading volume has surged during today’s trading session.
- The RSI has recently crept above the 50 level to show that the bulls have taken control over the market momentum. Furthermore, the Stochastic RSI has recently produced a bullish crossover signal in oversold conditions which is a strong buying signal.