Stellar saw a sharp increase of around 18% over the past 24 hours and it currently trades at %excerpt%.0811. This price increase comes after Stellar announced that they will be burning over half of their tokens. The Stellar foundation now controls around 30 billion XLM which is divided into a few buckets. 12 billion of it is in their direct development fund which is intended to support the organization. Stellar is up by a total of 22.53% over the past 7 days and 28% over the past 30 days. Stellar is now the tenth-largest cryptocurrency with a market cap of .64 billion.Since our last analysis, XLM managed to break above the resistance at the 100-days EMA at around %excerpt%.070 and continued further until reaching the resistance at the %excerpt%.0834 level.From above: The nearest level of resistance lies at
Topics:
Yaz Sheikh considers the following as important: Price Analysis
This could be interesting, too:
CryptoVizArt writes ETH’s Path to K Involves Maintaining This Critical Support (Ethereum Price Analysis)
Duo Nine writes Crypto Price Analysis June-29: ETH, XRP, ADA, DOGE, and DOT
Duo Nine writes Crypto Price Analysis June-15: ETH, XRP, ADA, DOGE, and DOT
Duo Nine writes Why is the Shiba Inu (SHIB) Price Down Today?
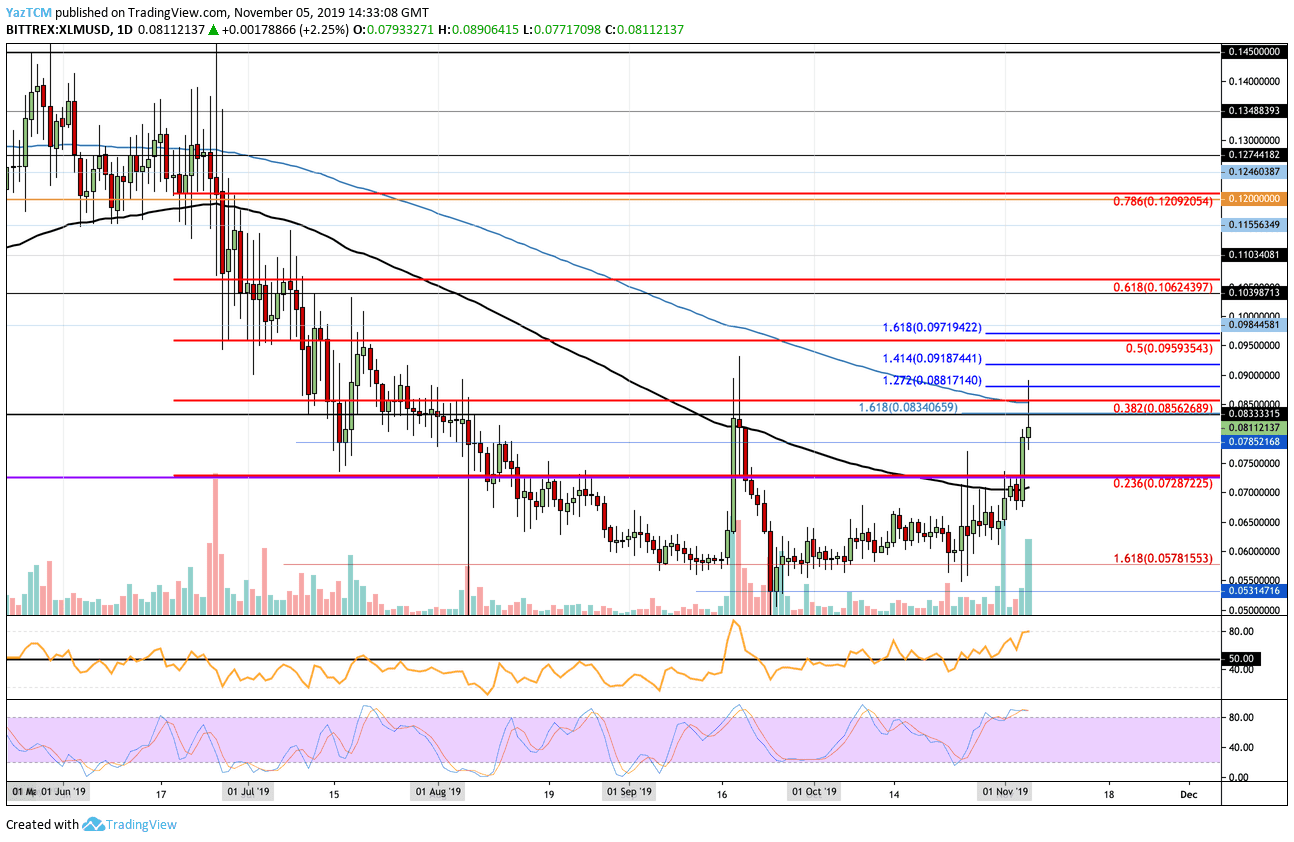
Stellar saw a sharp increase of around 18% over the past 24 hours and it currently trades at $0.0811. This price increase comes after Stellar announced that they will be burning over half of their tokens. The Stellar foundation now controls around 30 billion XLM which is divided into a few buckets. 12 billion of it is in their direct development fund which is intended to support the organization.
Stellar is up by a total of 22.53% over the past 7 days and 28% over the past 30 days.
Stellar is now the tenth-largest cryptocurrency with a market cap of $1.64 billion.
- Since our last analysis, XLM managed to break above the resistance at the 100-days EMA at around $0.070 and continued further until reaching the resistance at the $0.0834 level.
- From above: The nearest level of resistance lies at $0.0856 which is provided by the long term bearish .382 Fibonacci Retracement level and bolstered by the 200-days EMA. Above this, resistance lies at $0.0888 (1.272 FIb Ext), $0.091 (1.414 Fib Ext), and $0.0959 (bearish .5 Fib Retracement). If the buyers can continue above $0.1, resistance lies at $0.106, $0.11, and $0.115.
- From below: The nearest level of support lies at $0.0785. Beneath this, support lies at $0.072, $0.07, and $0.065. Lower support can be found at $0.06, $0.057, and $0.055.
- The trading volume has seen a significant surge after the latest coin burn announcement.
- The RSI is well above the 50 level to show the bulls dominate the market momentum. However, the Stochastic RSI is poised for a bearish crossover signal which could send the market lower.
- Against Bitcoin, XLM managed to break above the resistance at the 100-days EMA at 818 SAT. XLM continued to drive further higher until it met resistance around at the 900 SAT level, provided by a bearish .236 Fibonacci Retracement level.
- From above: The nearest level of resistance lies at the aforementioned 9000 SAT level. Above this, resistance lies at 992 SAT (1.272 Fib Extension), 1000 SAT, and 1041 SAT (1.414 Fib Extension). Higher resistance is then found at 1100 SAT (bearish .382 Fib Ret), 1150 SAT, 1178 SAT, and 1264 SAT (bearish .5 Fib Retracement).
- From below: The nearest level of support lies at 860 SAT. Beneath this, support lies at 818 SAT, 800 SAT (100-days EMA), 750 SAT, 700 SAT, and 684 SAT.
- The trading volume has seen a significant bump in today’s trading.
- Both the RSI and Stochastic RSI are in the bullish favor which shows this market will be headed higher.


