ADA/USD – New Monthly High and Attempt Break Above 2019 HighsKey Support Levels: %excerpt%.104, %excerpt%.1, %excerpt%.0974.Key Resistance Levels: %excerpt%.114, %excerpt%.12, %excerpt%.123.Cardano bounced from the support at %excerpt%.0932 (.5 Fib Retracement) this week, which allowed it to surge by 15%. On the way up, ADA broke above resistance at %excerpt%.1 to close the daily candle at the %excerpt%.104 resistance yesterday. A bearish .382 Fib Retracement level provided this resistance.Today, ADA continued higher above %excerpt%.104 as it makes its pace toward .07, where lies the 2019 highs. The cryptocurrency experienced increasing volume over the past few days, suggesting that ADA should have no problem breaking the aforementioned resistance.ADA/USD Daily Chart. Source: TradingViewADA-USD Short Term Price PredictionLooking ahead, if the buyers
Topics:
Yaz Sheikh considers the following as important: ADABTC, ADAUSD, Cardano (ADA) Price, Price Analysis
This could be interesting, too:
Jordan Lyanchev writes Cardano (ADA) Surpasses Dogecoin After 55% Surge
Jordan Lyanchev writes Trump Confirms Work on Strategic Crypto Reserve: XRP, ADA, SOL Included
Dimitar Dzhondzhorov writes Millions of ADA Sold by Cardano Whales During Market Crash – Will the Decline Continue?
Jordan Lyanchev writes Here’s How Cardano’s 17% Weekly Correction Can Help ADA Hit This Cycle: Analyst
ADA/USD – New Monthly High and Attempt Break Above 2019 Highs
Key Support Levels: $0.104, $0.1, $0.0974.
Key Resistance Levels: $0.114, $0.12, $0.123.
Cardano bounced from the support at $0.0932 (.5 Fib Retracement) this week, which allowed it to surge by 15%. On the way up, ADA broke above resistance at $0.1 to close the daily candle at the $0.104 resistance yesterday. A bearish .382 Fib Retracement level provided this resistance.
Today, ADA continued higher above $0.104 as it makes its pace toward $1.07, where lies the 2019 highs. The cryptocurrency experienced increasing volume over the past few days, suggesting that ADA should have no problem breaking the aforementioned resistance.
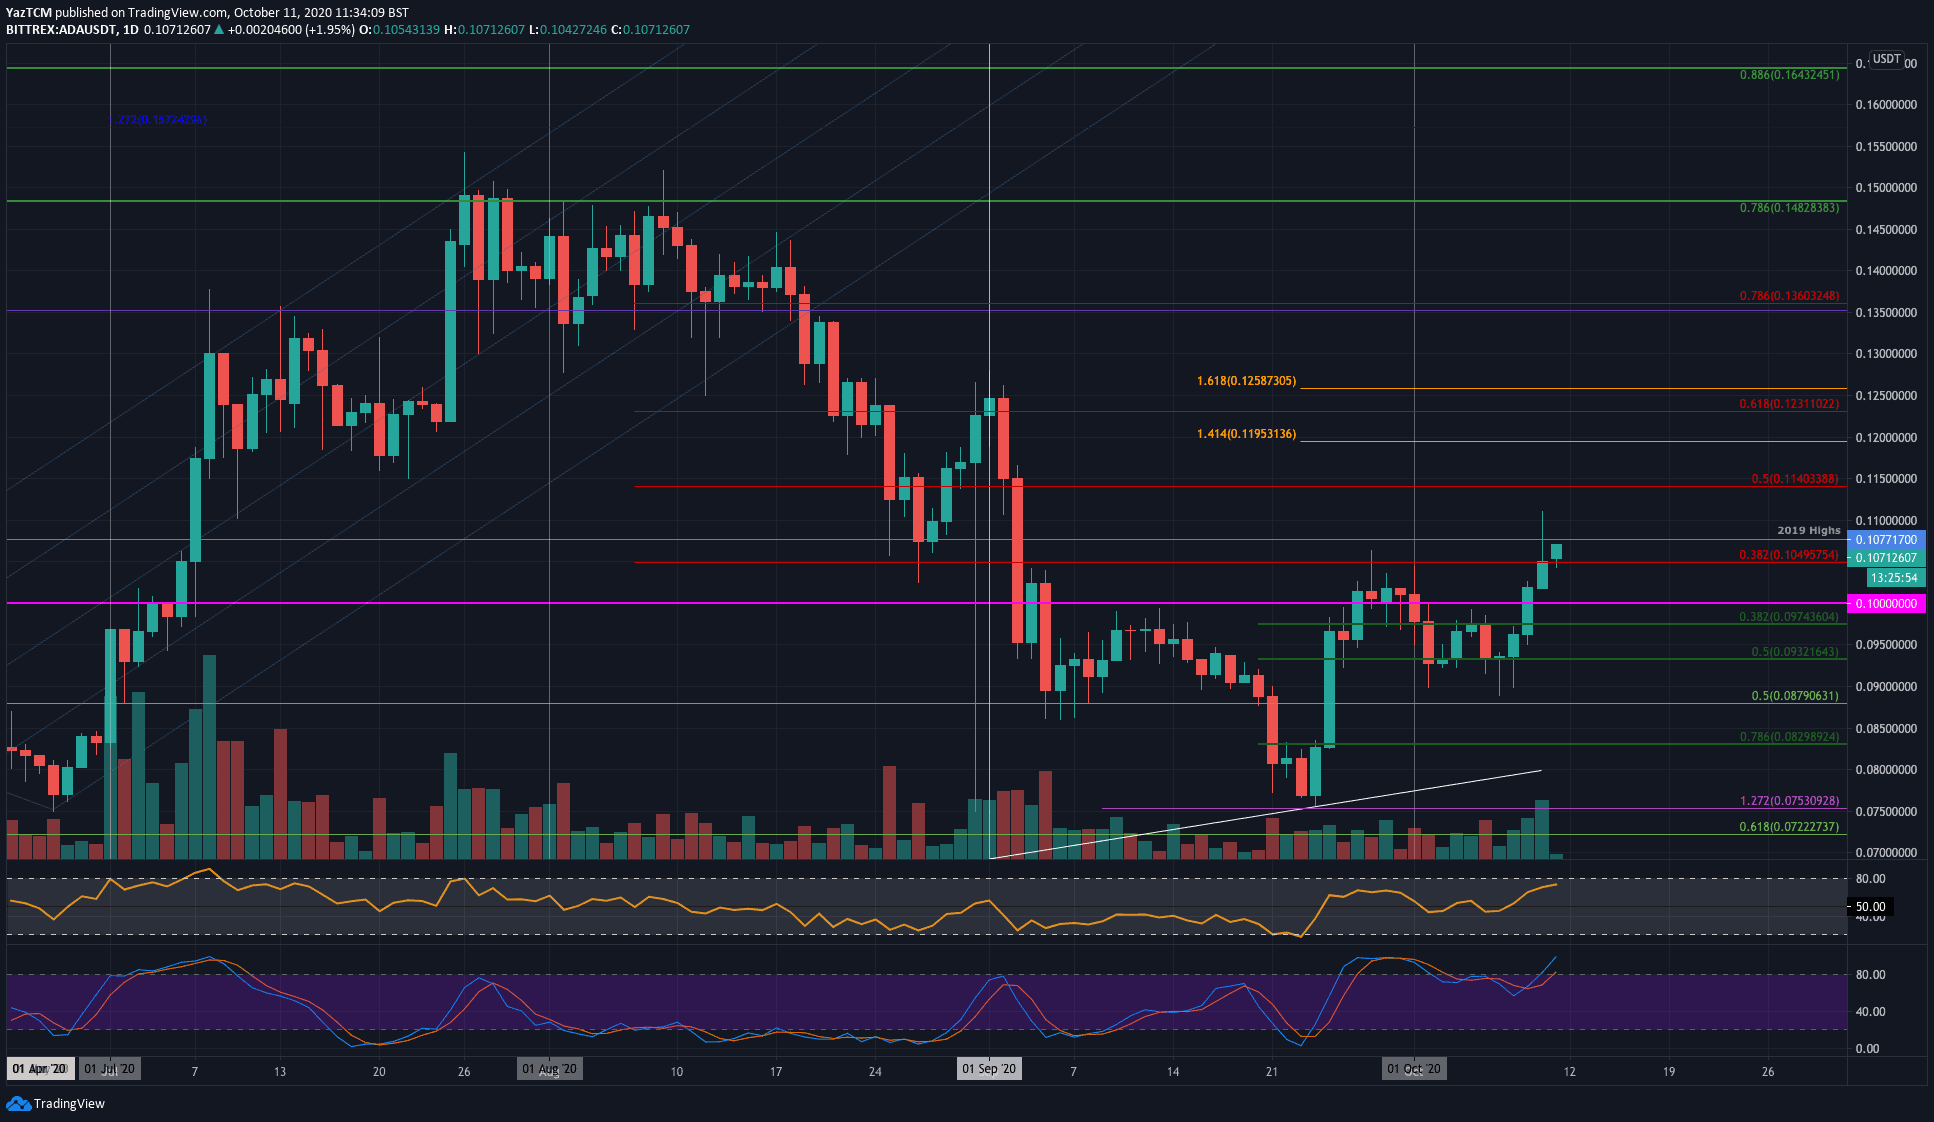
ADA-USD Short Term Price Prediction
Looking ahead, if the buyers continue above the 2019 highs, resistance first lies at $0.114 (bearish .5 Fib Retracement). Following this, resistance is expected at $0.12 (1.414 Fib Extension), $0.123 (bearish .618 Fib Retracement), and $0.125 (1.618 Fib Extension & September highs).
On the other side, the first level of support lies at $0.104. Beneath this, support is located at $0.1, $0.0974 (.382 Fib Retracement), $0.0932 (.5 Fib Retracement), and $0.09.
The RSI is now approaching overbought conditions, which could suggest the market might be a little overextended, and set for a correction.
ADA/BTC – Cardano Facing Resistance at Bearish .236 Fib Retracement
Key Support Levels: 900 SAT, 880 SAT, 810 SAT.
Key Resistance Levels: 945 SAT, 1000 SAT, 1050 SAT.
Cardano is also performing relatively well against Bitcoin after it bounced from 850 SAT earlier in the week to reach the current 945 SAT level – provided by a bearish .236 Fib Retracement.
This resistance level provided trouble for the market during September after ADA bounced from a 6-month-old ascending trend line toward the end of the month. Unfortunately, ADA could not break this resistance in September but should now continue above here with the increased bullish moment present within the market.
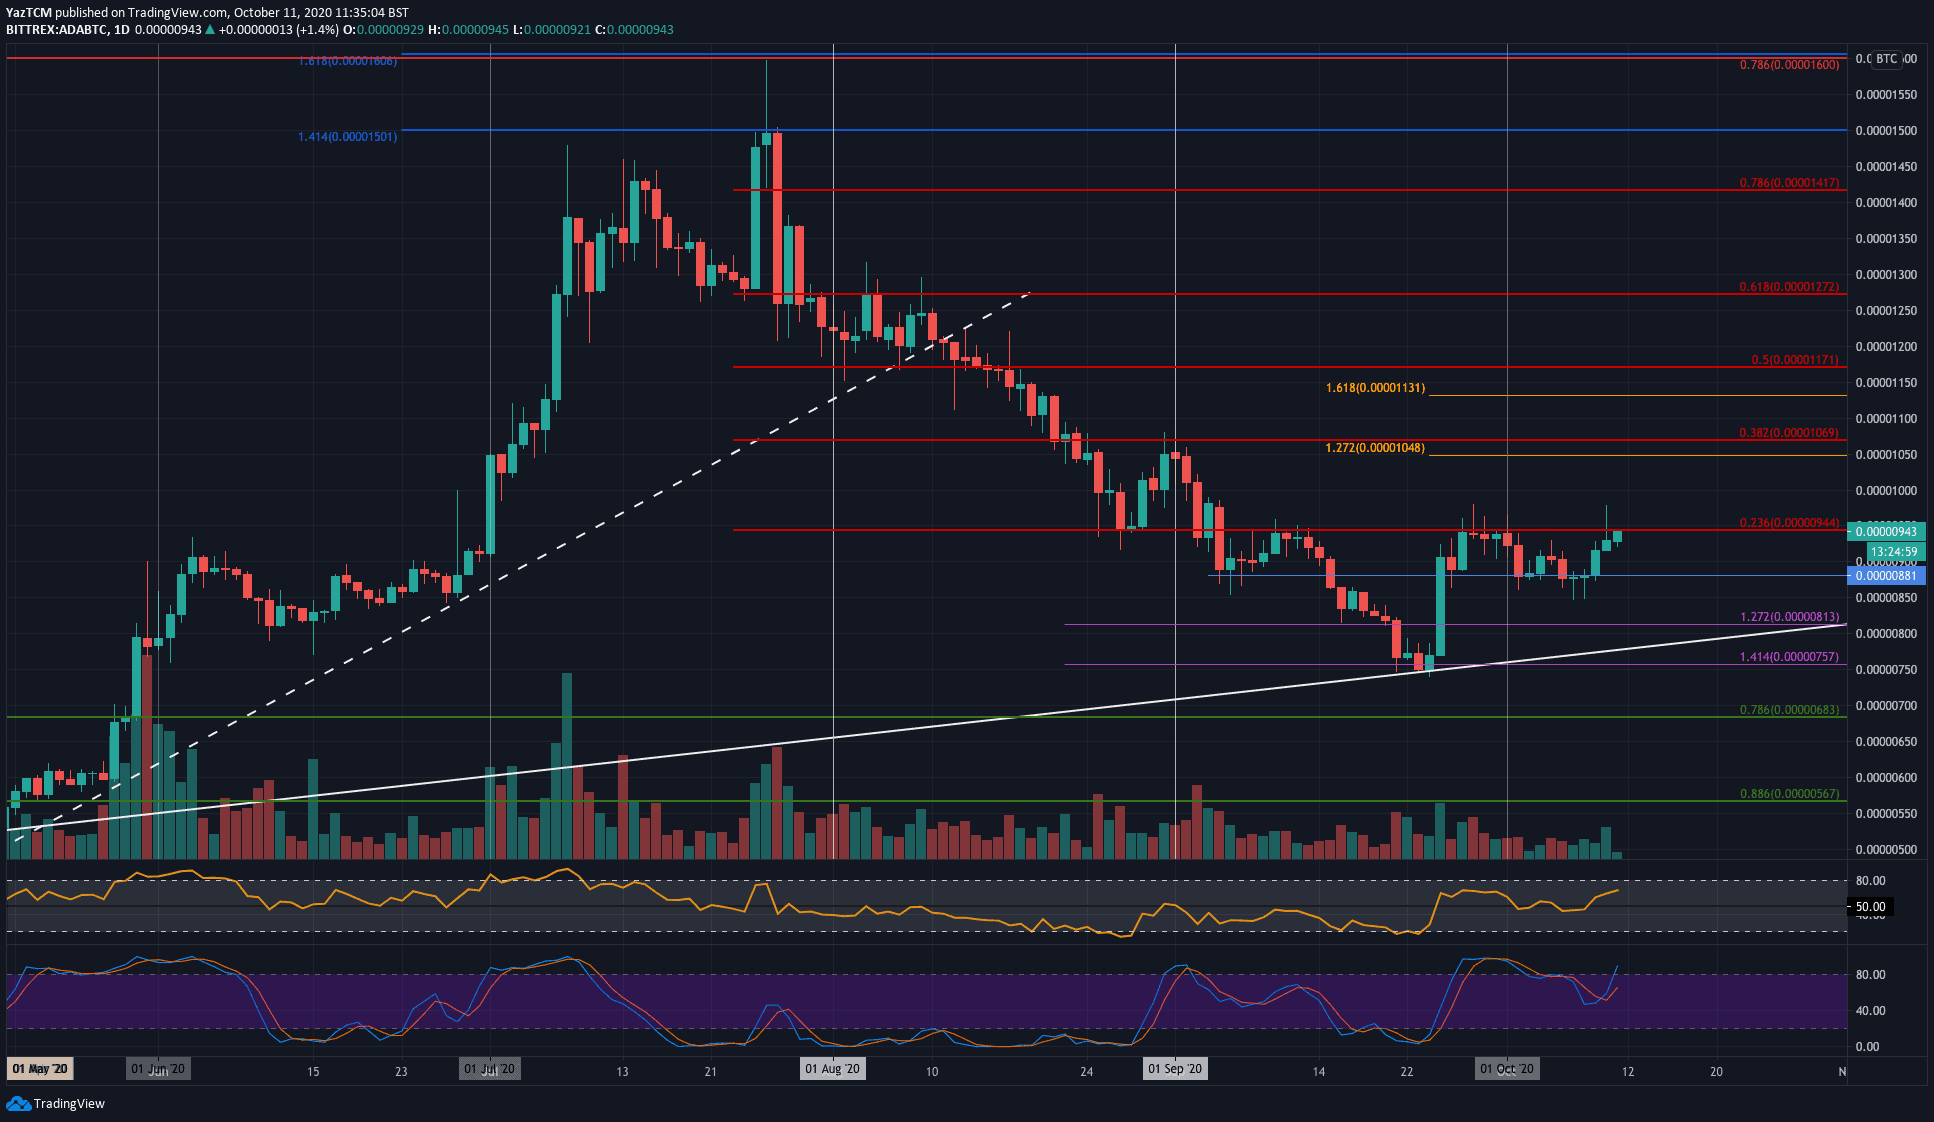
ADA-BTC Short Term Price Prediction
Once the buyers break above the 945 SAT level, the first level of resistance lies at 1000 SAT. This is followed by resistance at 1050 SAT (1.272 Fib Extension), 1070 SAT (bearish .382 Fib Retracement), and 1100 SAT.
On the other side, the first level of support lies at 900 SAT. Beneath this, support lies at 880 SAT, 850 SAT, 810 SAT, and 800 SAT (rising trend line).
The RSI is above the mid-line to indicate bullish momentum in the market, but it still has room to continue higher before becoming overbought.