LINK/USD – Bulls Rebound From Lower Boundary Of Ascending Price Channel. Key Support Levels: .50, , .80.Key Resistance Levels: .50, , .75. LINK saw a strong 6% price hike today as it rebounds from the lower boundary of an ascending price channel to trade at .9. The coin had started to form this pattern toward the end of September when it bounced from the support at .70 (.886 Fib Retracement) and started to head higher. LINK was unable to break resistance at .75 (bearish .5 Fib) toward the end of October which led to it falling into the lower boundary of the price channel at the start of November. It did spike beneath this level over the past couple of days but the buyers battled to make sure each daily candle closed within the confines of the
Topics:
Yaz Sheikh considers the following as important: Chainlink (LINK) Price, LINKBTC, LINKUSD, Price Analysis
This could be interesting, too:
Chayanika Deka writes Chainlink’s MVRV Ratio Signals Selling Exhaustion: What’s Next for LINK?
Chayanika Deka writes Whale and Shark Activity Pushes Chainlink (LINK) Past For the First Time in 37 Months
Martin Young writes Chainlink Partners With Major Finance Firms on AI, Oracles, and Blockchain Data Solution Project
Dimitar Dzhondzhorov writes Top 10 Cryptocurrencies by ‘Notable Development Activity’ (Santiment)
LINK/USD – Bulls Rebound From Lower Boundary Of Ascending Price Channel.
Key Support Levels: $10.50, $10, $9.80.
Key Resistance Levels: $11.50, $12, $12.75.
LINK saw a strong 6% price hike today as it rebounds from the lower boundary of an ascending price channel to trade at $10.9. The coin had started to form this pattern toward the end of September when it bounced from the support at $7.70 (.886 Fib Retracement) and started to head higher.
LINK was unable to break resistance at $12.75 (bearish .5 Fib) toward the end of October which led to it falling into the lower boundary of the price channel at the start of November. It did spike beneath this level over the past couple of days but the buyers battled to make sure each daily candle closed within the confines of the channel.
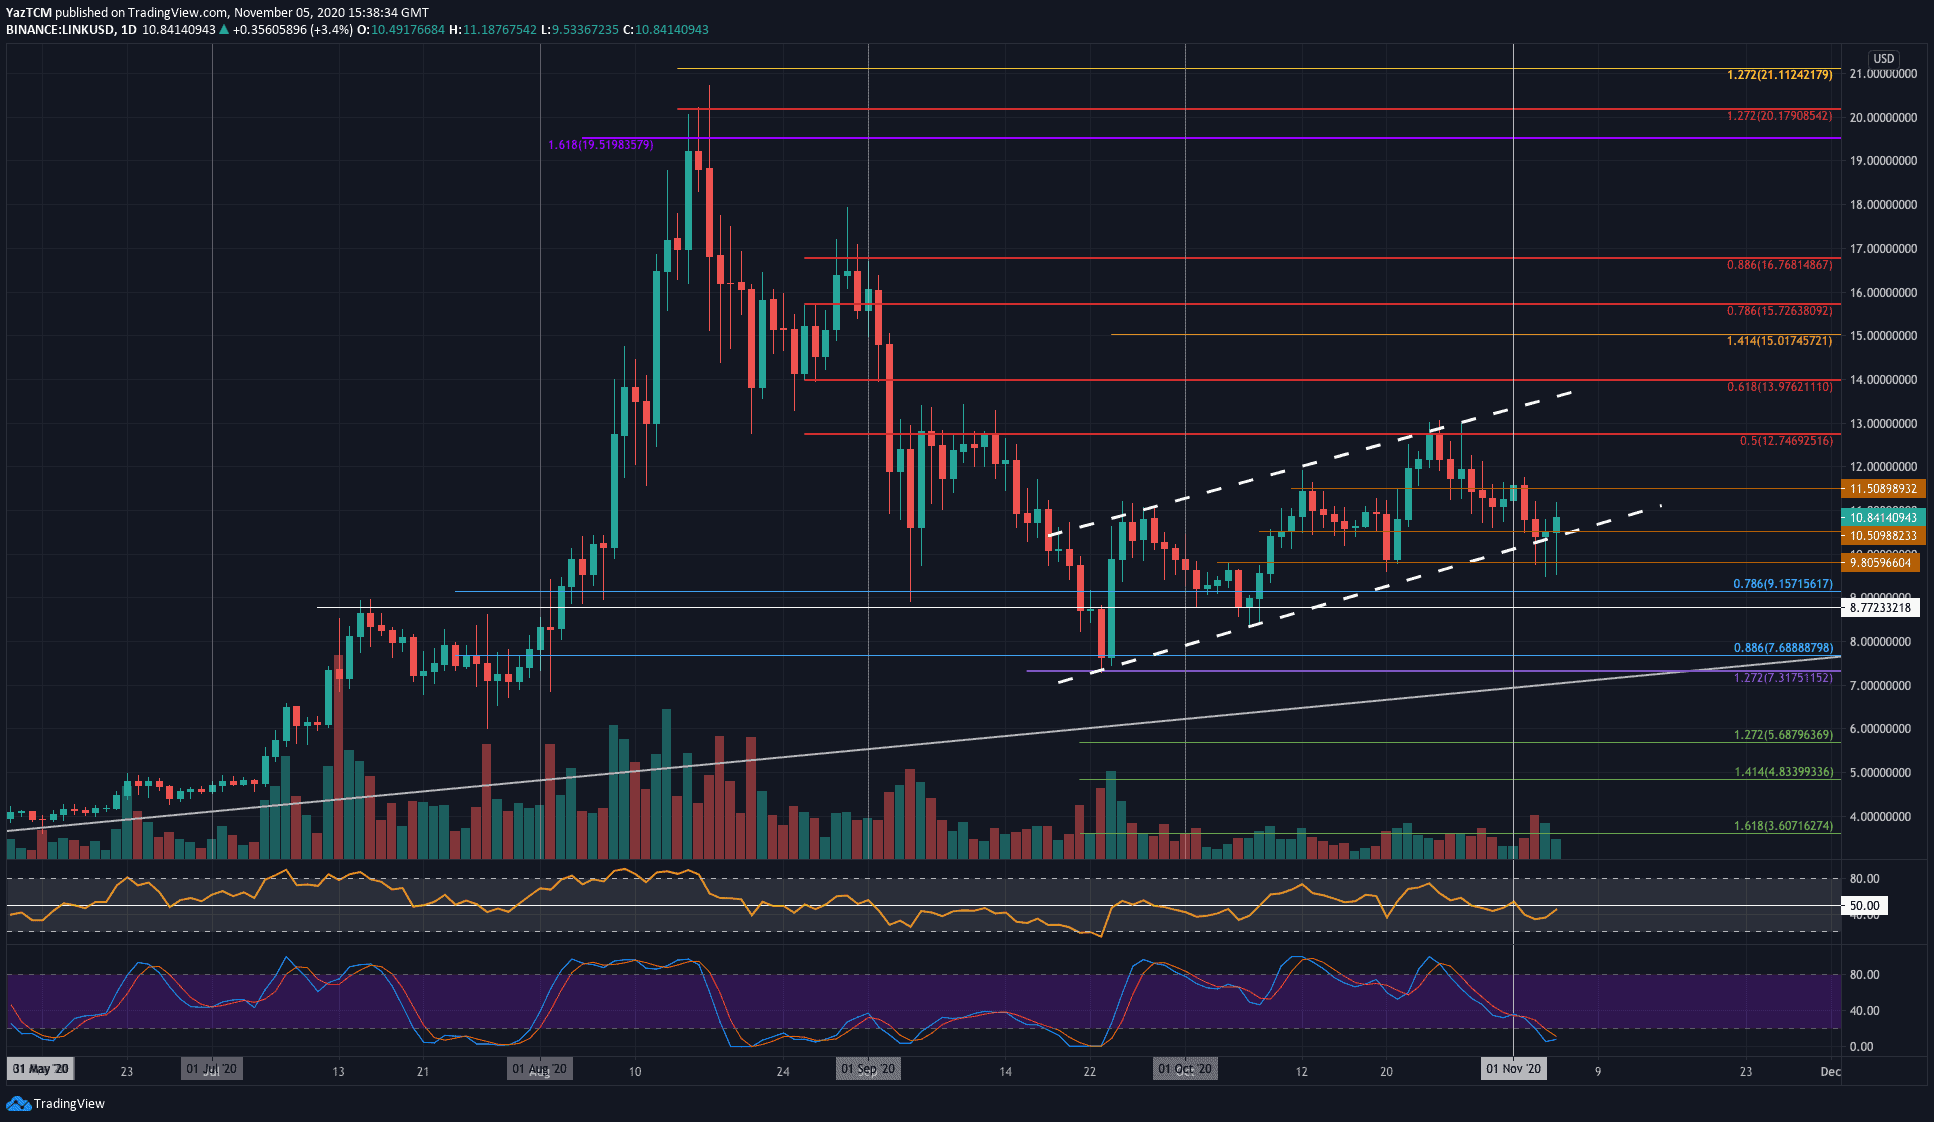
LINK-USD Short Term Price Prediction
Looking ahead, if the bulls continue to rebound higher from the lower boundary of the channel, the first level of resistance lies at $11.50. Above this, resistance is expected at $12, $12.75 (bearish .5 Fib Retracement), and then the upper boundary of the channel.
On the other side, if the sellers break beneath $10.50 and push beneath the price channel, the first level of support lies at $10. This is quickly followed by support at $9.80, $9.15 (.786 Fib Retracement), and $8.77.
The Stochastic RSI has reached overbought conditions and is about to form a bullish crossover signal that should help LINK push higher back toward the upper boundary of the channel.
LINK/BTC – Sellers Push To Three-Month Lows.
Key Support Levels: 70,000 SAT, 63,750 SAT, 60,800 SAT.
Key Resistance Levels: 74,200 SAT, 80,000 SAT, 86,800 SAT.
Against Bitcoin, LINK is now trading at three-month lows as it trades at 72,300 SAT today. The coin attempted to break the 100,000 SAT resistance earlier in October but failed to do which led it to drop lower into the 80,000 SAT support at the end of the month.
In November, LINK continued lower as it broke beneath 80,000 SAT to reach the current 72,300 SAT level today.
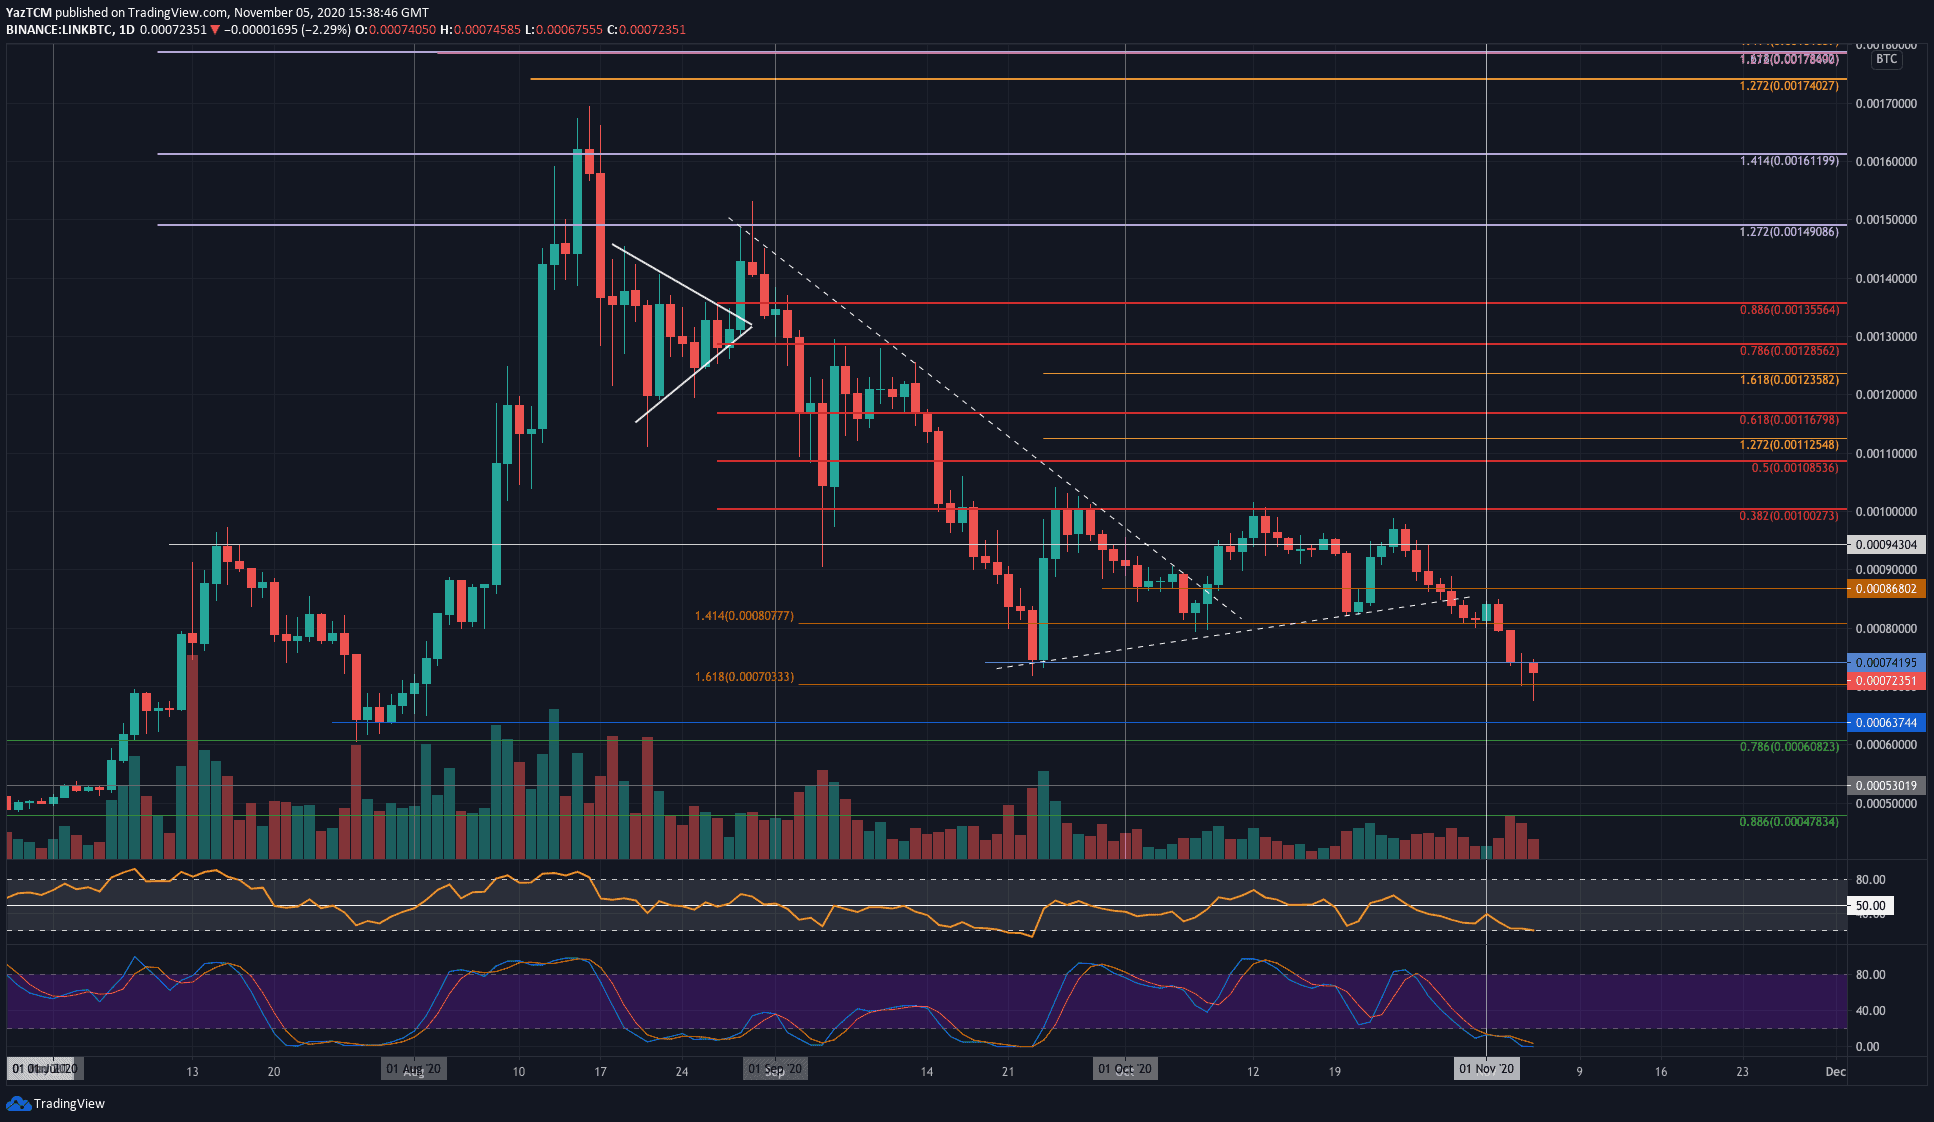
LINK-BTC Short Term Price Prediction
Looking ahead, if the sellers push lower, the first level of support lies at 70,000 SAT (downside 1.618 Fib Extension). Beneath this support lies at 63,750 SAT, 60,800 SAT (.786 Fib), and 60,000 SAT. Additional support lies at 55,000 SAT.
On the other side, the first level of resistance lies at 74,200 SAT (September lows). Above this, resistance is located at 80,000 SAT, 86,800 SAT, and 94,300 SAT.
The RSI and Stocahstic RSI are extremely oversold suggesting the sellers might be a little overextended.