XRP/USD – Bears Push XRP Into 100-days EMA Key Support Levels: %excerpt%.24, %excerpt%.237, %excerpt%.23.Key Resistance Levels: %excerpt%.251, %excerpt%.261, %excerpt%.271. XRP was performing well this week as it attempted to surge higher after bouncing from a rising trend line at the start of October. It managed to reach as high as %excerpt%.26 over the past few days, but it struggled to penetrate this level after numerous attempts. Over the past two days, XRP dropped by a sharp 6% as it fell from the upper boundary of the triangle to reach the lower boundary – which is further supported by the 100-days EMA. A break beneath this support could see XRP heading back toward the September lows at %excerpt%.22. XRP/USD Daily Chart. Source: TradingViewXRP-USD Short Term Price Prediction Looking ahead, if the sellers break below the
Topics:
Yaz Sheikh considers the following as important: Ripple (XRP) Price, XRP Analysis, xrpbtc, xrpusd
This could be interesting, too:
Jordan Lyanchev writes Ripple’s (XRP) Surge to Triggers Over Million in Short Liquidations
Jordan Lyanchev writes Trump Confirms Work on Strategic Crypto Reserve: XRP, ADA, SOL Included
Dimitar Dzhondzhorov writes Is a Major Ripple v. SEC Lawsuit Development Expected This Week? Here’s Why
Mandy Williams writes Ripple Releases Institutional DeFi Roadmap for XRP Ledger in 2025
XRP/USD – Bears Push XRP Into 100-days EMA
Key Support Levels: $0.24, $0.237, $0.23.
Key Resistance Levels: $0.251, $0.261, $0.271.
XRP was performing well this week as it attempted to surge higher after bouncing from a rising trend line at the start of October. It managed to reach as high as $0.26 over the past few days, but it struggled to penetrate this level after numerous attempts.
Over the past two days, XRP dropped by a sharp 6% as it fell from the upper boundary of the triangle to reach the lower boundary – which is further supported by the 100-days EMA. A break beneath this support could see XRP heading back toward the September lows at $0.22.
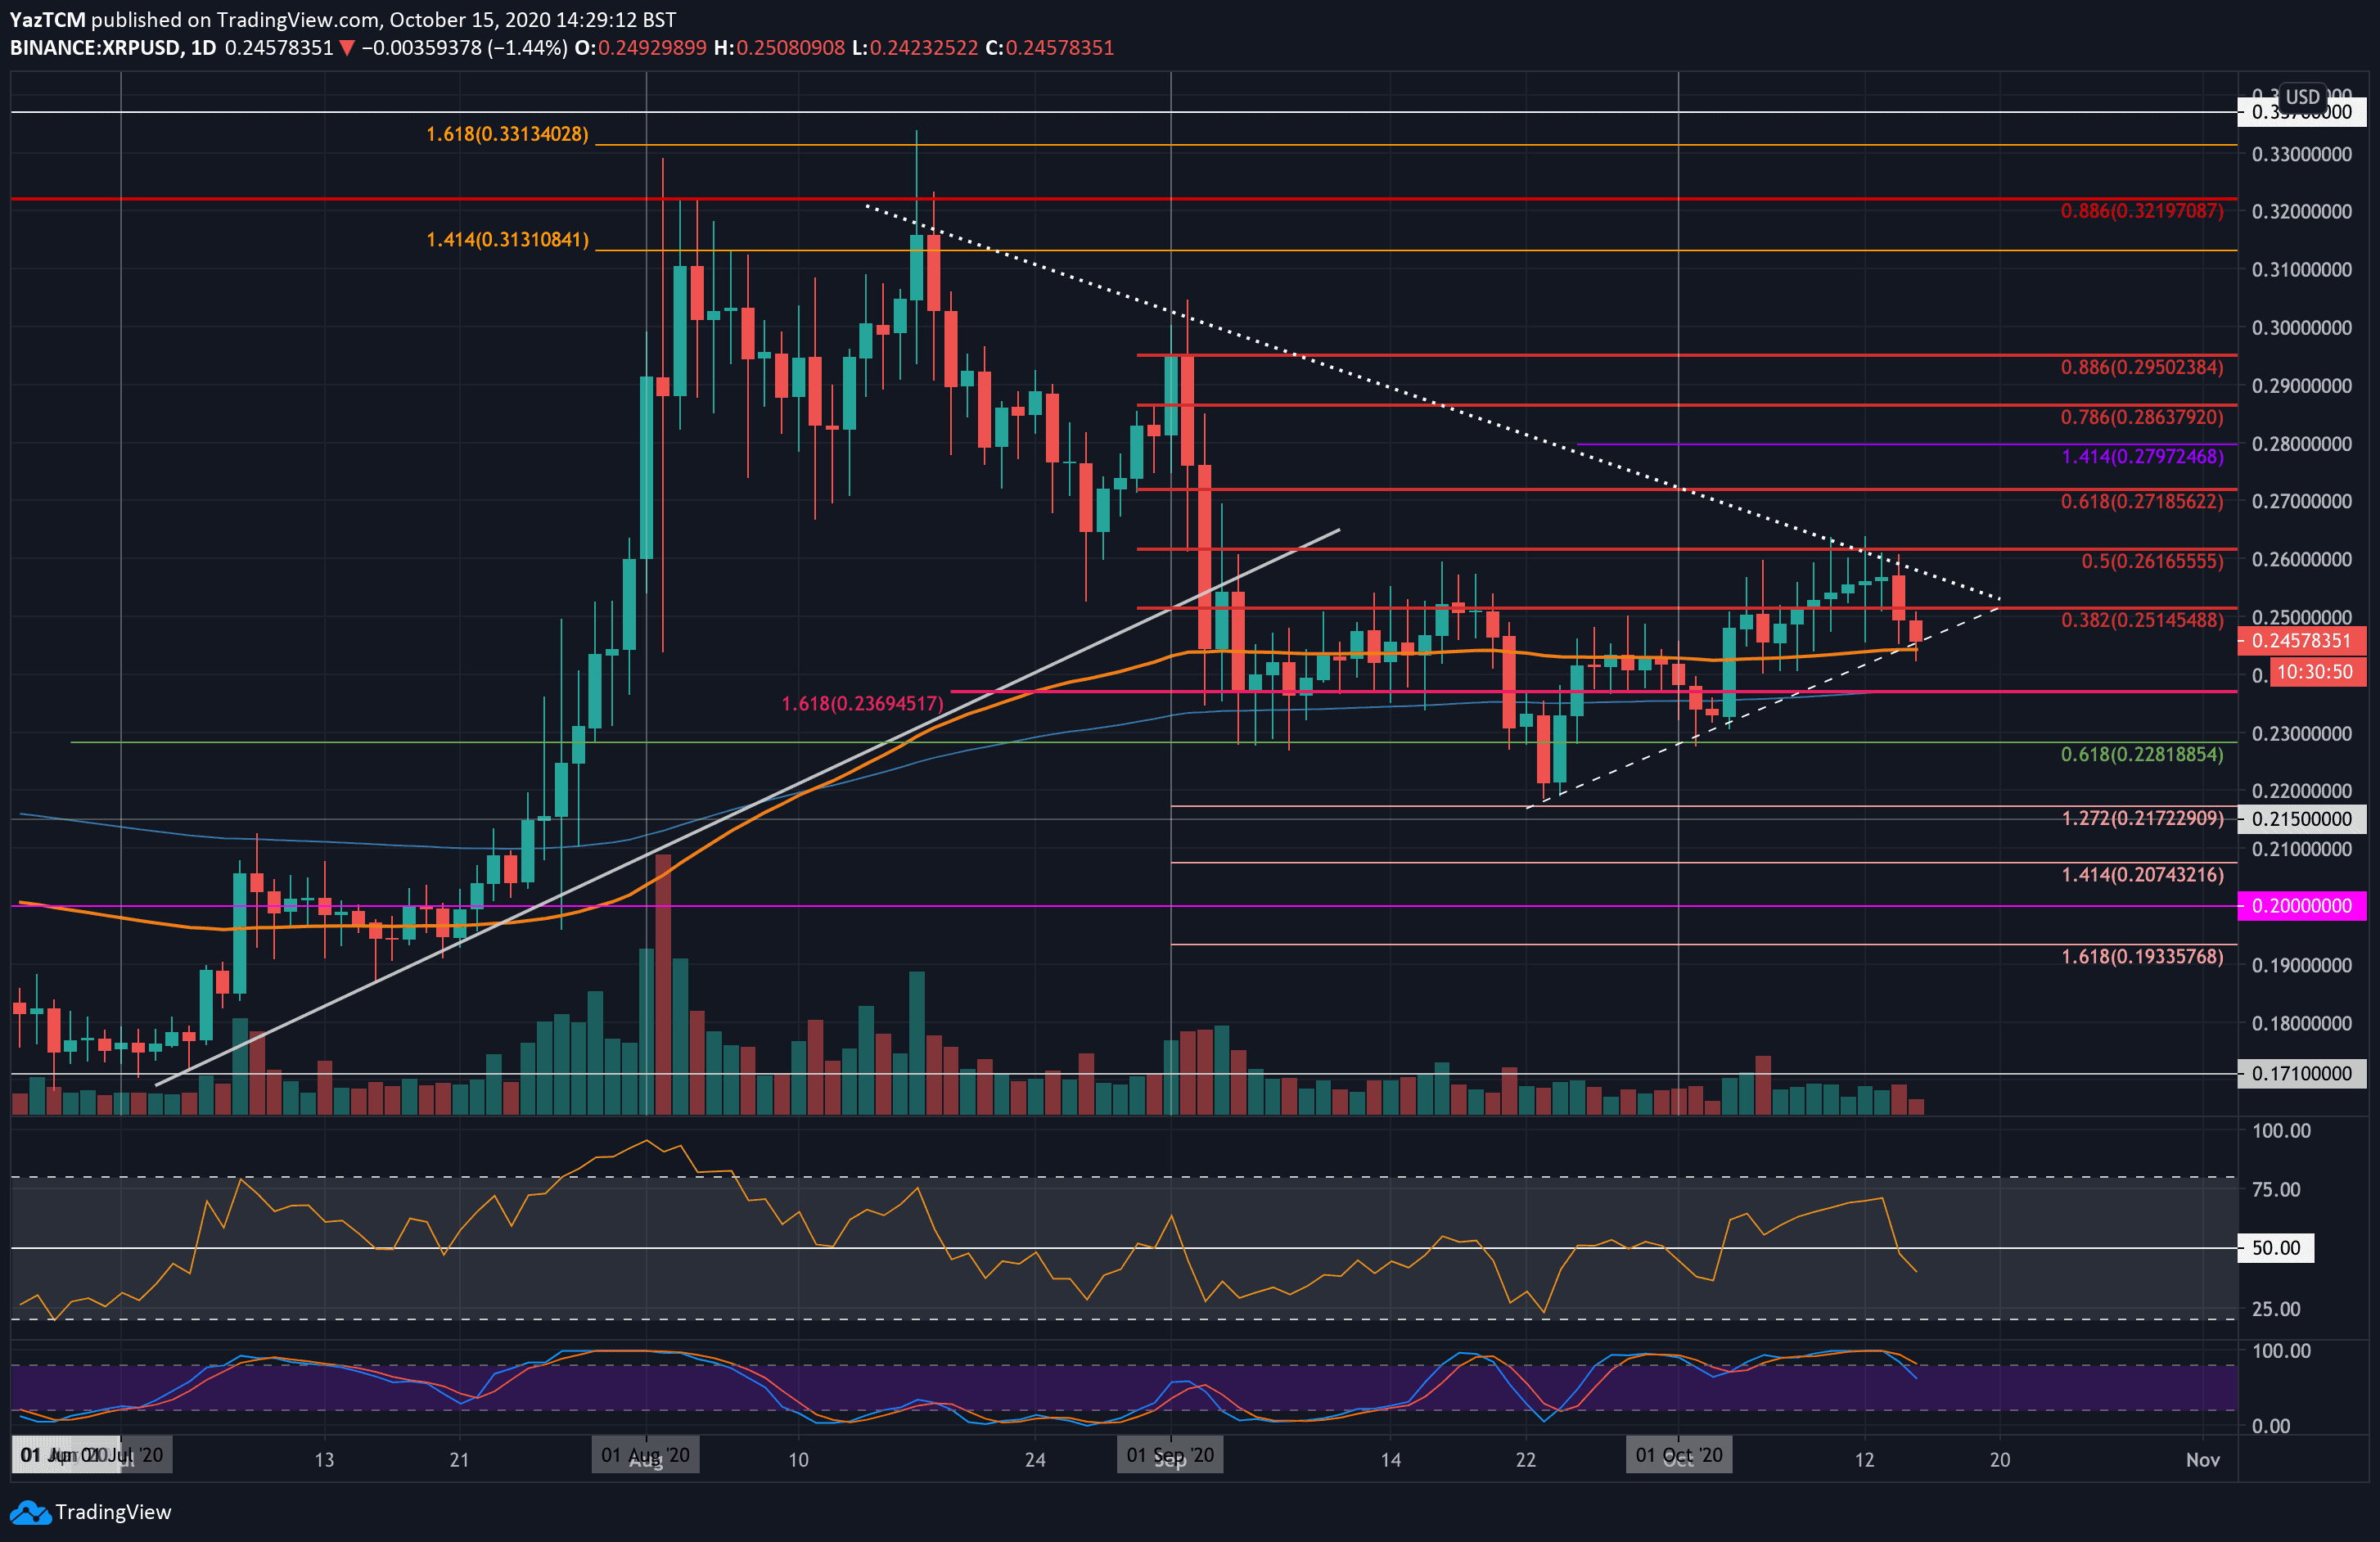
XRP-USD Short Term Price Prediction
Looking ahead, if the sellers break below the 100-days EMA and push beneath the triangle, the first level of support is expected at $0.24. Beneath this, support lies at $0.237 (200-days EA), $0.23, and $0.228 (.618 Fib Retracement).
On the other side, the first level of resistance is located at $0.251 (bearish .382 Fib). Above this, resistance lies at the triangle’s upper boundary, at $0.261 (bearish .5 Fib) and $0.271 (bearish .618 Fib).
The Stochastic RSI has produced a bearish crossover signal in overbought territory, which is a worrying signal for any XRP bulls.
XRP/BTC – Bulls Fail To Defend 2200 SAT
Key Support Levels: 2140 SAT, 2100 SAT, 2085 SAT.
Key Resistance Levels: 2200 SAT, 2250 SAT, 2300 SAT.
XRP also continues to struggle against Bitcoin itself. At the start of October, XRP had pushed higher from the 2200 SAT level to reach as high as 2400 SAT (200-days EMA). Unfortunately, it rolled over at this level and has headed lower ever since.
Yesterday, XRP dropped from 2250 SAT and penetrated beneath 2200 SAT. The coin continued lower today as it sank beneath the 2170 SAT support to reach as low as 2150 SAT.
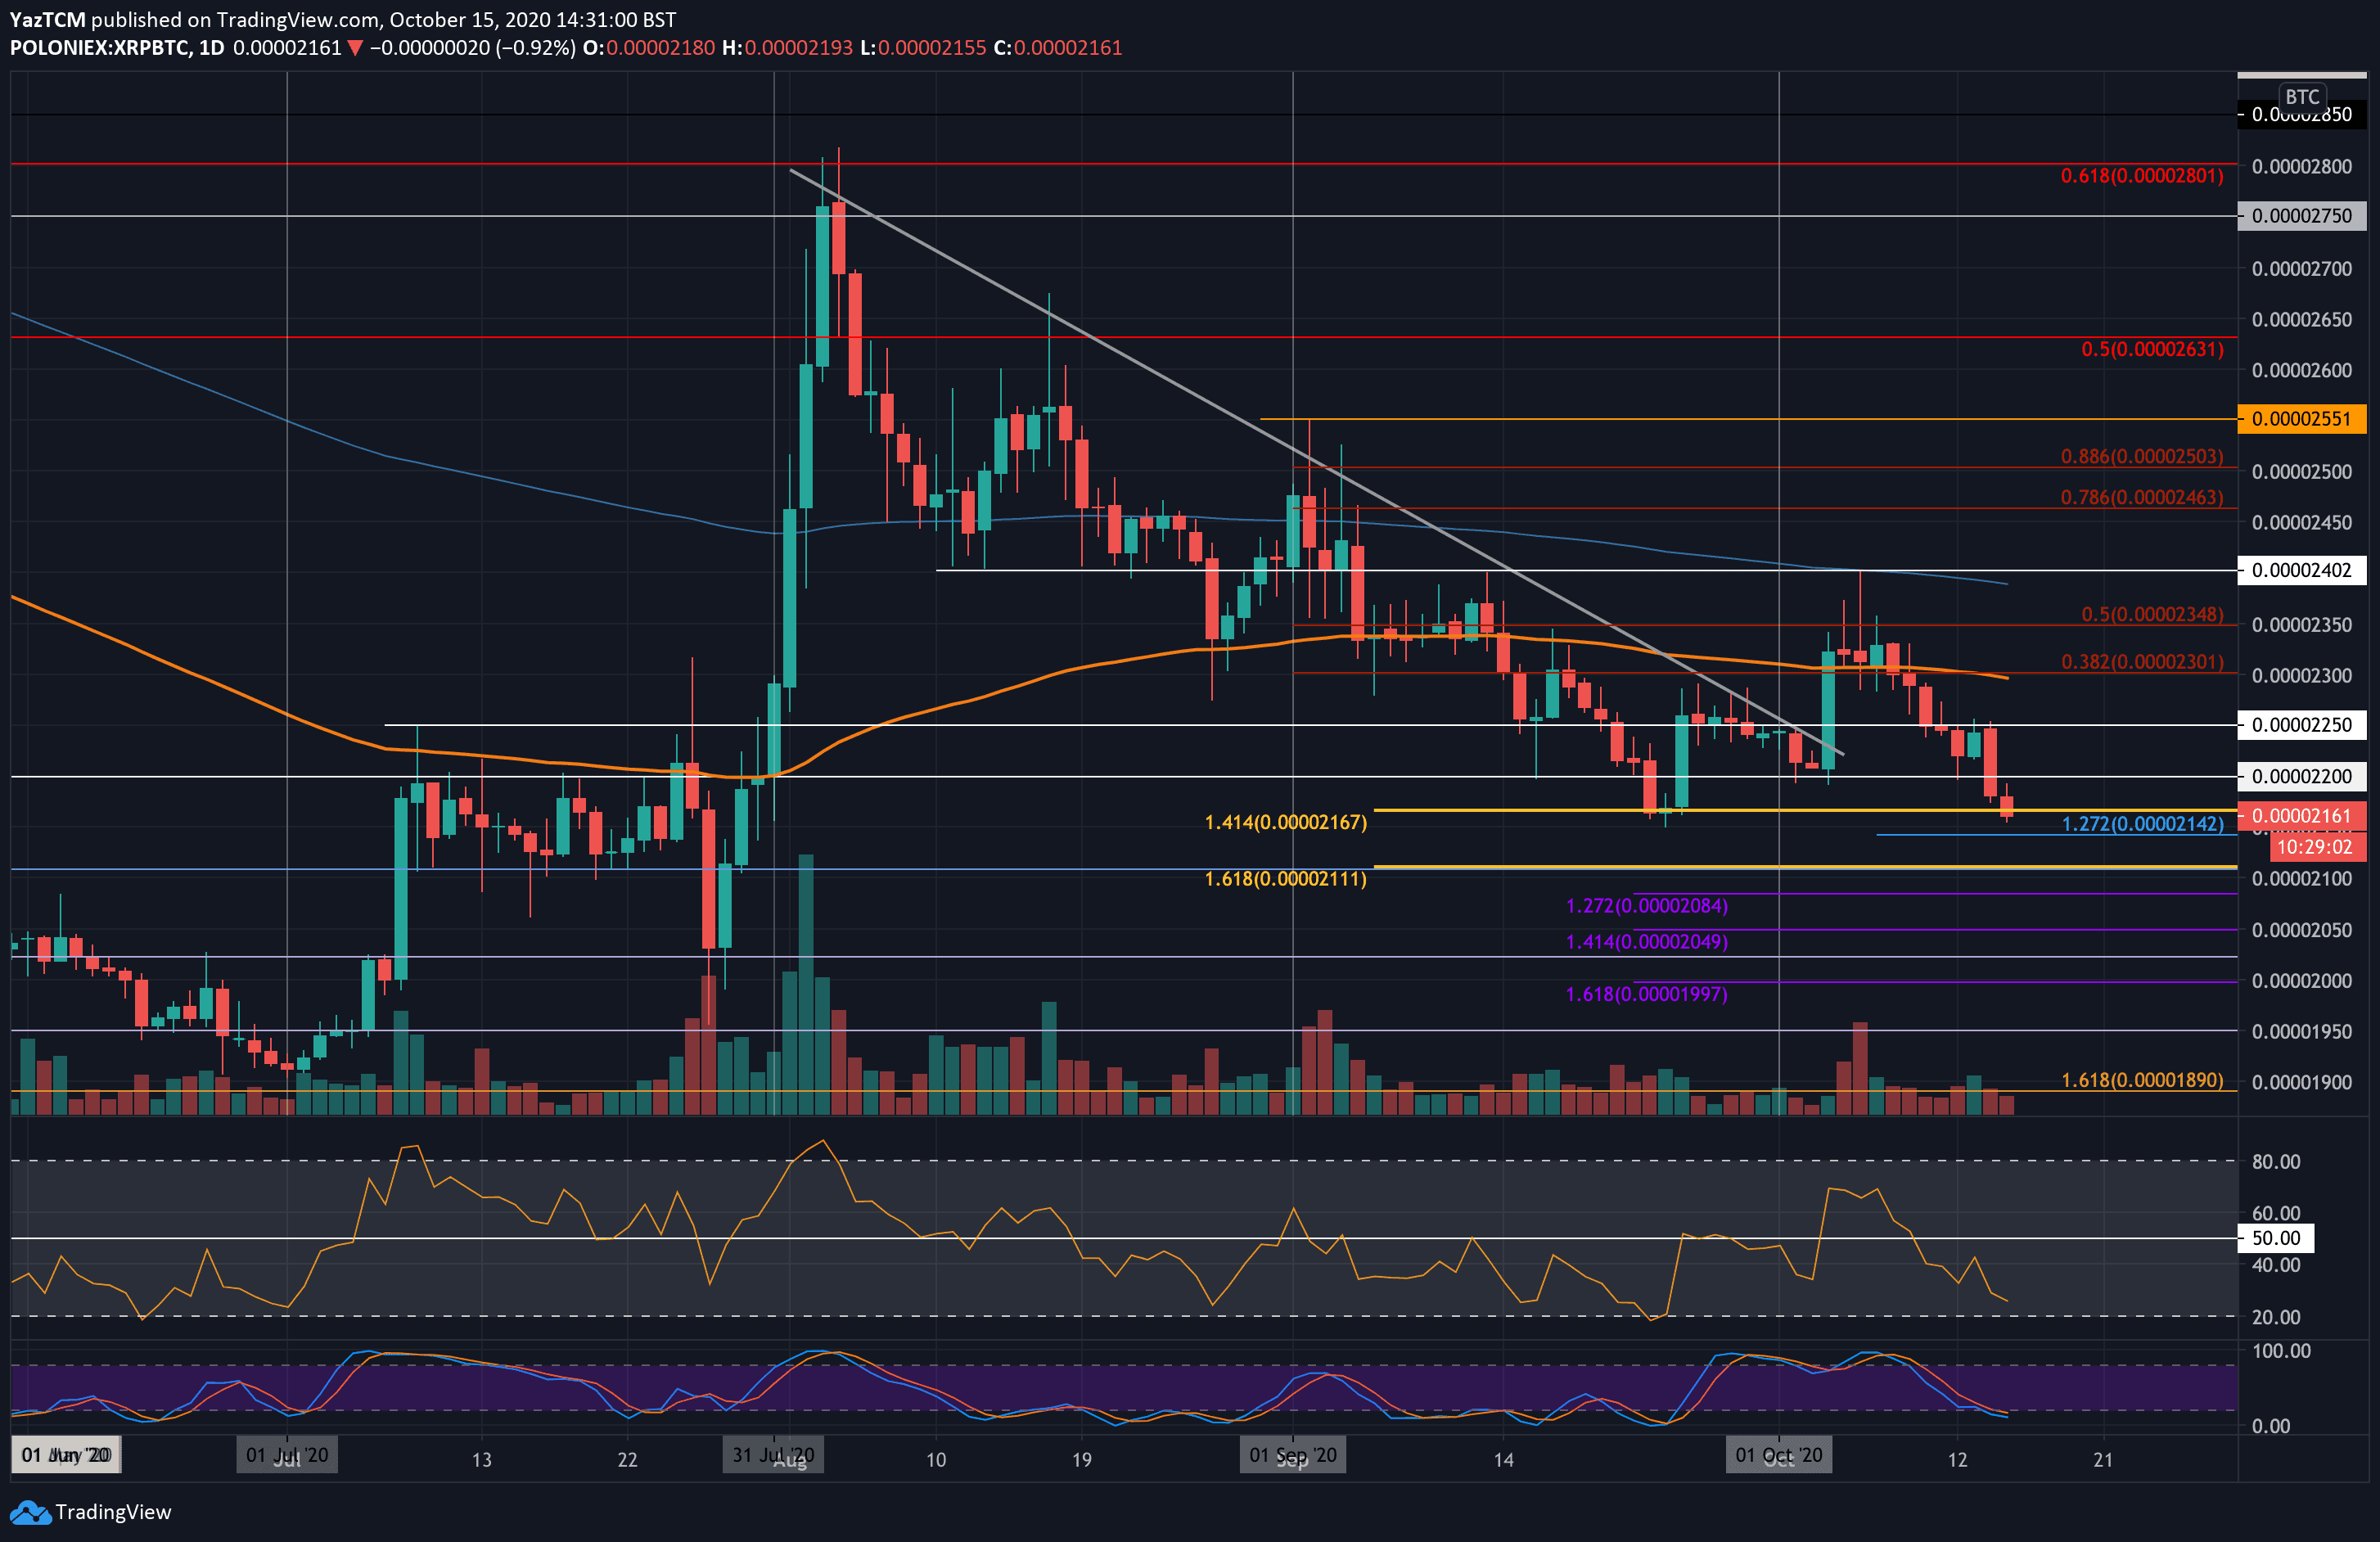
XRP-BTC Short Term Price Prediction
Looking ahead, if the sellers continue to push XRP lower, the first level of support lies at 2140 SAT. This is followed by support at 2100 SAT, 2085 SAT (downside 1.272 Fib Extension), and 2050 SAT (downside 1.414 Fib Extension).
On the other side, if the buyers start to push higher, the first level of resistance is expected at 2200 SAT. Above this, resistance lies at 2250 SAT, 2300 SAT (100-days EMA), and 2350 SAT.
The RSI has approached oversold territory here, and a bullish crossover signal could put an end to the current downtrend.