XLM/USD – Bulls Rebound Into 100-days EMA. Key Support Levels: %excerpt%.08, %excerpt%.075, %excerpt%.07.Key Resistance Levels: %excerpt%.086, %excerpt%.088, %excerpt%.0921. XLM found support at the %excerpt%.0668 (.618 Fib) level toward the end of September which allowed the downtrend to reverse. Throughout October, the coin has slowly been grinding higher. Initially, it struggled to break the resistance at %excerpt%.08, which is provided by the bearish .236 Fib Retracement level. This aforementioned resistance was penetrated today as XLM pushed higher to reach the current resistance at the 100-days EMA around %excerpt%.0814. XLM will need to break above this level to start a short-term bullish trend. XLM/USD Daily Chart. Source: TradingViewXLM-USD Short Term Price Prediction Looking ahead, if the buyers can break the 100-days EMA
Topics:
Yaz Sheikh considers the following as important: Price Analysis, Stellar (XLM) Price, XLMBTC, XLMUSD
This could be interesting, too:
Jordan Lyanchev writes Stellar (XLM) Explodes by 30% in 2 Days, Bitcoin (BTC) Stable at K (Weekend Watch)
CryptoVizArt writes ETH’s Path to K Involves Maintaining This Critical Support (Ethereum Price Analysis)
Duo Nine writes Crypto Price Analysis June-29: ETH, XRP, ADA, DOGE, and DOT
Duo Nine writes Crypto Price Analysis June-15: ETH, XRP, ADA, DOGE, and DOT
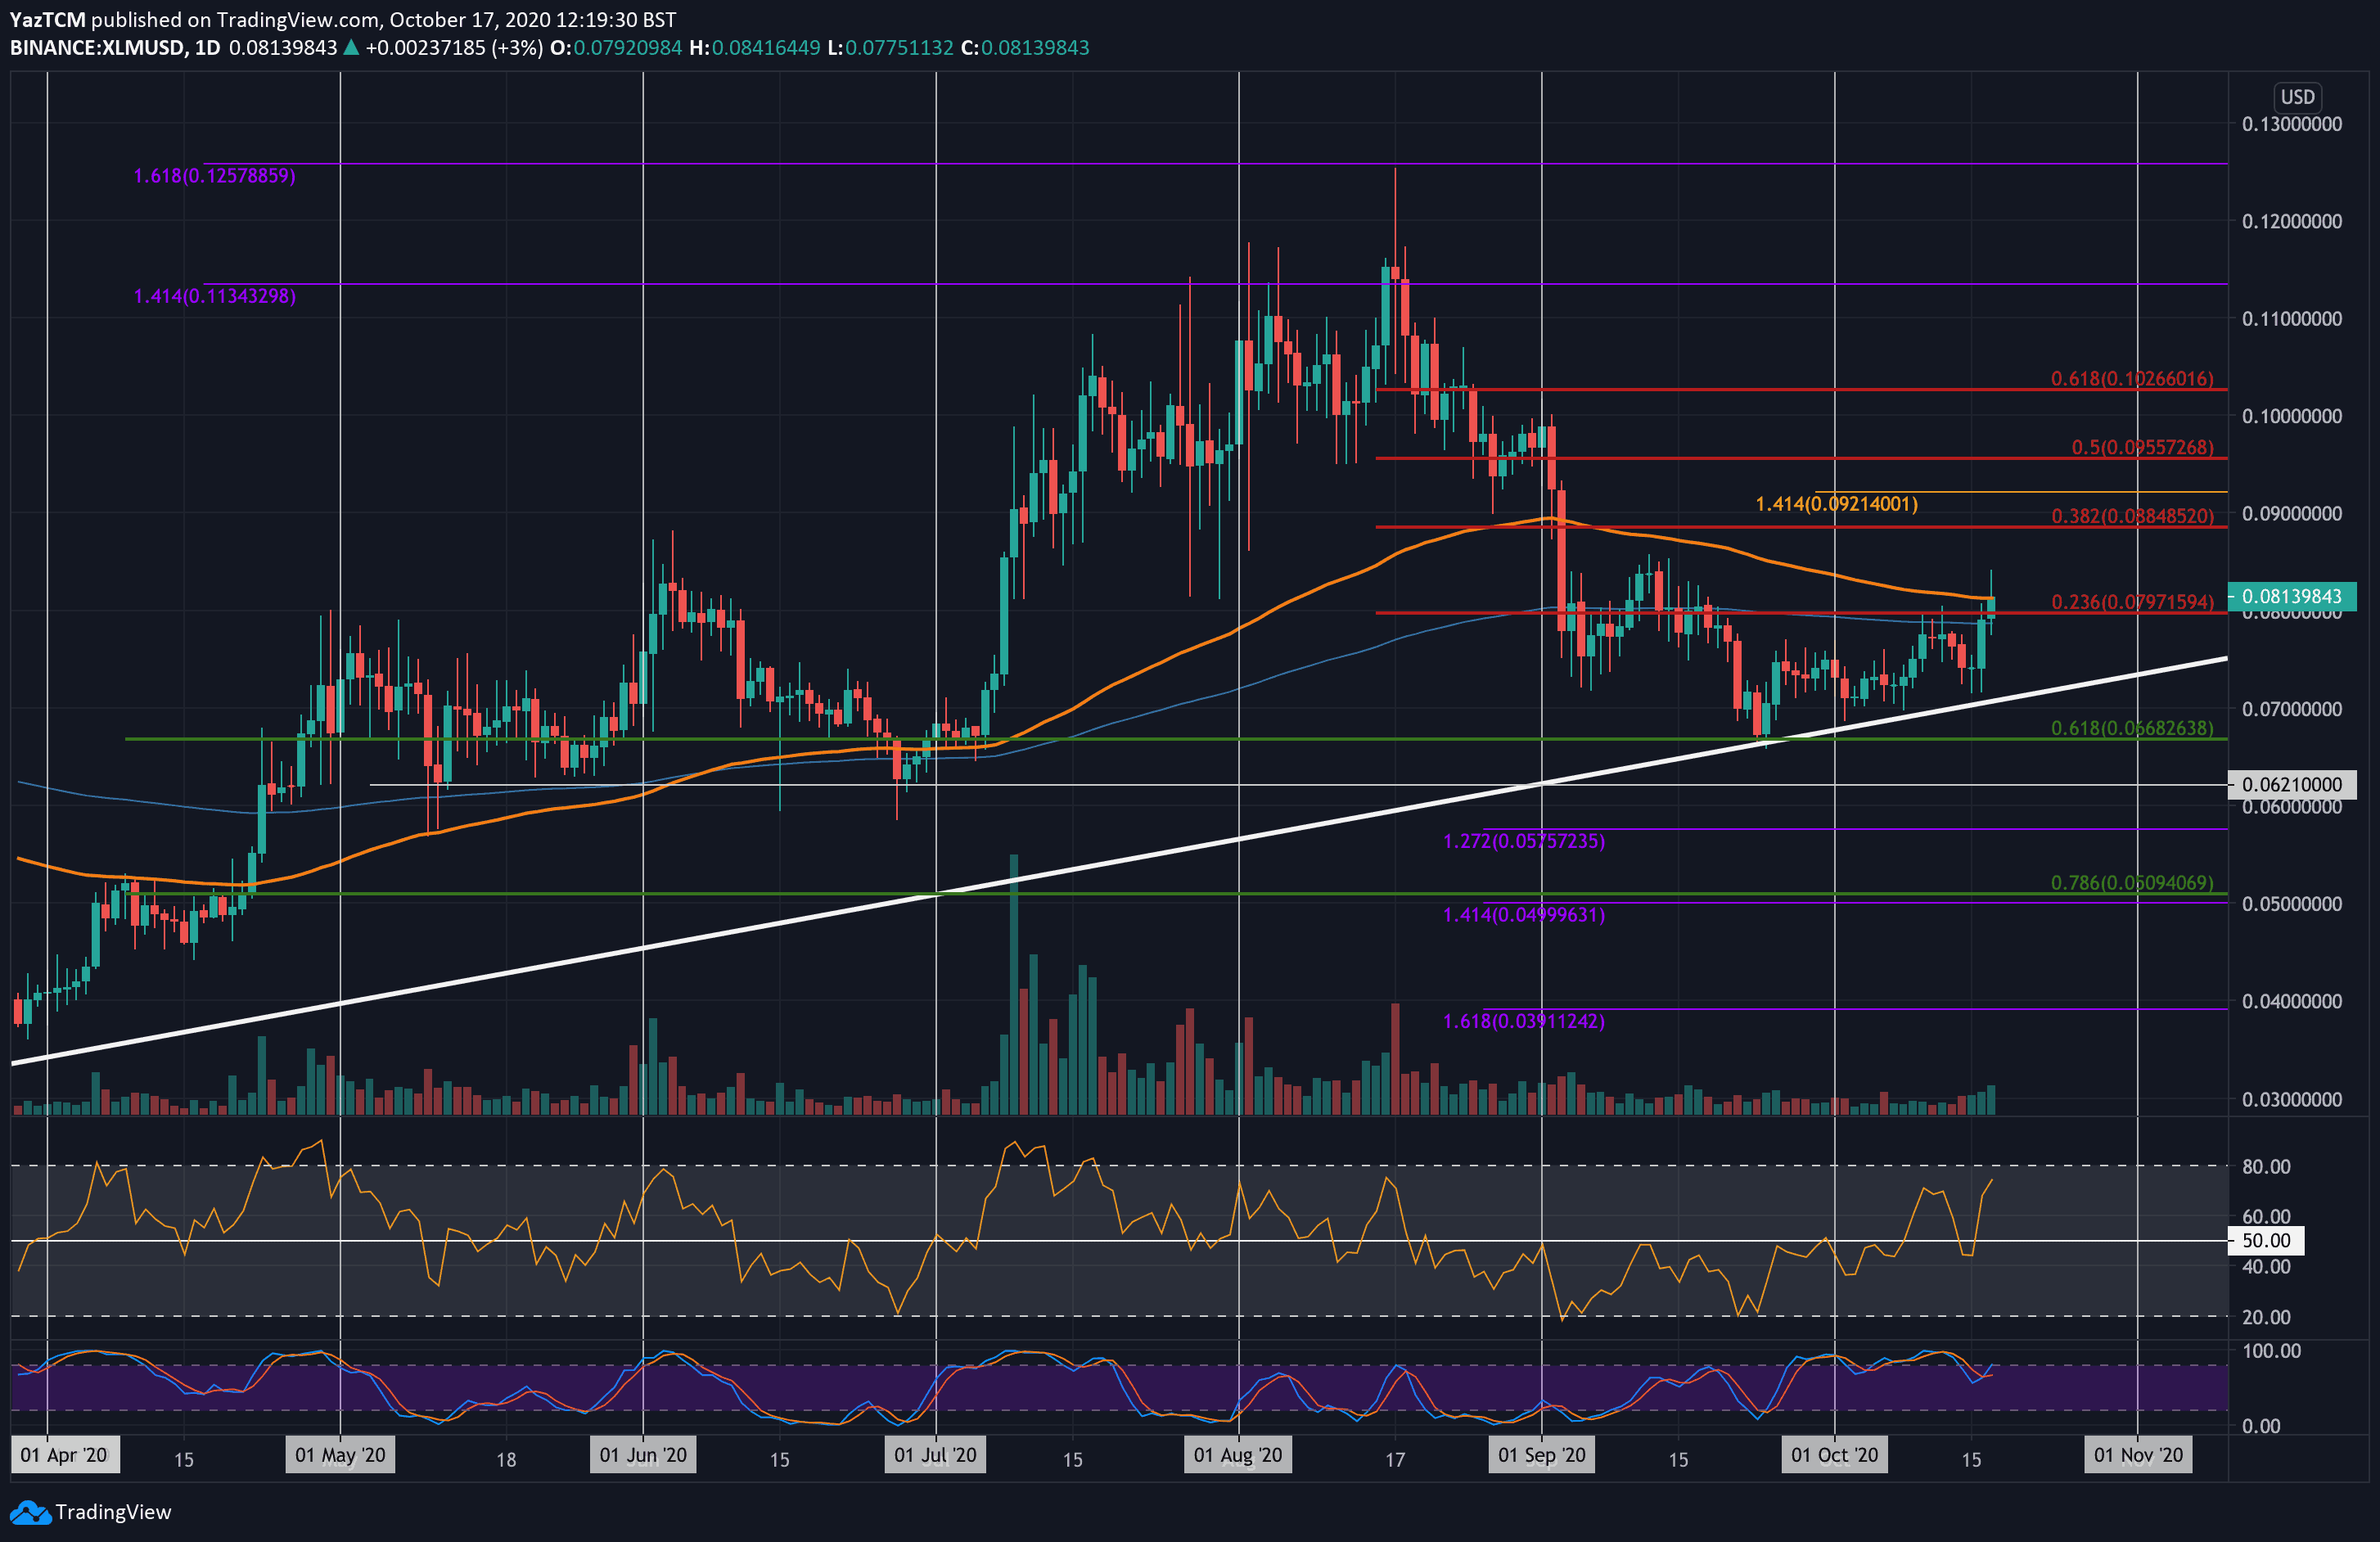
XLM/USD – Bulls Rebound Into 100-days EMA.
Key Support Levels: $0.08, $0.075, $0.07.
Key Resistance Levels: $0.086, $0.088, $0.0921.
XLM found support at the $0.0668 (.618 Fib) level toward the end of September which allowed the downtrend to reverse. Throughout October, the coin has slowly been grinding higher. Initially, it struggled to break the resistance at $0.08, which is provided by the bearish .236 Fib Retracement level.
This aforementioned resistance was penetrated today as XLM pushed higher to reach the current resistance at the 100-days EMA around $0.0814. XLM will need to break above this level to start a short-term bullish trend.
XLM-USD Short Term Price Prediction
Looking ahead, if the buyers can break the 100-days EMA level, the first level of resistance lies at $0.086. This is followed by resistance at $0.088 (bearish .382 Fib Retracement), $0.0921 (1.414 Fib Extension), and $0.0955 (bearish .5 Fib Retracement).
On the other side, if the sellers push lower, the first level of support lies at $0.08 (200-days EMA). Beneath this, support is located at $0.075, the 6-month-old rising trend line, $0.07, and $0.0688 (.618 Fib Retracement).
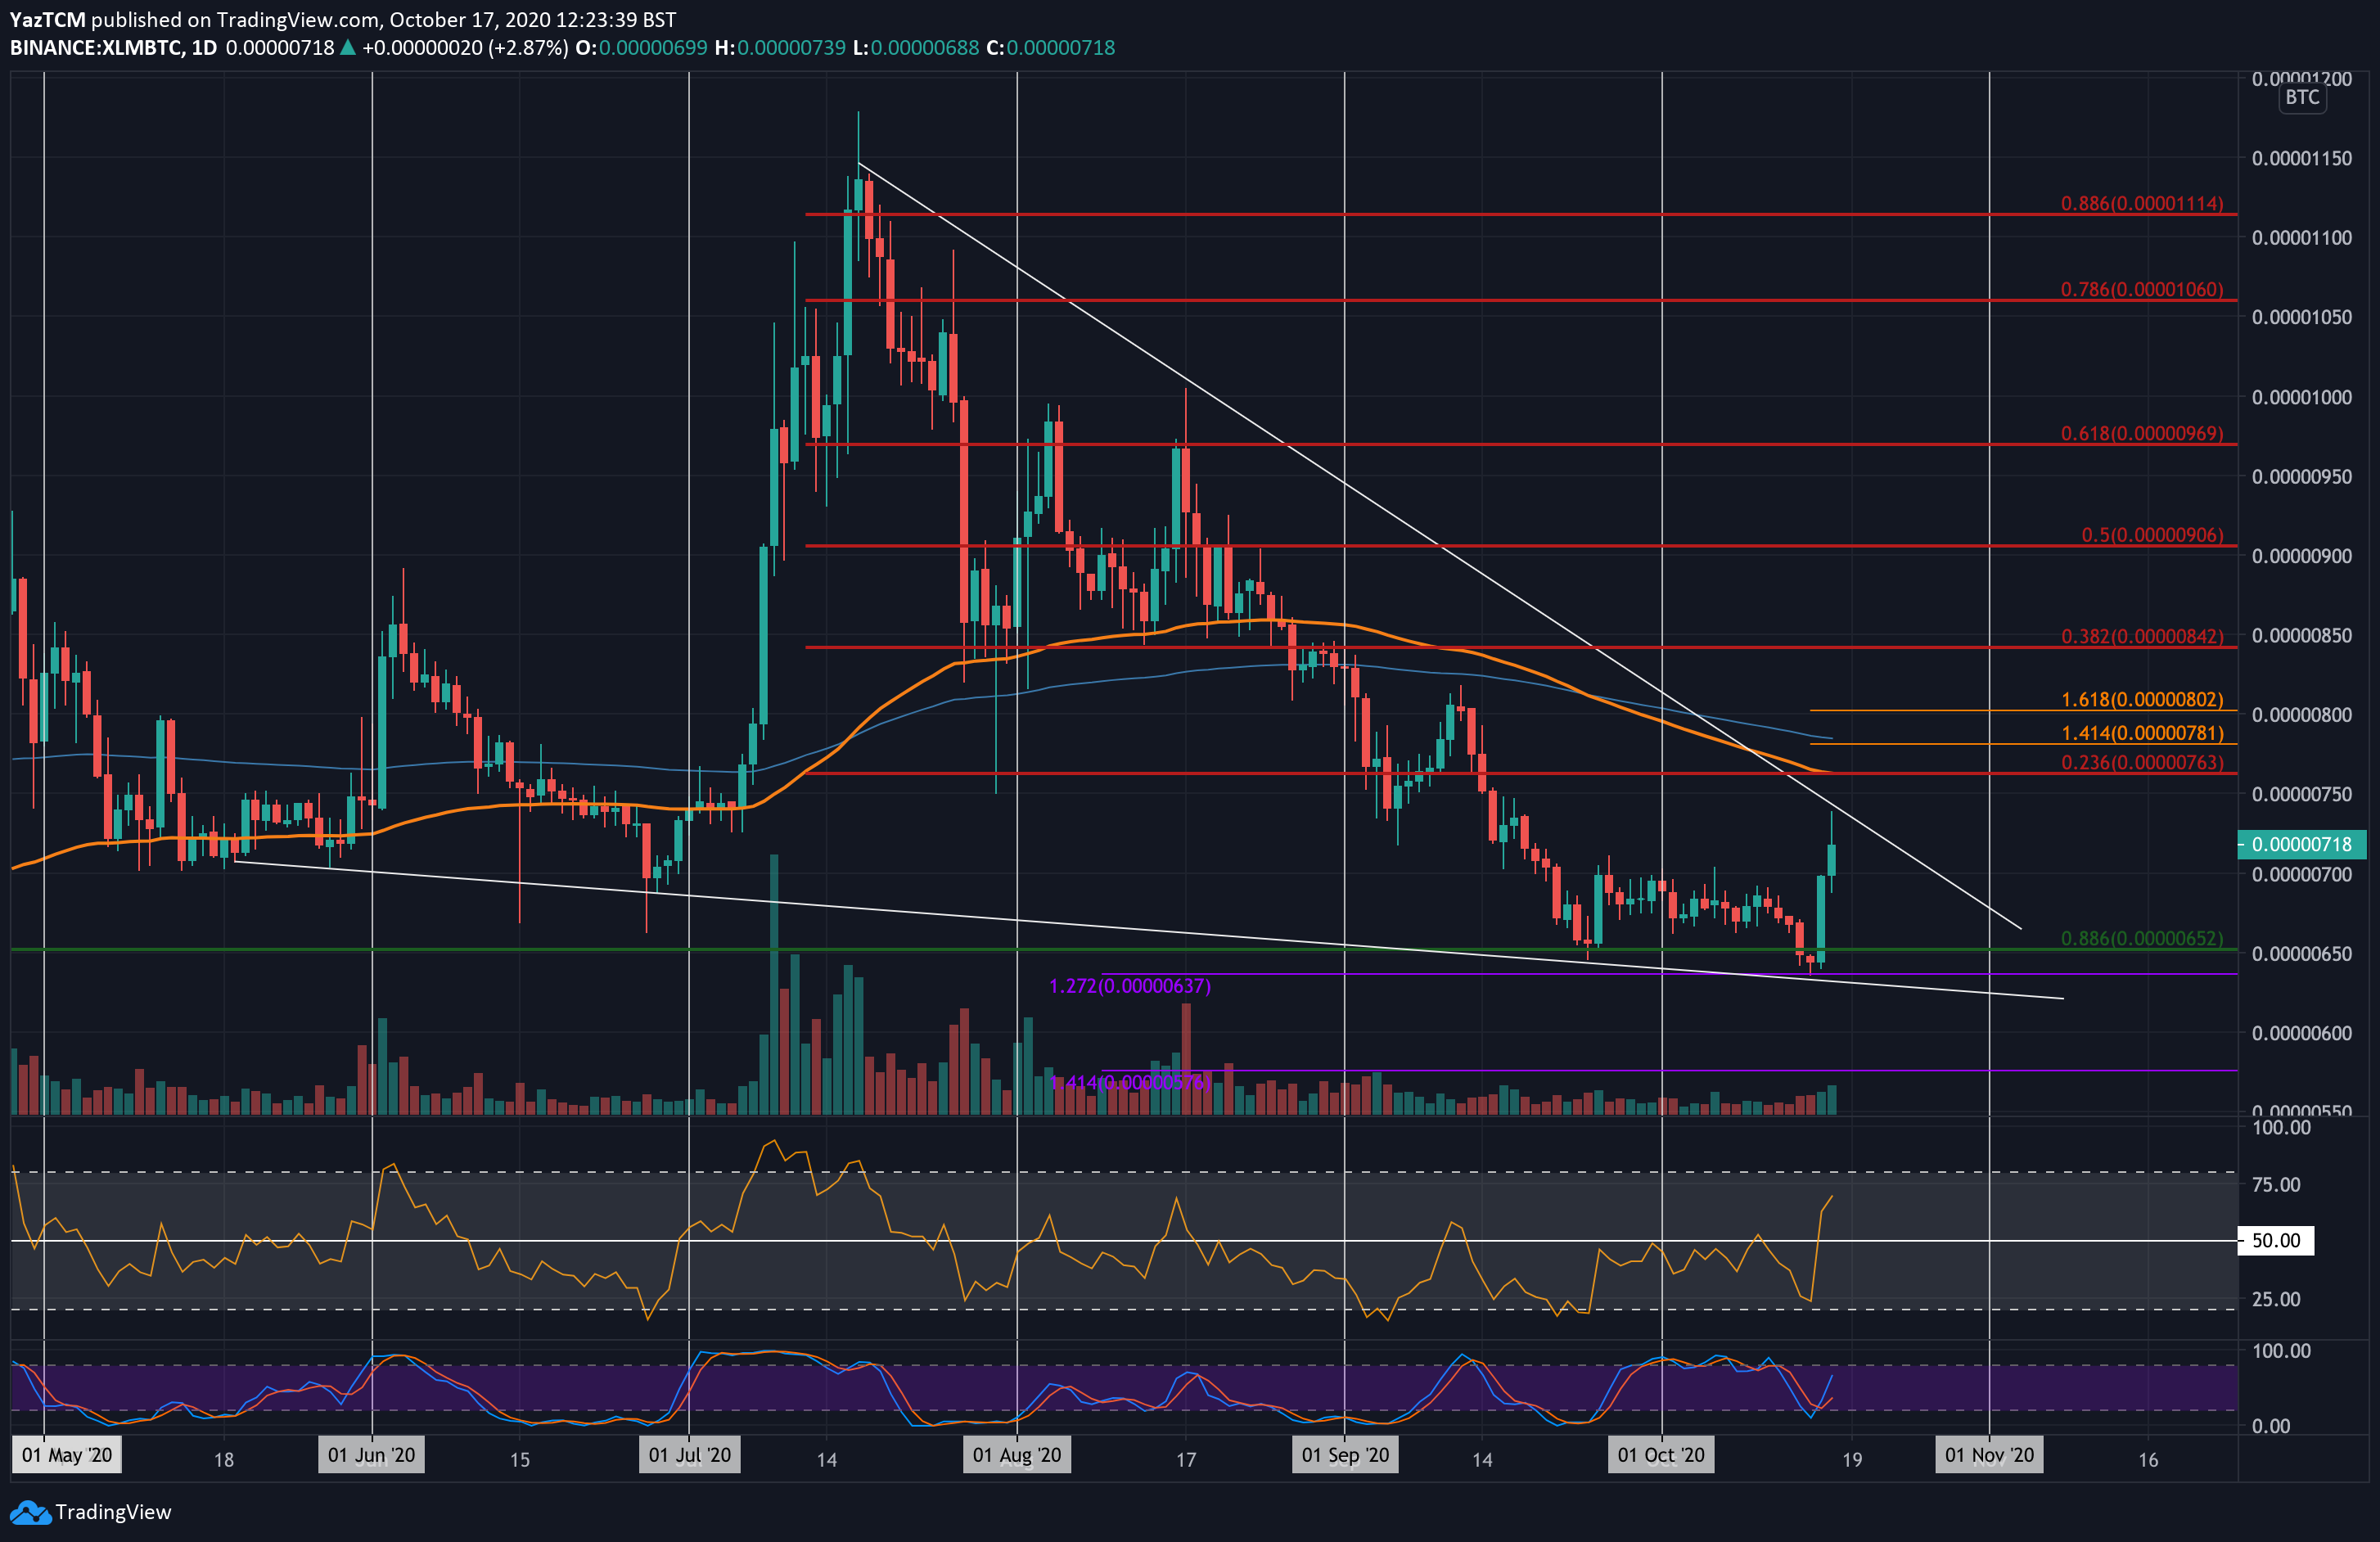
XLM/BTC – Bulls Rebound From Lower Boundary Of Falling Wedge.
Key Support Levels: 700 SAT, 650 SAT, 637 SAT.
Key Resistance Levels: 763 SAT, 781 SAT, 800 SAT.
Against Bitcoin, XLM has been trapped within a falling wedge for the past four months. The cryptocurrency recently rebounded from the support at 637 SAT(downside 1.272 Fib Extension) as it pushed higher to reach the current 718 SAT level.
XLM is now facing resistance at the upper boundary of this falling wedge and must penetrate above here to start a bullish push toward the 100-day & 200-days EMA levels.
XLM-BTC Short Term Price Prediction
Looking ahead, if the bulls break the upper boundary of the wedge, the first level of resistance lies at 763 (bearish .236 Fib Retracement & 100-days EMA). Above this, resistance lies at 781 SAT (200-days EMA), 800 SAT (1.618 Fib Extension), and 842 SAT (bearish .382 Fib Retracement).
On the other side, the first level of support lies at 700 SAT. Beneath this, support is expected at 650 SAT, 637 SAT, and 600 SAT.
The Stochastic RSI produced a bullish crossover signal in oversold conditions which is a strong bullish sign.