XRP/USD – Bulls Finally Break 100-days EMA ResistanceKey Support Levels: %excerpt%.243, %excerpt%.237, %excerpt%.228.Key Resistance Levels: %excerpt%.251, %excerpt%.26, %excerpt%.271.XRP found support at the %excerpt%.23 level at the start of October. It rebounded from this support yesterday to finally push higher above the resistance at the 100-days EMA – a level which the coin struggled with throughout last week.After breaking the 100-days EMA, XRP climbed into the resistance at %excerpt%.251 – provided by a bearish .382 Fib Retracement. The psychological round number of %excerpt%.25 further bolsters the area. The following 4HR chart shows how XRP is now trying to breach this level.XRP/USD 4HR Chart. Source: TradingViewXRP-USD Short Term Price PredictionXRP/USD Daily Chart. Source: TradingViewLooking ahead, if the buyers manage to break %excerpt%.251,
Topics:
Yaz Sheikh considers the following as important: Ripple (XRP) Price, XRP Analysis, xrpbtc, xrpusd
This could be interesting, too:
Jordan Lyanchev writes Ripple’s (XRP) Surge to Triggers Over Million in Short Liquidations
Jordan Lyanchev writes Trump Confirms Work on Strategic Crypto Reserve: XRP, ADA, SOL Included
Dimitar Dzhondzhorov writes Is a Major Ripple v. SEC Lawsuit Development Expected This Week? Here’s Why
Mandy Williams writes Ripple Releases Institutional DeFi Roadmap for XRP Ledger in 2025
XRP/USD – Bulls Finally Break 100-days EMA Resistance
Key Support Levels: $0.243, $0.237, $0.228.
Key Resistance Levels: $0.251, $0.26, $0.271.
XRP found support at the $0.23 level at the start of October. It rebounded from this support yesterday to finally push higher above the resistance at the 100-days EMA – a level which the coin struggled with throughout last week.
After breaking the 100-days EMA, XRP climbed into the resistance at $0.251 – provided by a bearish .382 Fib Retracement. The psychological round number of $0.25 further bolsters the area. The following 4HR chart shows how XRP is now trying to breach this level.
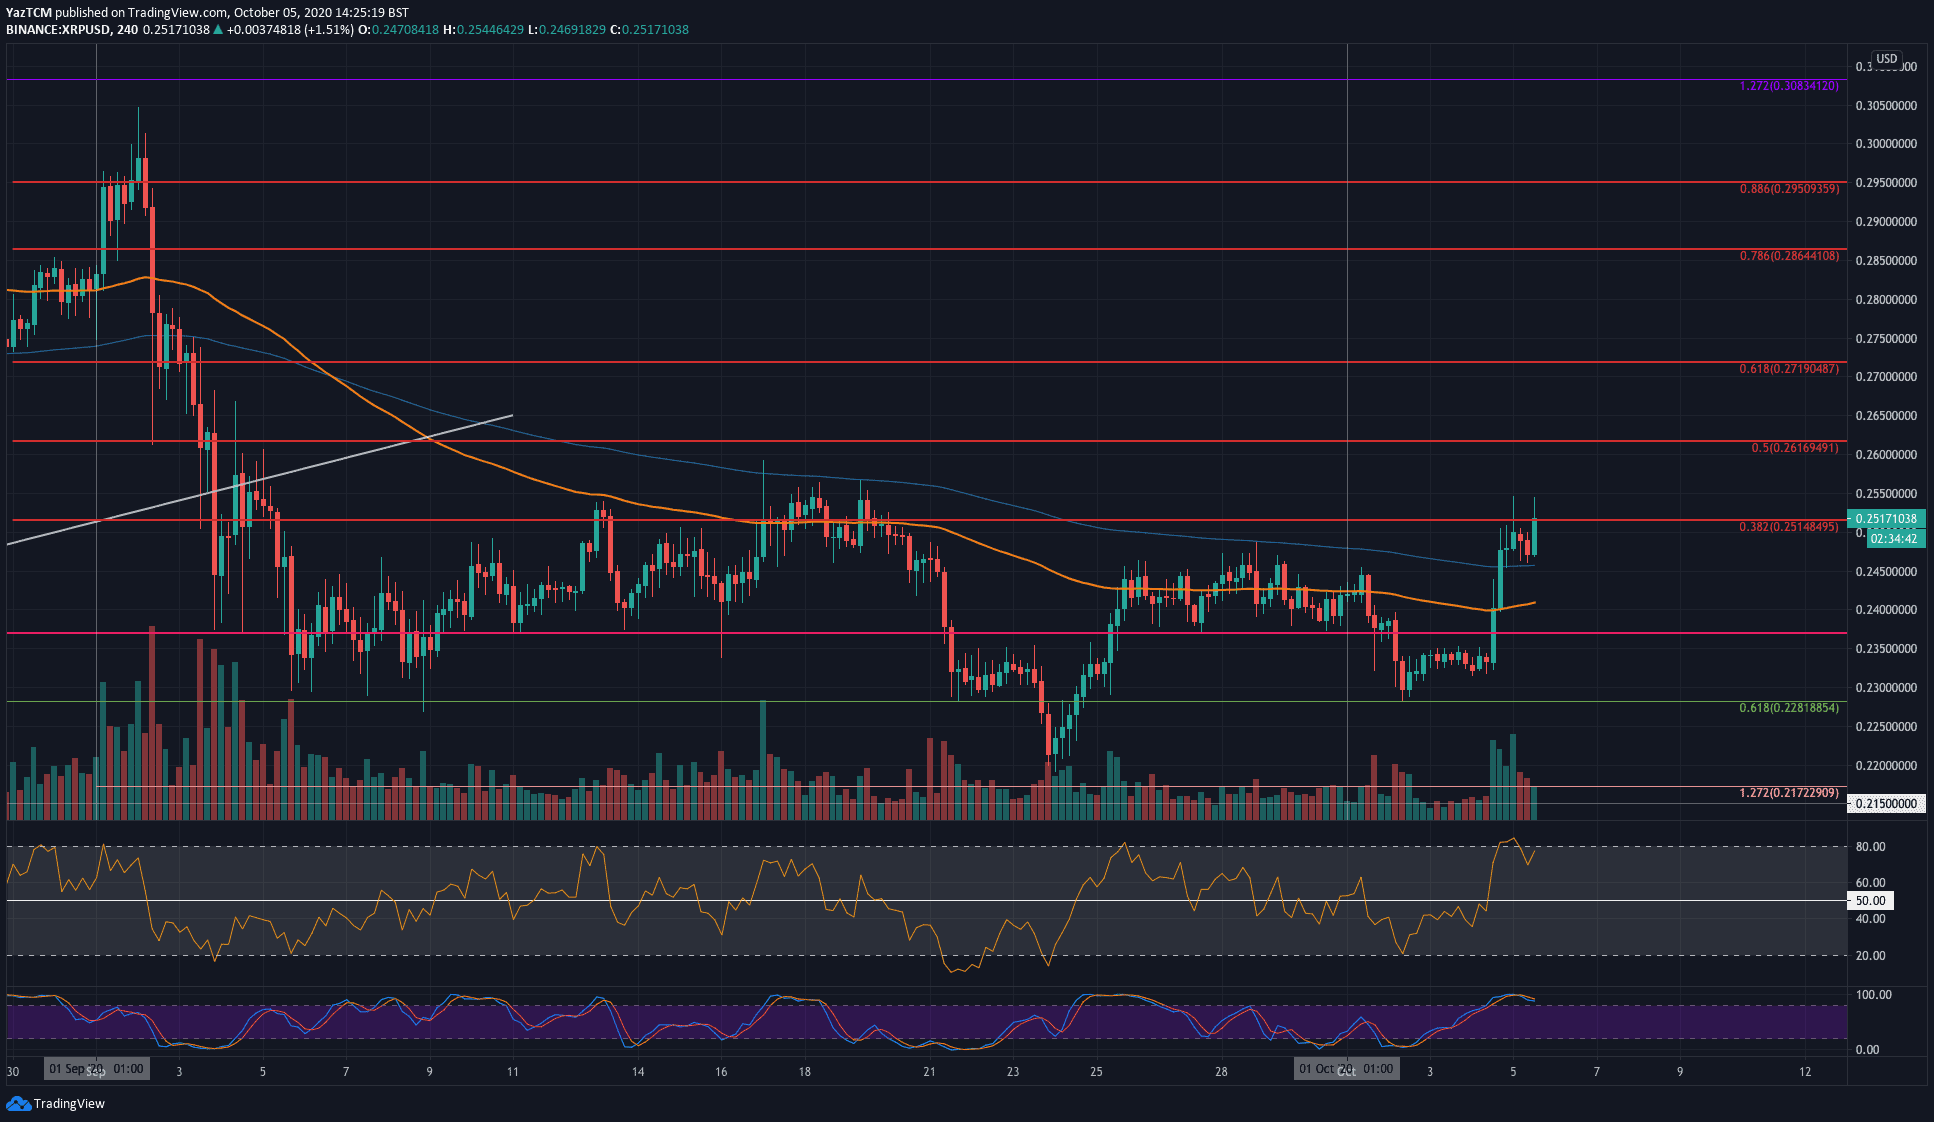
XRP-USD Short Term Price Prediction
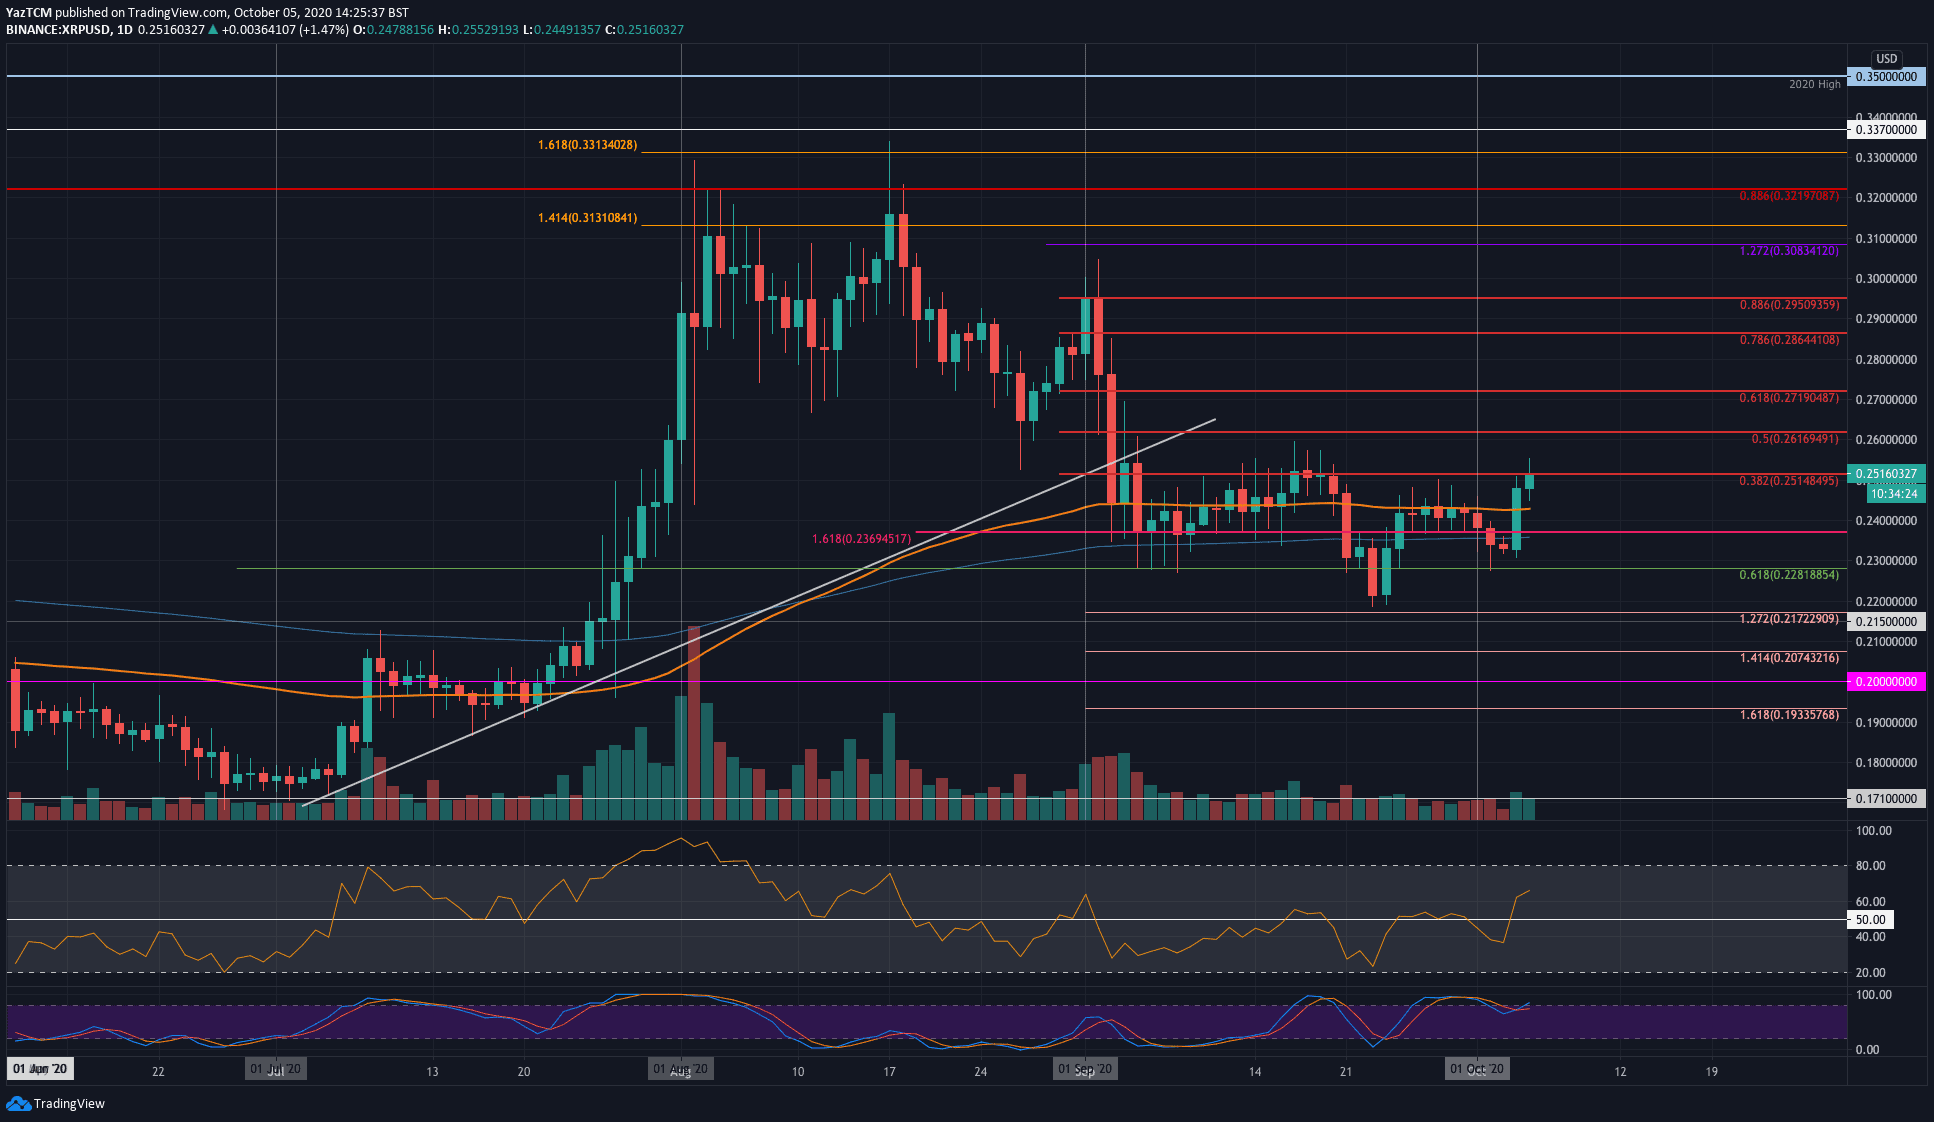
Looking ahead, if the buyers manage to break $0.251, higher resistance lies at $0.26 (bearish .5 Fib), $0.271, and $0.28.
On the other side, the first level of support lies at the 100-days EMA at $0.243. Beneath this, support is located at $0.237 (200-days EMA), $0.228 (.618 Fib), and $0.22.
XRP/BTC – Buyers Break 2-Month-Old Falling Trend Line
Key Support Levels: 2300 SAT, 2250 SAT, 2200 SAT.
Key Resistance Levels: 2350 SAT, 2400 SAT, 2465 SAT.
XRP is also performing well against Bitcoin after it bounced from 2200 SAT yesterday to break above a 2-month-old falling trend line and reach the resistance at 2350 SAT (bearish .5 Fib Retracement). The following 4HR chart shows the reaction at this level.
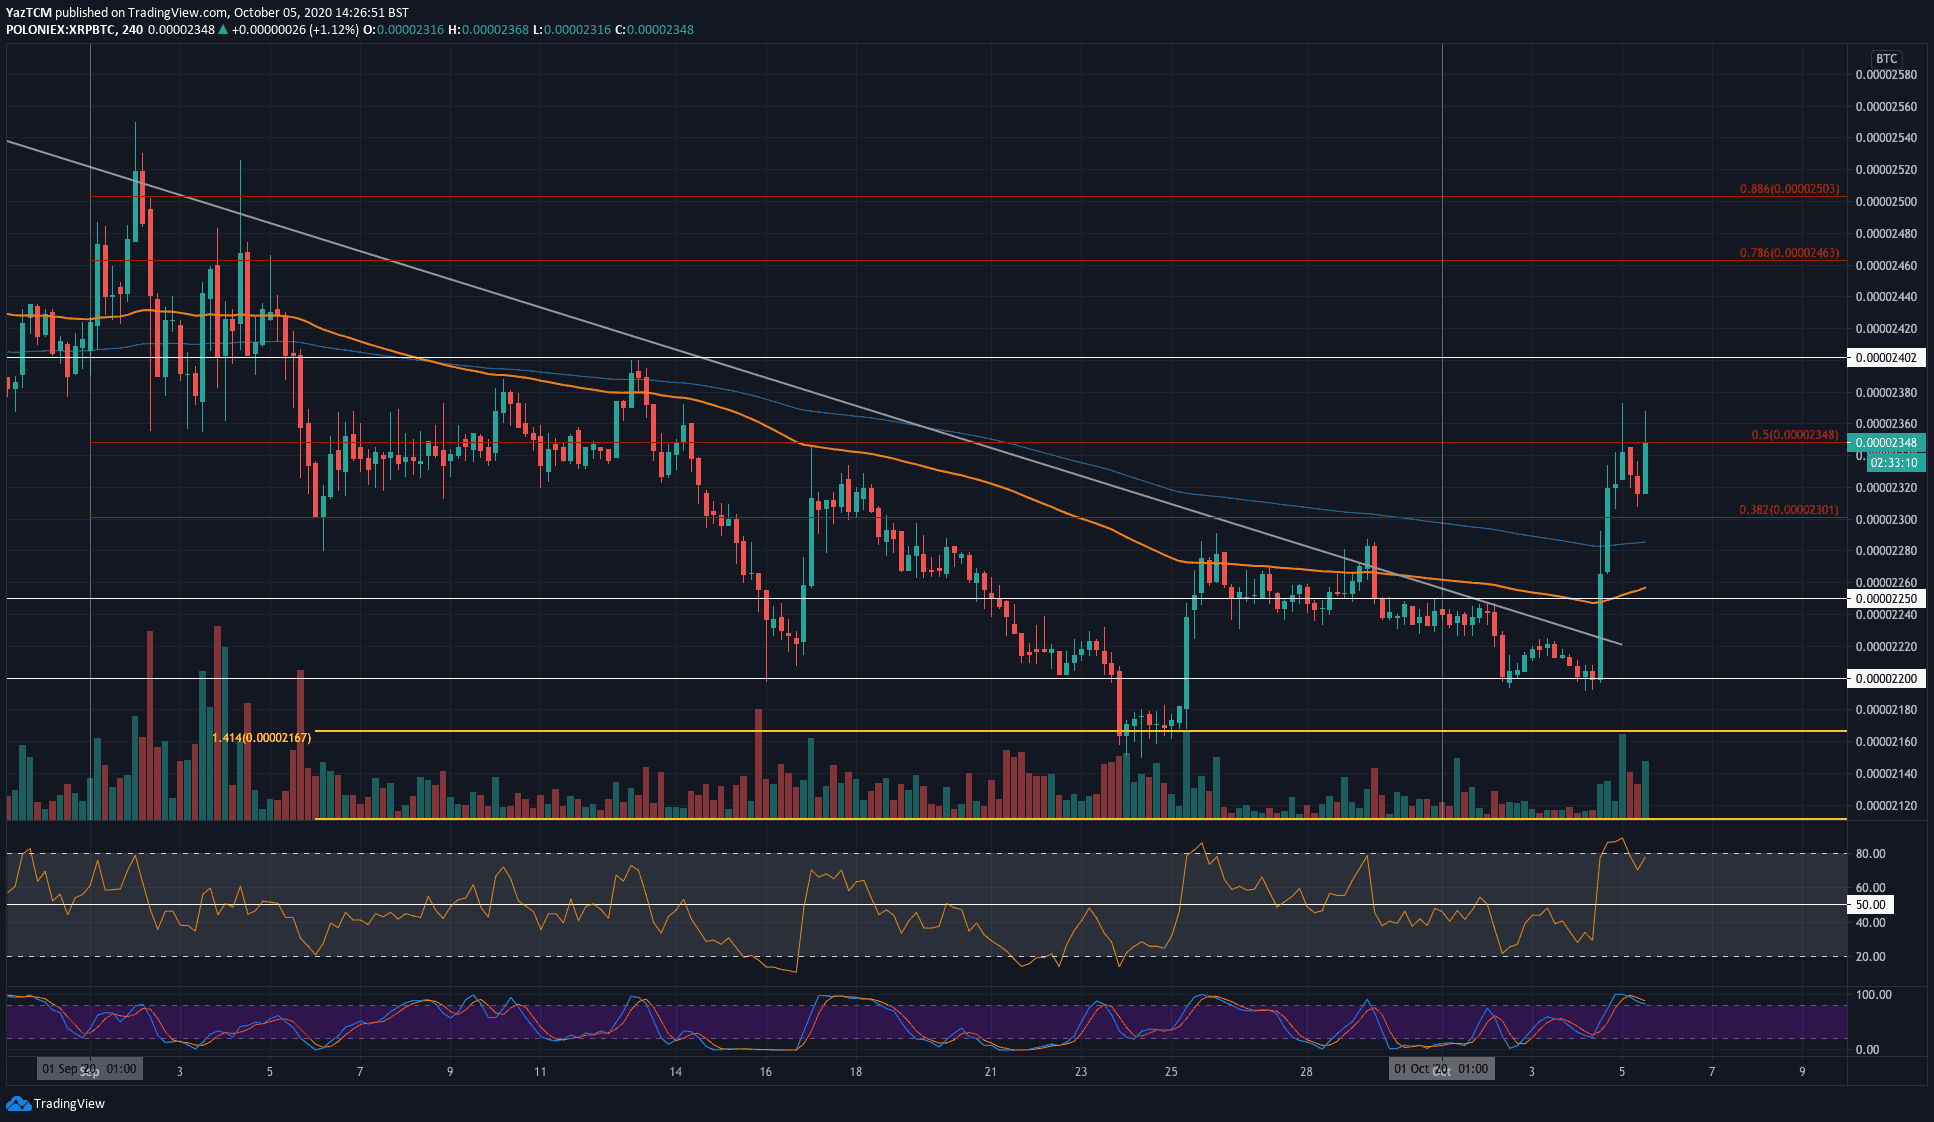
XRP is now supported by the 100-days EMA at around 2300 SAT after recently bouncing from here.
XRP-BTC Short Term Price Prediction
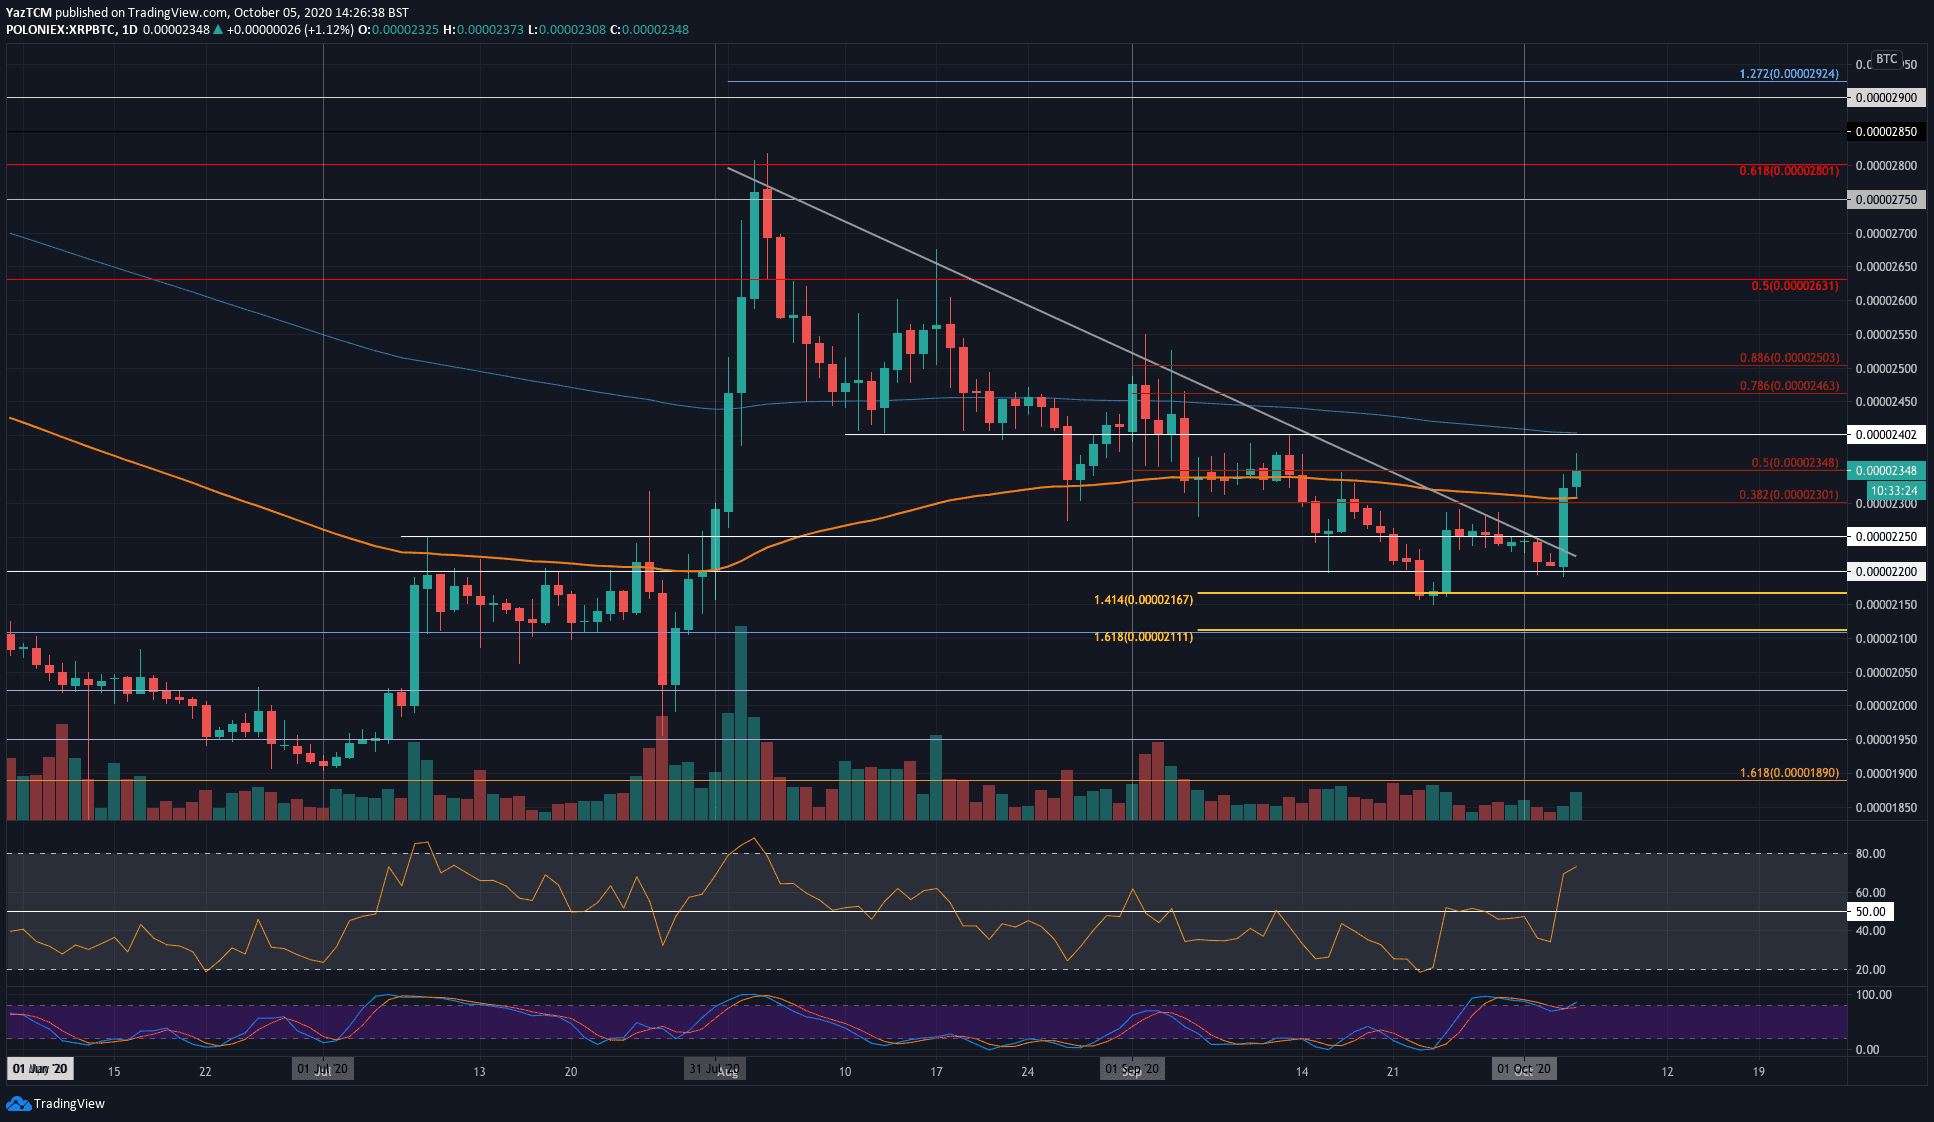
Looking ahead, if the bulls can break the resistance at 2350 SAT, additional resistance lies at 2400 SAT (200-days EMA), 2465 SAT (bearish .786 Fib), and 2500 SAT (bearish .886 Fib).
On the other side, the first level of support lies at 2300 SAT (100-days EMA). Beneath this, support lies at 2250 SAT, 2200 SAT, and 2170 SAT.
The RSI is above the mid-line to indicate the bulls have taken charge of the market momentum after an entire month of bearish control.