Key Support level: %excerpt%.000044; %excerpt%.000032 Key Resistance level: %excerpt%.000055; %excerpt%.000063 SHIB’s recovery from the drop last week was impressive, but bulls failed to push the price above the key resistance at %excerpt%.000063, and bears took control again, pushing it under %excerpt%.000055, which now also acts as resistance. This leaves SHIB with the support found at %excerpt%.000044. If the bulls fail to step up soon, a retest of the support becomes likely. Failure to hold there and the next support will be found at %excerpt%.000032. Chart by TradingViewTechnical Indicators of SHIB Price Trading Volume: The volume on the bounce from support was very strong, unlike the current decline. This is usually bullish, but it’s too early to tell as bears can always return in force to take price back on support. RSI:
Topics:
Duo Nine considers the following as important: Price Analysis, Shiba Inu (SHIB), SHIBBTC, SHIBUSD
This could be interesting, too:
Jordan Lyanchev writes Shiba Inu Price Forecasts: Another 50% Crash or 420% Rally Ahead for SHIB?
Dimitar Dzhondzhorov writes This Trader Made Over Million by Selling Shiba Inu (SHIB) Holdings: Details
Dimitar Dzhondzhorov writes Shiba Inu (SHIB) Drops by 15% in 2 Weeks: These Factors Suggest Extended Correction
Jordan Lyanchev writes Meme Coin Bloodbath: BONK, FLOKI, WIF, SHIB, and DOGE Crash by Double Digits
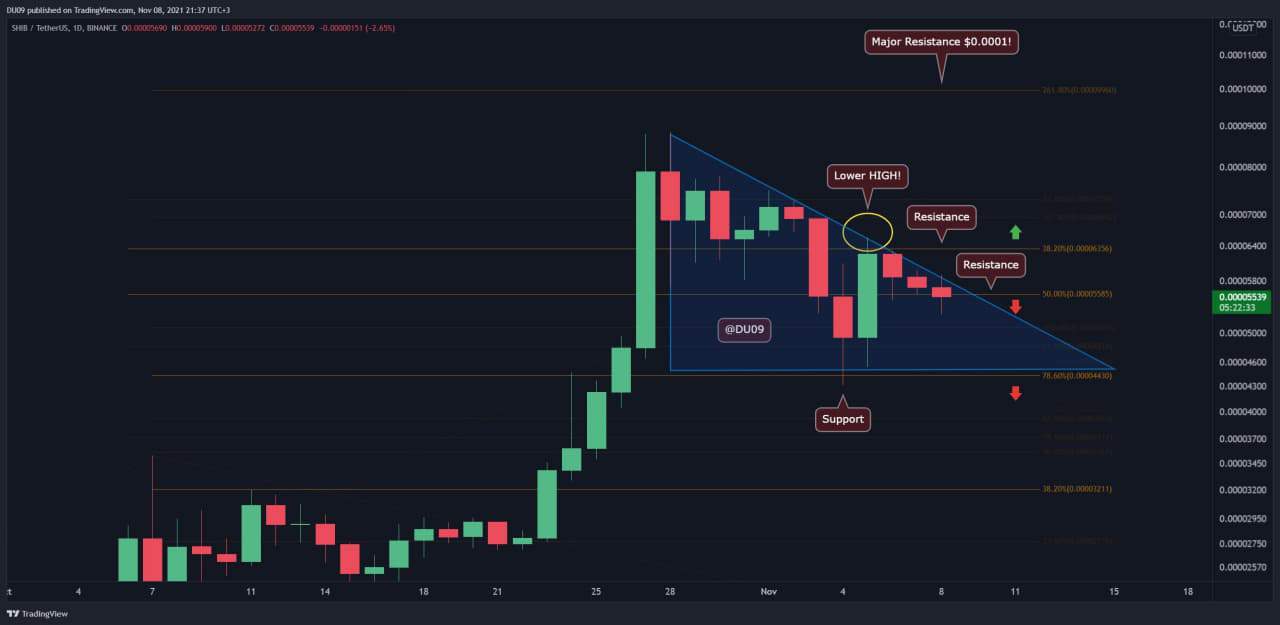
Key Support level: $0.000044; $0.000032
Key Resistance level: $0.000055; $0.000063
SHIB’s recovery from the drop last week was impressive, but bulls failed to push the price above the key resistance at $0.000063, and bears took control again, pushing it under $0.000055, which now also acts as resistance.
This leaves SHIB with the support found at $0.000044. If the bulls fail to step up soon, a retest of the support becomes likely. Failure to hold there and the next support will be found at $0.000032.

Technical Indicators of SHIB Price
Trading Volume: The volume on the bounce from support was very strong, unlike the current decline. This is usually bullish, but it’s too early to tell as bears can always return in force to take price back on support.
RSI: RSI continues to fall and makes lower highs. Another lower low and the bearish trend can continue for some time until bulls take back control.
MACD: The MACD on the daily timeframe remains bearish and continues to fall. This cross was highlighted in our previous analysis. To date, this signal was correct, and the SHIB price is currently falling. It is unlikely this trend will change until MACD on daily gives bullish signs. Right now, both the histogram and moving averages are firmly on the bearish side and accelerating down.
Bias
The bias is bearish because bulls have failed to break above the resistance and the daily MACD gives no signs of any positivity. This can be reassessed if SHIB manages to break from the current resistance level.
Short-Term Prediction for SHIB Price
Considering the price action of today, SHIB is more likely to retest the support at $0.000044 than to hope for another rally. As such, traders should be patient before considering an entry as SHIB may provide a better price close to support where, last time, bulls came back in force. Any long entries now can be assessed as high risk.