Key Support level: %excerpt%.000047 Key Resistance level: %excerpt%.000054 SHIB’s bullish momentum has vanished and now the coin seems to be back to reality – a point that we discussed in the last analysis. After SHIB broke below the descending triangle in blue, the selloff started and has not faded one bit since. It’s another day of major losses for SHIB holders as the coin drops a further 20%. The exit sign was given when the bottom of the triangle became resistance after being support in the past. As such, the new resistance at the time of this post is at %excerpt%.000054 and support at %excerpt%.000047. Chart by TradingViewTechnical Indicators of SHIB Price Trading Volume: Strong selloff on the breakdown below the triangle and volume remained formidable as the price dropped. This is bearish and
Topics:
Duo Nine considers the following as important: Price Analysis, Shiba Inu (SHIB), SHIBBTC, SHIBUSD
This could be interesting, too:
Jordan Lyanchev writes Shiba Inu Price Forecasts: Another 50% Crash or 420% Rally Ahead for SHIB?
Dimitar Dzhondzhorov writes This Trader Made Over Million by Selling Shiba Inu (SHIB) Holdings: Details
Dimitar Dzhondzhorov writes Shiba Inu (SHIB) Drops by 15% in 2 Weeks: These Factors Suggest Extended Correction
Jordan Lyanchev writes Meme Coin Bloodbath: BONK, FLOKI, WIF, SHIB, and DOGE Crash by Double Digits
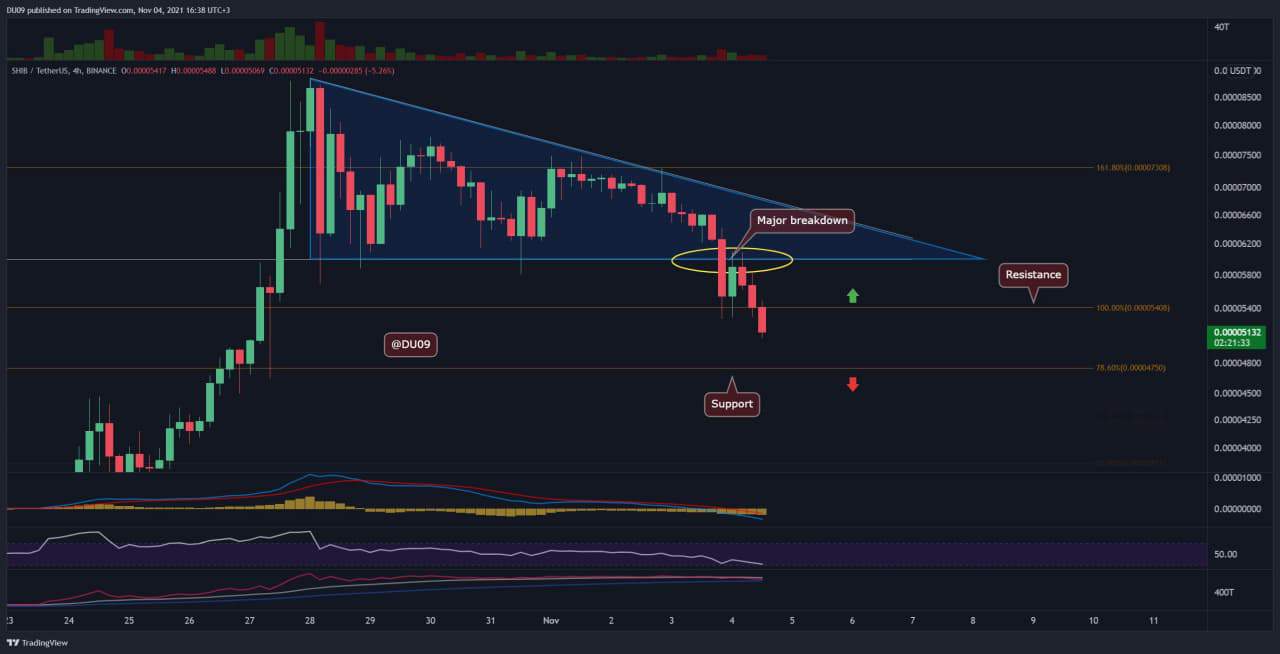
Key Support level: $0.000047
Key Resistance level: $0.000054
SHIB’s bullish momentum has vanished and now the coin seems to be back to reality – a point that we discussed in the last analysis.
After SHIB broke below the descending triangle in blue, the selloff started and has not faded one bit since. It’s another day of major losses for SHIB holders as the coin drops a further 20%. The exit sign was given when the bottom of the triangle became resistance after being support in the past. As such, the new resistance at the time of this post is at $0.000054 and support at $0.000047.

Technical Indicators of SHIB Price
Trading Volume: Strong selloff on the breakdown below the triangle and volume remained formidable as the price dropped. This is bearish and unlikely to stop until SHIB finds new support.
RSI: The RSI is in free fall and approaches the oversold area on the 4-hour timeframe. SHIB might fall more before a reversal signal can appear.
MACD: Unfortunately, the MACD on the daily timeframe has crossed to the negative side. This is a major bearish signal that was discussed in the previous SHIB analysis as the most likely scenario should price fall below the triangle. Now that price is here, it’s possible for SHIB to decline for some time or in the best case scenario, to consolidate above support.
Bias
The bias is very bearish at this time. There are no signs on the chart to indicate a reversal or bullish price action. At best, a bounce can take place before the downtrend resumes.
Short-Term Prediction for SHIB Price
The most important question for SHIB right now is where it will find support because confidence in any immediate support levels is low, apart from $0.000030 which is 40% below the current price. This is because, on the way up, there was very little price action between $0.000030 and $0.000060.
Hence there is a lot of air between these levels. Therefore, in the worst-case scenario, seeing SHIB just above $0.000030 should not surprise anyone. However, in a more optimistic scenario, SHIB may find support on $0.000047 or just below that.