Key Support level: %excerpt%.000048; %excerpt%.000044 Key Resistance level: : %excerpt%.000055; %excerpt%.000062 Two days ago, we hinted that SHIB might be preparing for a bull run. Yesterday, this was confirmed when the cryptocurrency broke above the descending wedge (in blue, this is a bullish formation). With this breakout, the buyers flooded into SHIB, and volume spiked, taking the price all the way to %excerpt%.000054 at the time of this post. This is a 35% price increase in the span of a day. The key support can be found at %excerpt%.000044 and the next resistance at %excerpt%.000055. Considering the momentum behind SHIB, the price can quickly move past existing levels in its search for a new valuation. Chart by TradingViewTechnical Indicators Trading Volume: The volume exploded after the break above the wedge.
Topics:
Duo Nine considers the following as important: Price Analysis, Shiba Inu (SHIB), SHIBBTC, SHIBUSD
This could be interesting, too:
Jordan Lyanchev writes Shiba Inu Price Forecasts: Another 50% Crash or 420% Rally Ahead for SHIB?
Dimitar Dzhondzhorov writes This Trader Made Over Million by Selling Shiba Inu (SHIB) Holdings: Details
Dimitar Dzhondzhorov writes Shiba Inu (SHIB) Drops by 15% in 2 Weeks: These Factors Suggest Extended Correction
Jordan Lyanchev writes Meme Coin Bloodbath: BONK, FLOKI, WIF, SHIB, and DOGE Crash by Double Digits
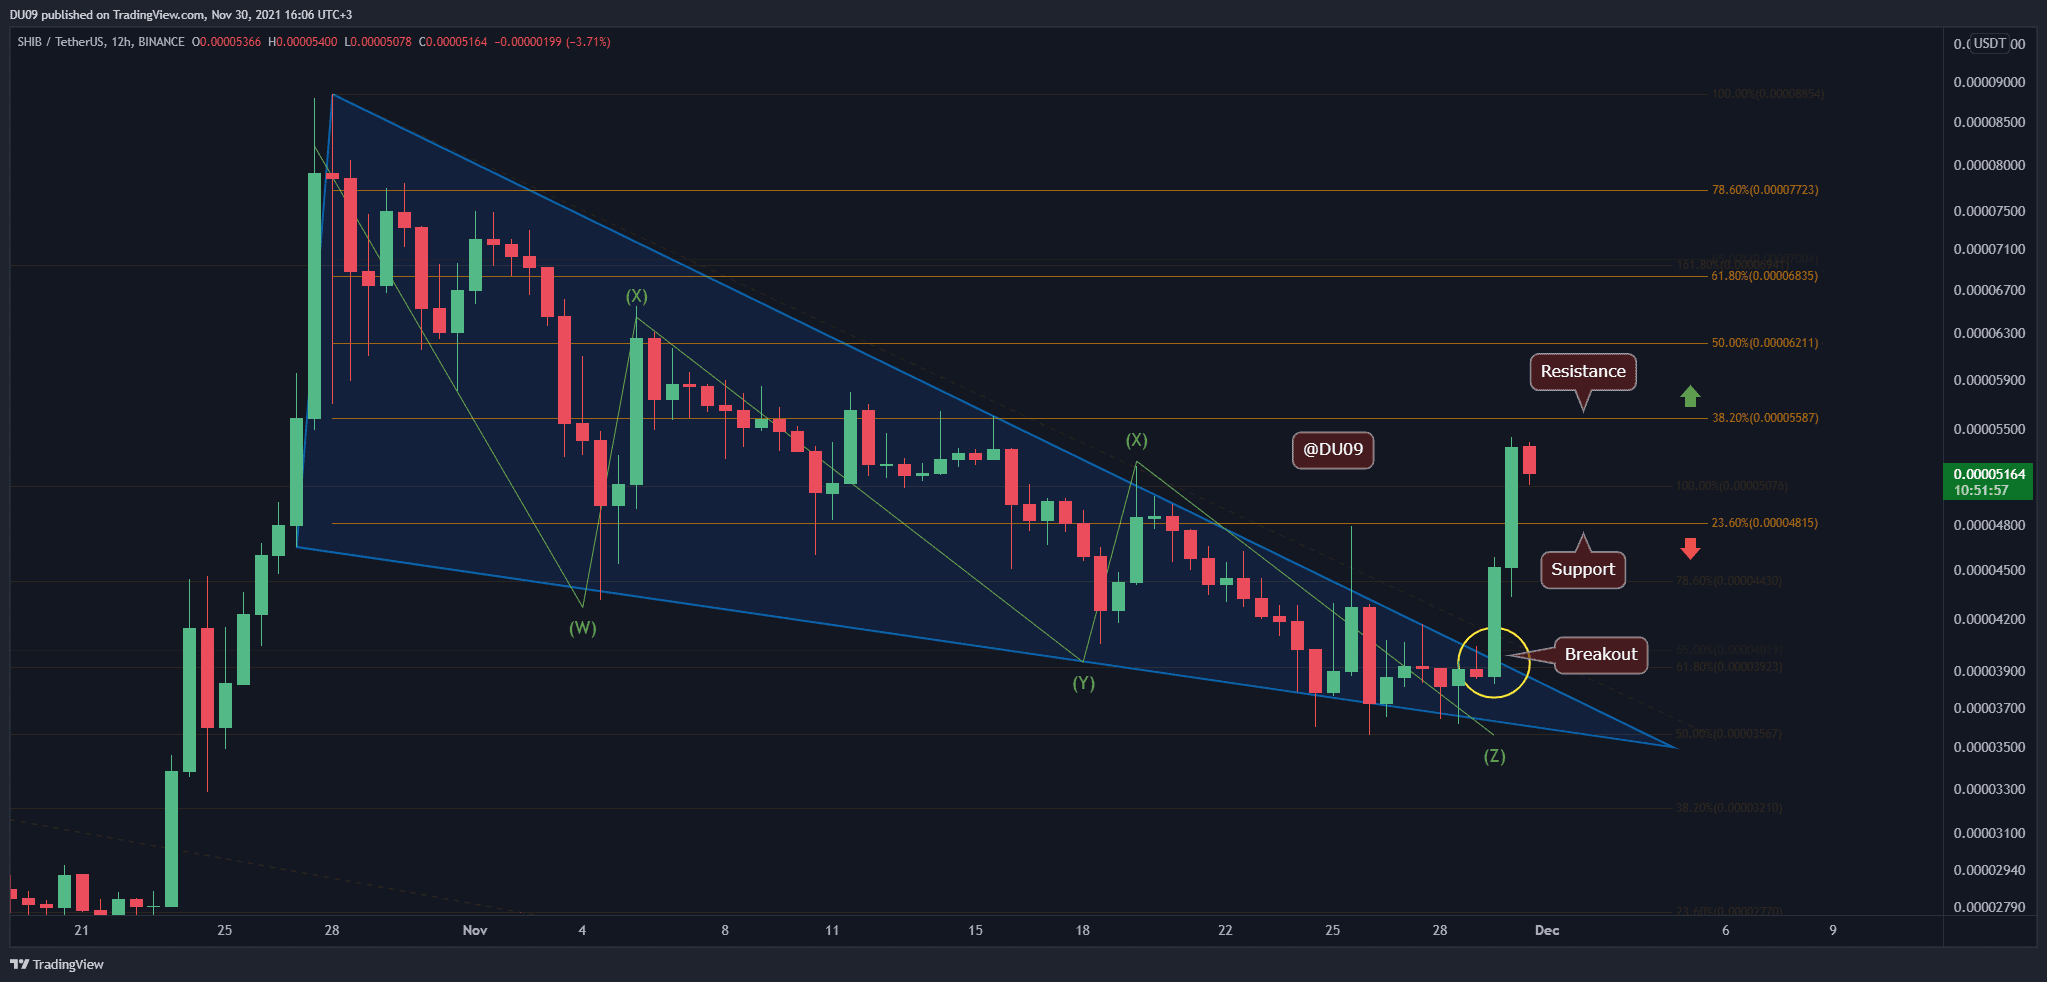
Key Support level: $0.000048; $0.000044
Key Resistance level: : $0.000055; $0.000062
Two days ago, we hinted that SHIB might be preparing for a bull run. Yesterday, this was confirmed when the cryptocurrency broke above the descending wedge (in blue, this is a bullish formation). With this breakout, the buyers flooded into SHIB, and volume spiked, taking the price all the way to $0.000054 at the time of this post. This is a 35% price increase in the span of a day.
The key support can be found at $0.000044 and the next resistance at $0.000055. Considering the momentum behind SHIB, the price can quickly move past existing levels in its search for a new valuation.
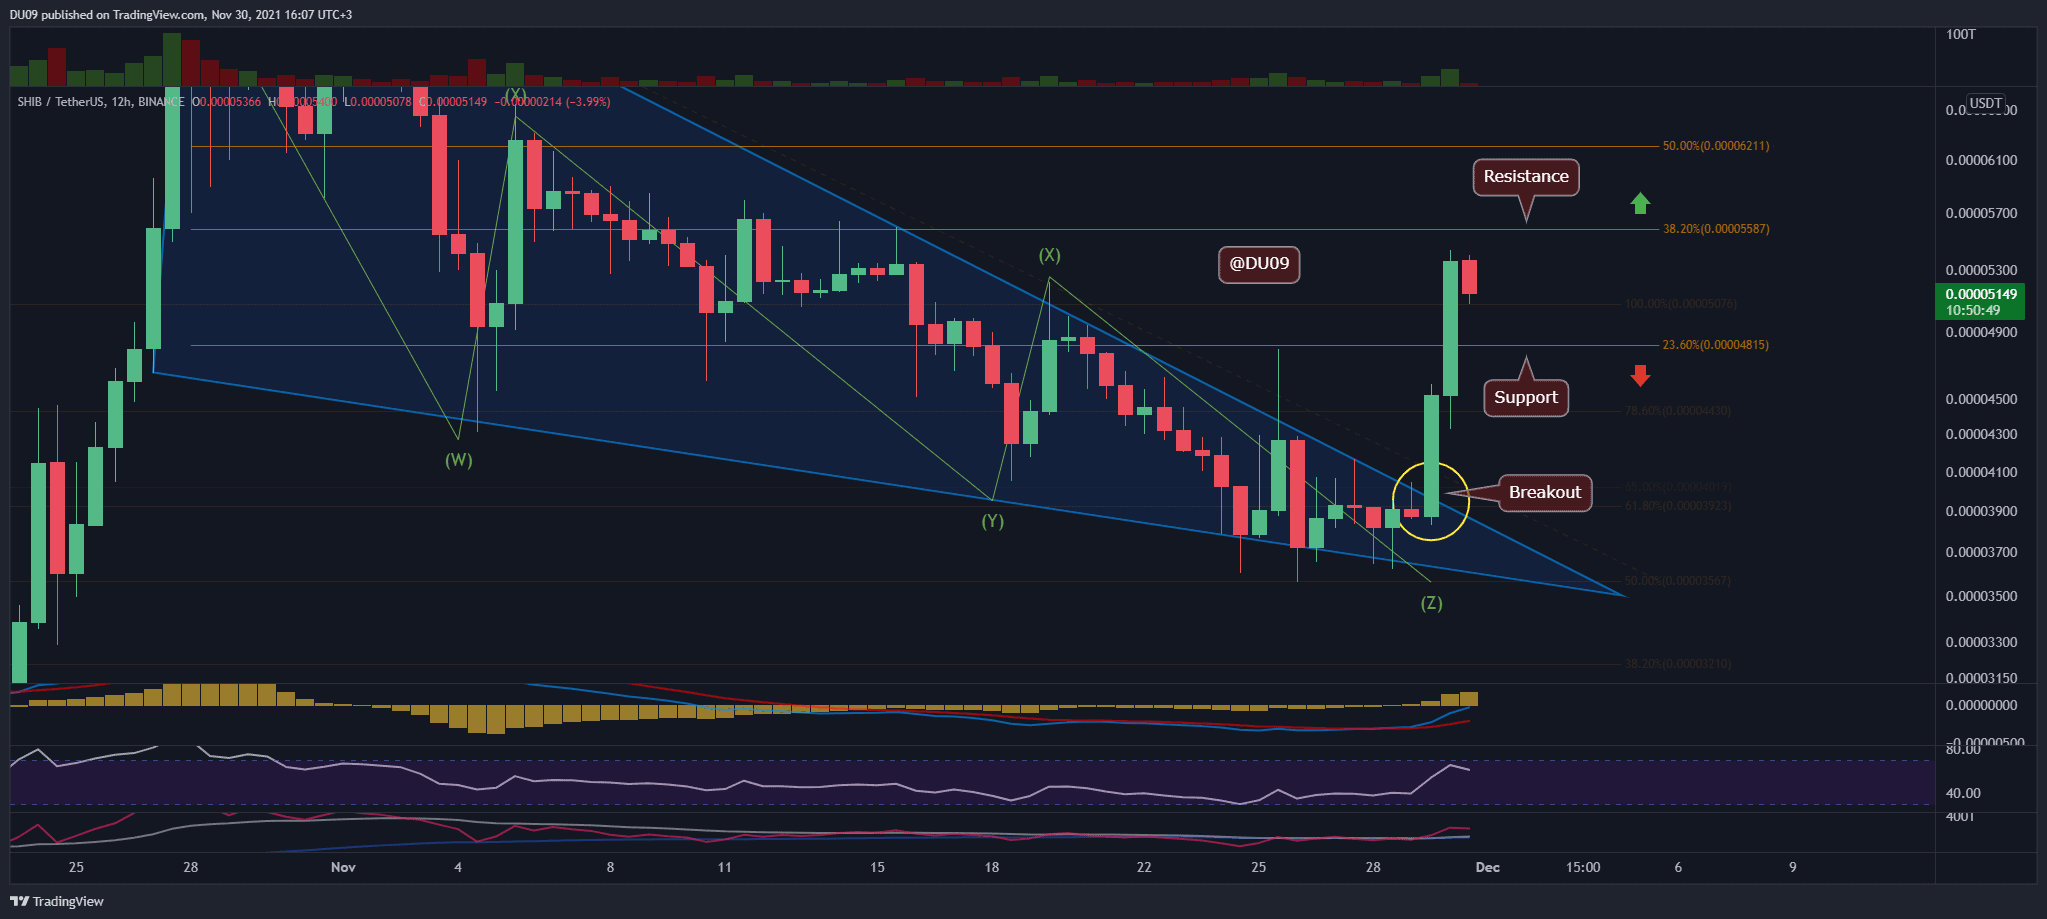
Technical Indicators
Trading Volume: The volume exploded after the break above the wedge. Buyers were so keen to enter into SHIB that pullbacks were too shallow to offer any good entries for latecomers. This level of FOMO quickly moved the price up.
RSI: The 4-hour RSI quickly entered the overbought territory after the breakout. On a daily timeframe, there is plenty of room left for the RSI to go higher, indicating that this bull run might be far from over.
MACD: The MACD on the 12-hours chart completed a bullish cross, and on the daily chart, it is at most one day away from happening. This turns the bias bullish on SHIB. So long as the MACD stays positive, the future is looking bright.
Bias
The bias on SHIB is bullish, and there might be further upside coming in the future.
Short-Term Prediction for SHIB Price
SHIB’s price is currently just below the key resistance at $0.000055. If the current momentum sustains, it seems unlikely that this level can keep the price below it for long, particularly if the volume continues to increase. Therefore, the most likely scenario is for the bulls to continue the rally before a more significant pullback will occur.