Key Support level: %excerpt%.0000240 Key Resistance level: %excerpt%.0000300 Shiba Inu has pumped over 20% off the support level at %excerpt%.0000240 to the key resistance sitting around %excerpt%.0000300. In doing so, SHIB has formed a large descending channel (in blue). If the price fails to break the resistance level in the next day or two, then Shiba Inu’s price is likely to fall again to support before a breakout. Chart by TradingViewTechnical Indicators Volume: The volume continues to be weak. This favors a retest of support before any uptrend continuation. RSI: In line with price, the RSI is forming lower highs on the daily timeframe. MACD: MACD is bearish on the 12h timeframe, and on daily, the histogram and moving averages just crossed into the negative area. The bears appear in control of
Topics:
Duo Nine considers the following as important: Price Analysis, Shiba Inu (SHIB), SHIBBTC, SHIBUSD
This could be interesting, too:
Jordan Lyanchev writes Shiba Inu Price Forecasts: Another 50% Crash or 420% Rally Ahead for SHIB?
Dimitar Dzhondzhorov writes This Trader Made Over Million by Selling Shiba Inu (SHIB) Holdings: Details
Dimitar Dzhondzhorov writes Shiba Inu (SHIB) Drops by 15% in 2 Weeks: These Factors Suggest Extended Correction
Jordan Lyanchev writes Meme Coin Bloodbath: BONK, FLOKI, WIF, SHIB, and DOGE Crash by Double Digits
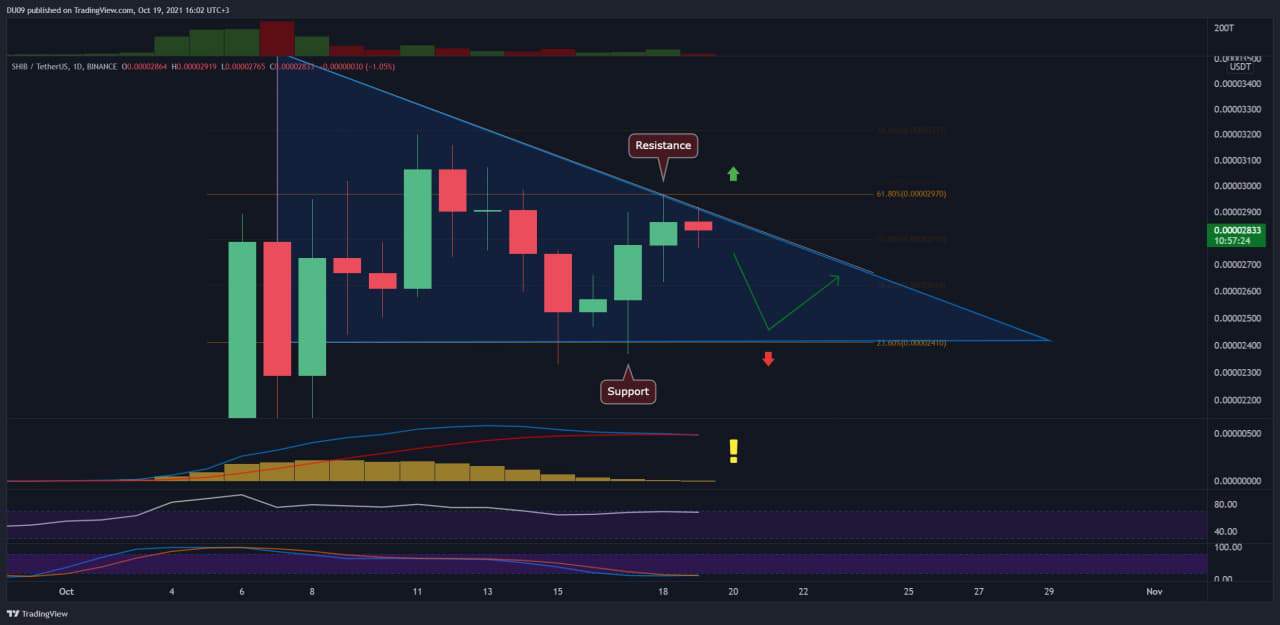
Key Support level: $0.0000240
Key Resistance level: $0.0000300
Shiba Inu has pumped over 20% off the support level at $0.0000240 to the key resistance sitting around $0.0000300. In doing so, SHIB has formed a large descending channel (in blue). If the price fails to break the resistance level in the next day or two, then Shiba Inu’s price is likely to fall again to support before a breakout.

Technical Indicators
Volume: The volume continues to be weak. This favors a retest of support before any uptrend continuation.
RSI: In line with price, the RSI is forming lower highs on the daily timeframe.
MACD: MACD is bearish on the 12h timeframe, and on daily, the histogram and moving averages just crossed into the negative area. The bears appear in control of price, at least until it arrives close to support, where the bulls have shown that they can propel it by more than two digits in a short period.
Bias
The short-term bias is bearish as long as the price fails to break above the descending triangle. The indicators on the daily timeframe support this view, and a retest of support is more likely before any uptrend resumes. Bulls will be in control of price only when they break the key resistance.
Price prediction for SHIB Price
Further consolidation of the price within the blue descending triangle is expected. SHIB’s price action will intensify only when the price breaks away from this formation. Until then, the key levels highlighted at the start of this analysis should remain valid targets for bulls and bears alike.