Key Support levels: 6 Key Resistance level: 7 When we last visited SOL, the price was barely holding above the 7 support level. Since then, SOL broke below this crucial level which has now turned into resistance. The support is now found at 6 and appears to hold. However, the bears have been very aggressive, and a stop in the downtrend still appears unlikely in the near term. Chart by TradingViewTechnical Indicators Trading Volume: Decreasing volume on this last drop in price. This may give a sign that bears are getting exhausted. However, it is too early to say, and bears continue to have the upper hand on price. RSI: The daily RSI continues to go lower and has not reached the oversold area yet (currently at 37). In the past, SOL reversed the downtrend at 33
Topics:
Duo Nine considers the following as important: Price Analysis, Solana (SOL) Price, SOLBTC, SOLUSD
This could be interesting, too:
Chayanika Deka writes Bitcoin Ends Week with 5M Inflows as Multi-Asset Products Face 1M in Losses
Wayne Jones writes Solana Surpasses Ethereum as Top Ecosystem for New Developers in 2024: Report
Jordan Lyanchev writes Solana Whales Begin Accumulation Spree Amid Predictions of SOL at 0
Chayanika Deka writes BNB Overtakes Solana to Secure 5th Spot by Market Cap After Historic Rally
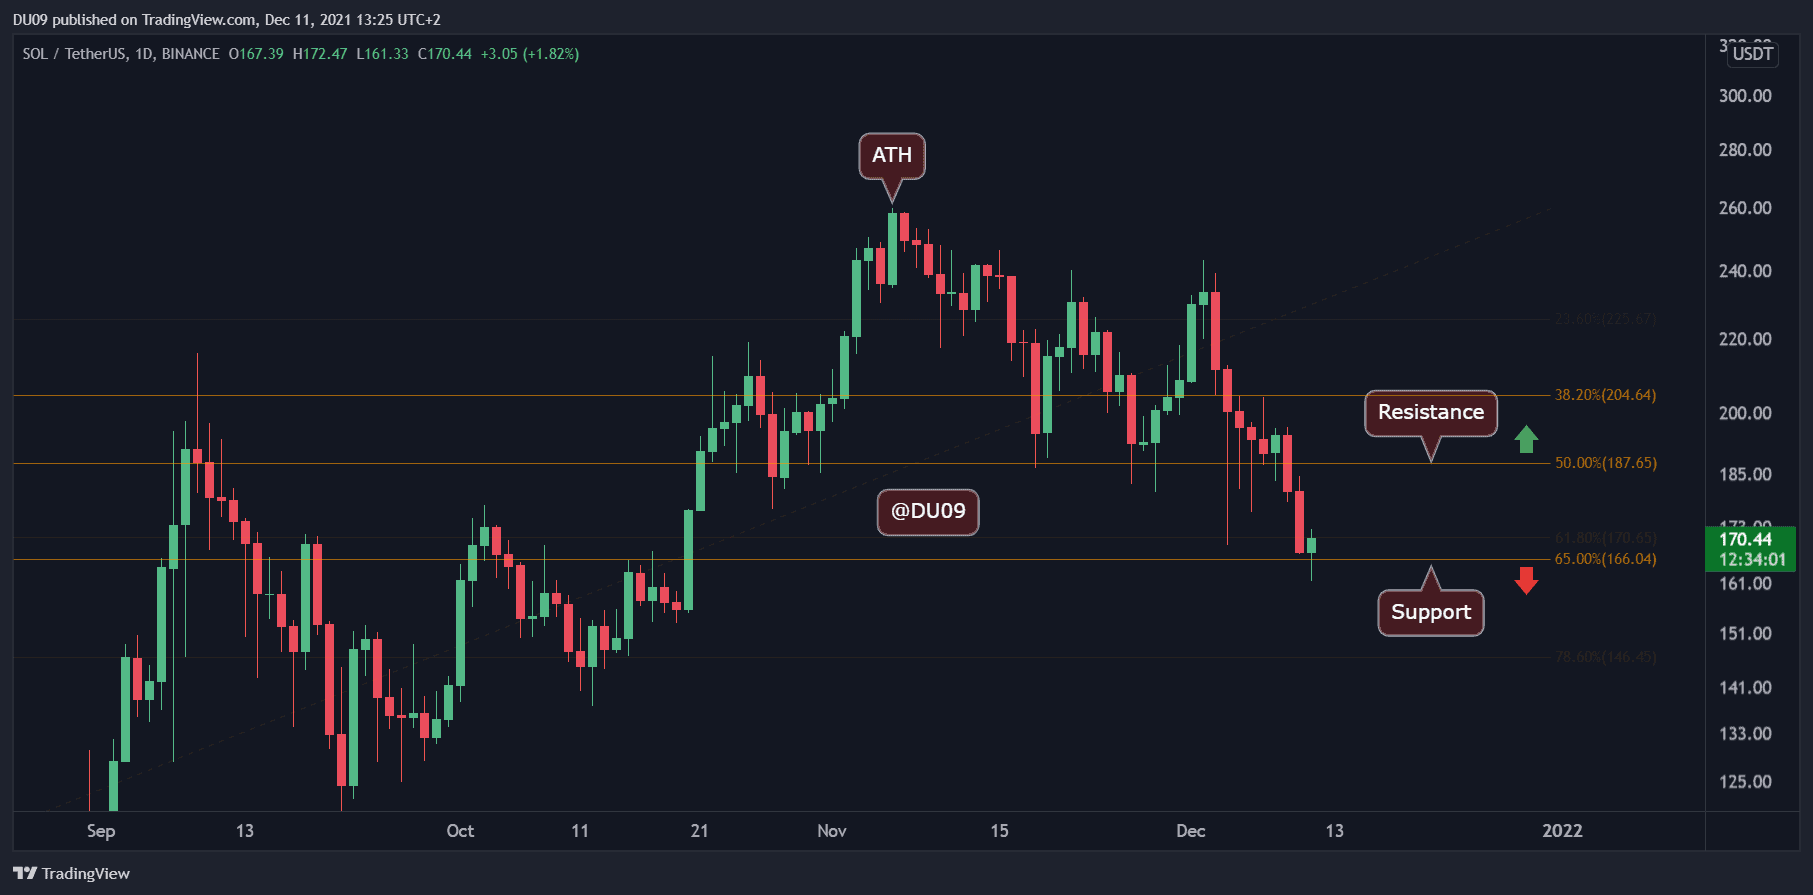
Key Support levels: $166
Key Resistance level: $187
When we last visited SOL, the price was barely holding above the $187 support level. Since then, SOL broke below this crucial level which has now turned into resistance. The support is now found at $166 and appears to hold. However, the bears have been very aggressive, and a stop in the downtrend still appears unlikely in the near term.
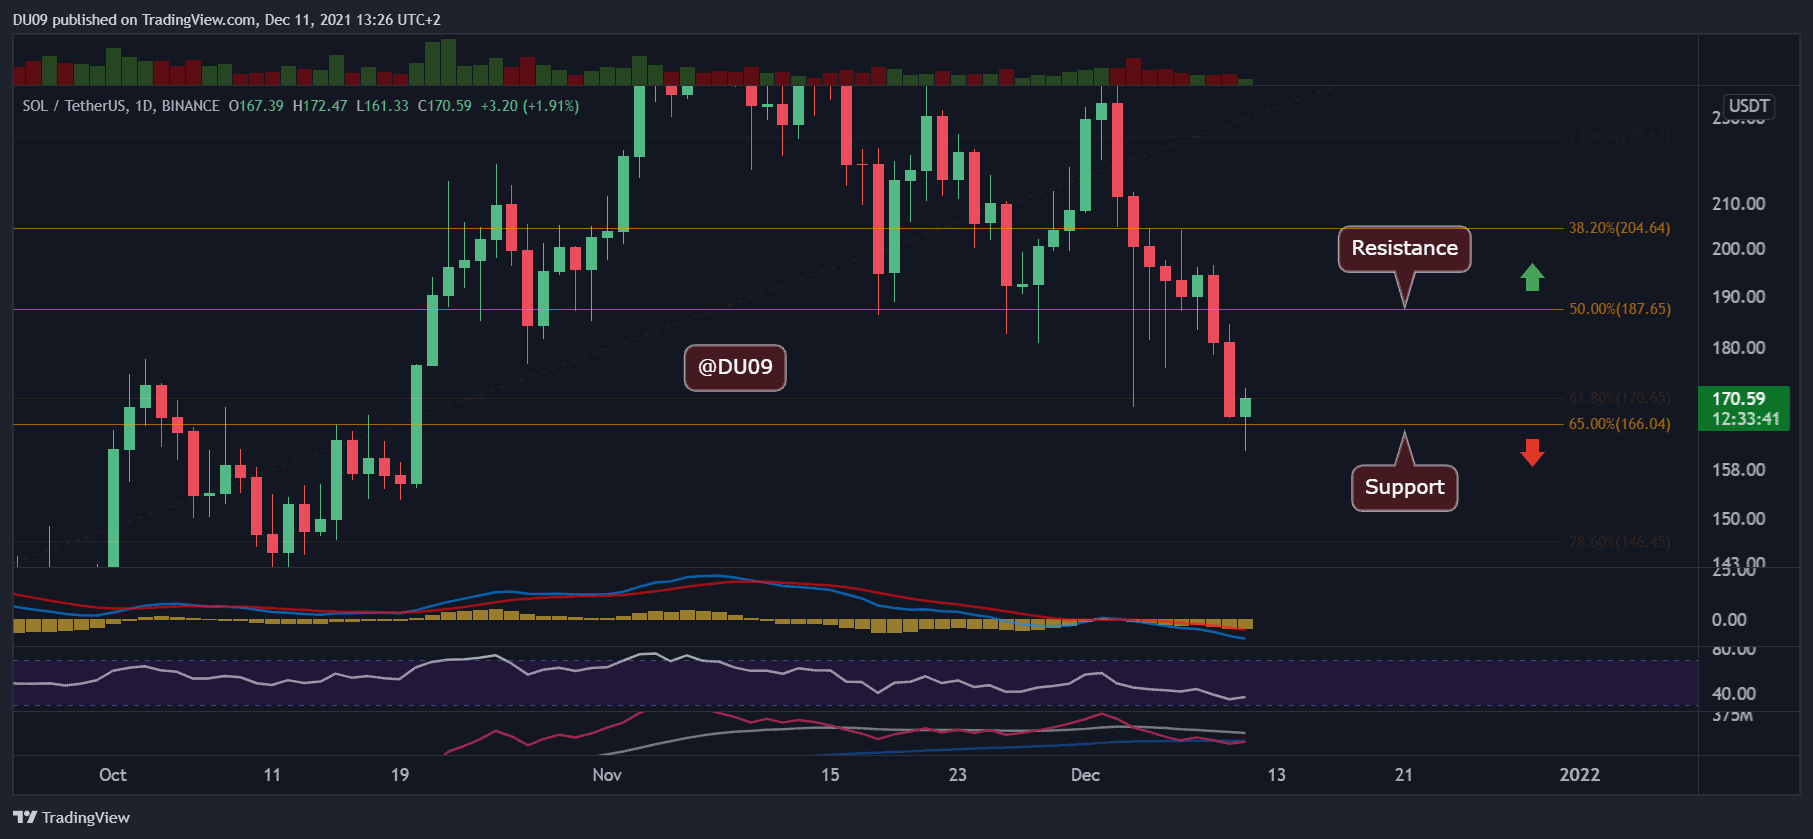
Technical Indicators
Trading Volume: Decreasing volume on this last drop in price. This may give a sign that bears are getting exhausted. However, it is too early to say, and bears continue to have the upper hand on price.
RSI: The daily RSI continues to go lower and has not reached the oversold area yet (currently at 37). In the past, SOL reversed the downtrend at 33 points.
MACD: MACD remains bearish on the daily timeframe. Due to this last drop in price, the MACD moving averages are expanding downwards. As such, bears continue to dominate the chart, and the bulls need to step up to stop this.
Bias
The bias is bearish as long as Solana fails to stop the downtrend.
Short-Term Prediction for SOL Price
SOL’s poor performance continued this week. All attempts by the bulls to reverse this were just unsuccessful. The next important level to look at is $166.