AAVE/USD – Bulls Turn Parabolic Above Ascending Price ChannelKey Support Levels: 5, 0, 8.50.Key Resistance Levels: 0, 0, 8.Aave has turned parabolic after managing to surge by a whopping 72% over the past week alone. The cryptocurrency had been rising throughout January as it remained confined within an ascending price channel.Yesterday, AAVE surge by a total of 27%, allowing the cryptocurrency to reach the upper boundary of this price channel. The further 45% price hike today enabled it to break the upper boundary and turn parabolic.It managed to surge almost as high as 0, setting a new ATH, before coming back lower to rest at 5, the resistance provided by a 1.414 Fib Extension level. From there, it continued higher over the past couple of hours to reach as high as
Topics:
Yaz Sheikh considers the following as important: Aave Price, Price Analysis
This could be interesting, too:
CryptoVizArt writes ETH’s Path to K Involves Maintaining This Critical Support (Ethereum Price Analysis)
Duo Nine writes Crypto Price Analysis June-29: ETH, XRP, ADA, DOGE, and DOT
Duo Nine writes Crypto Price Analysis June-15: ETH, XRP, ADA, DOGE, and DOT
Duo Nine writes Why is the Shiba Inu (SHIB) Price Down Today?
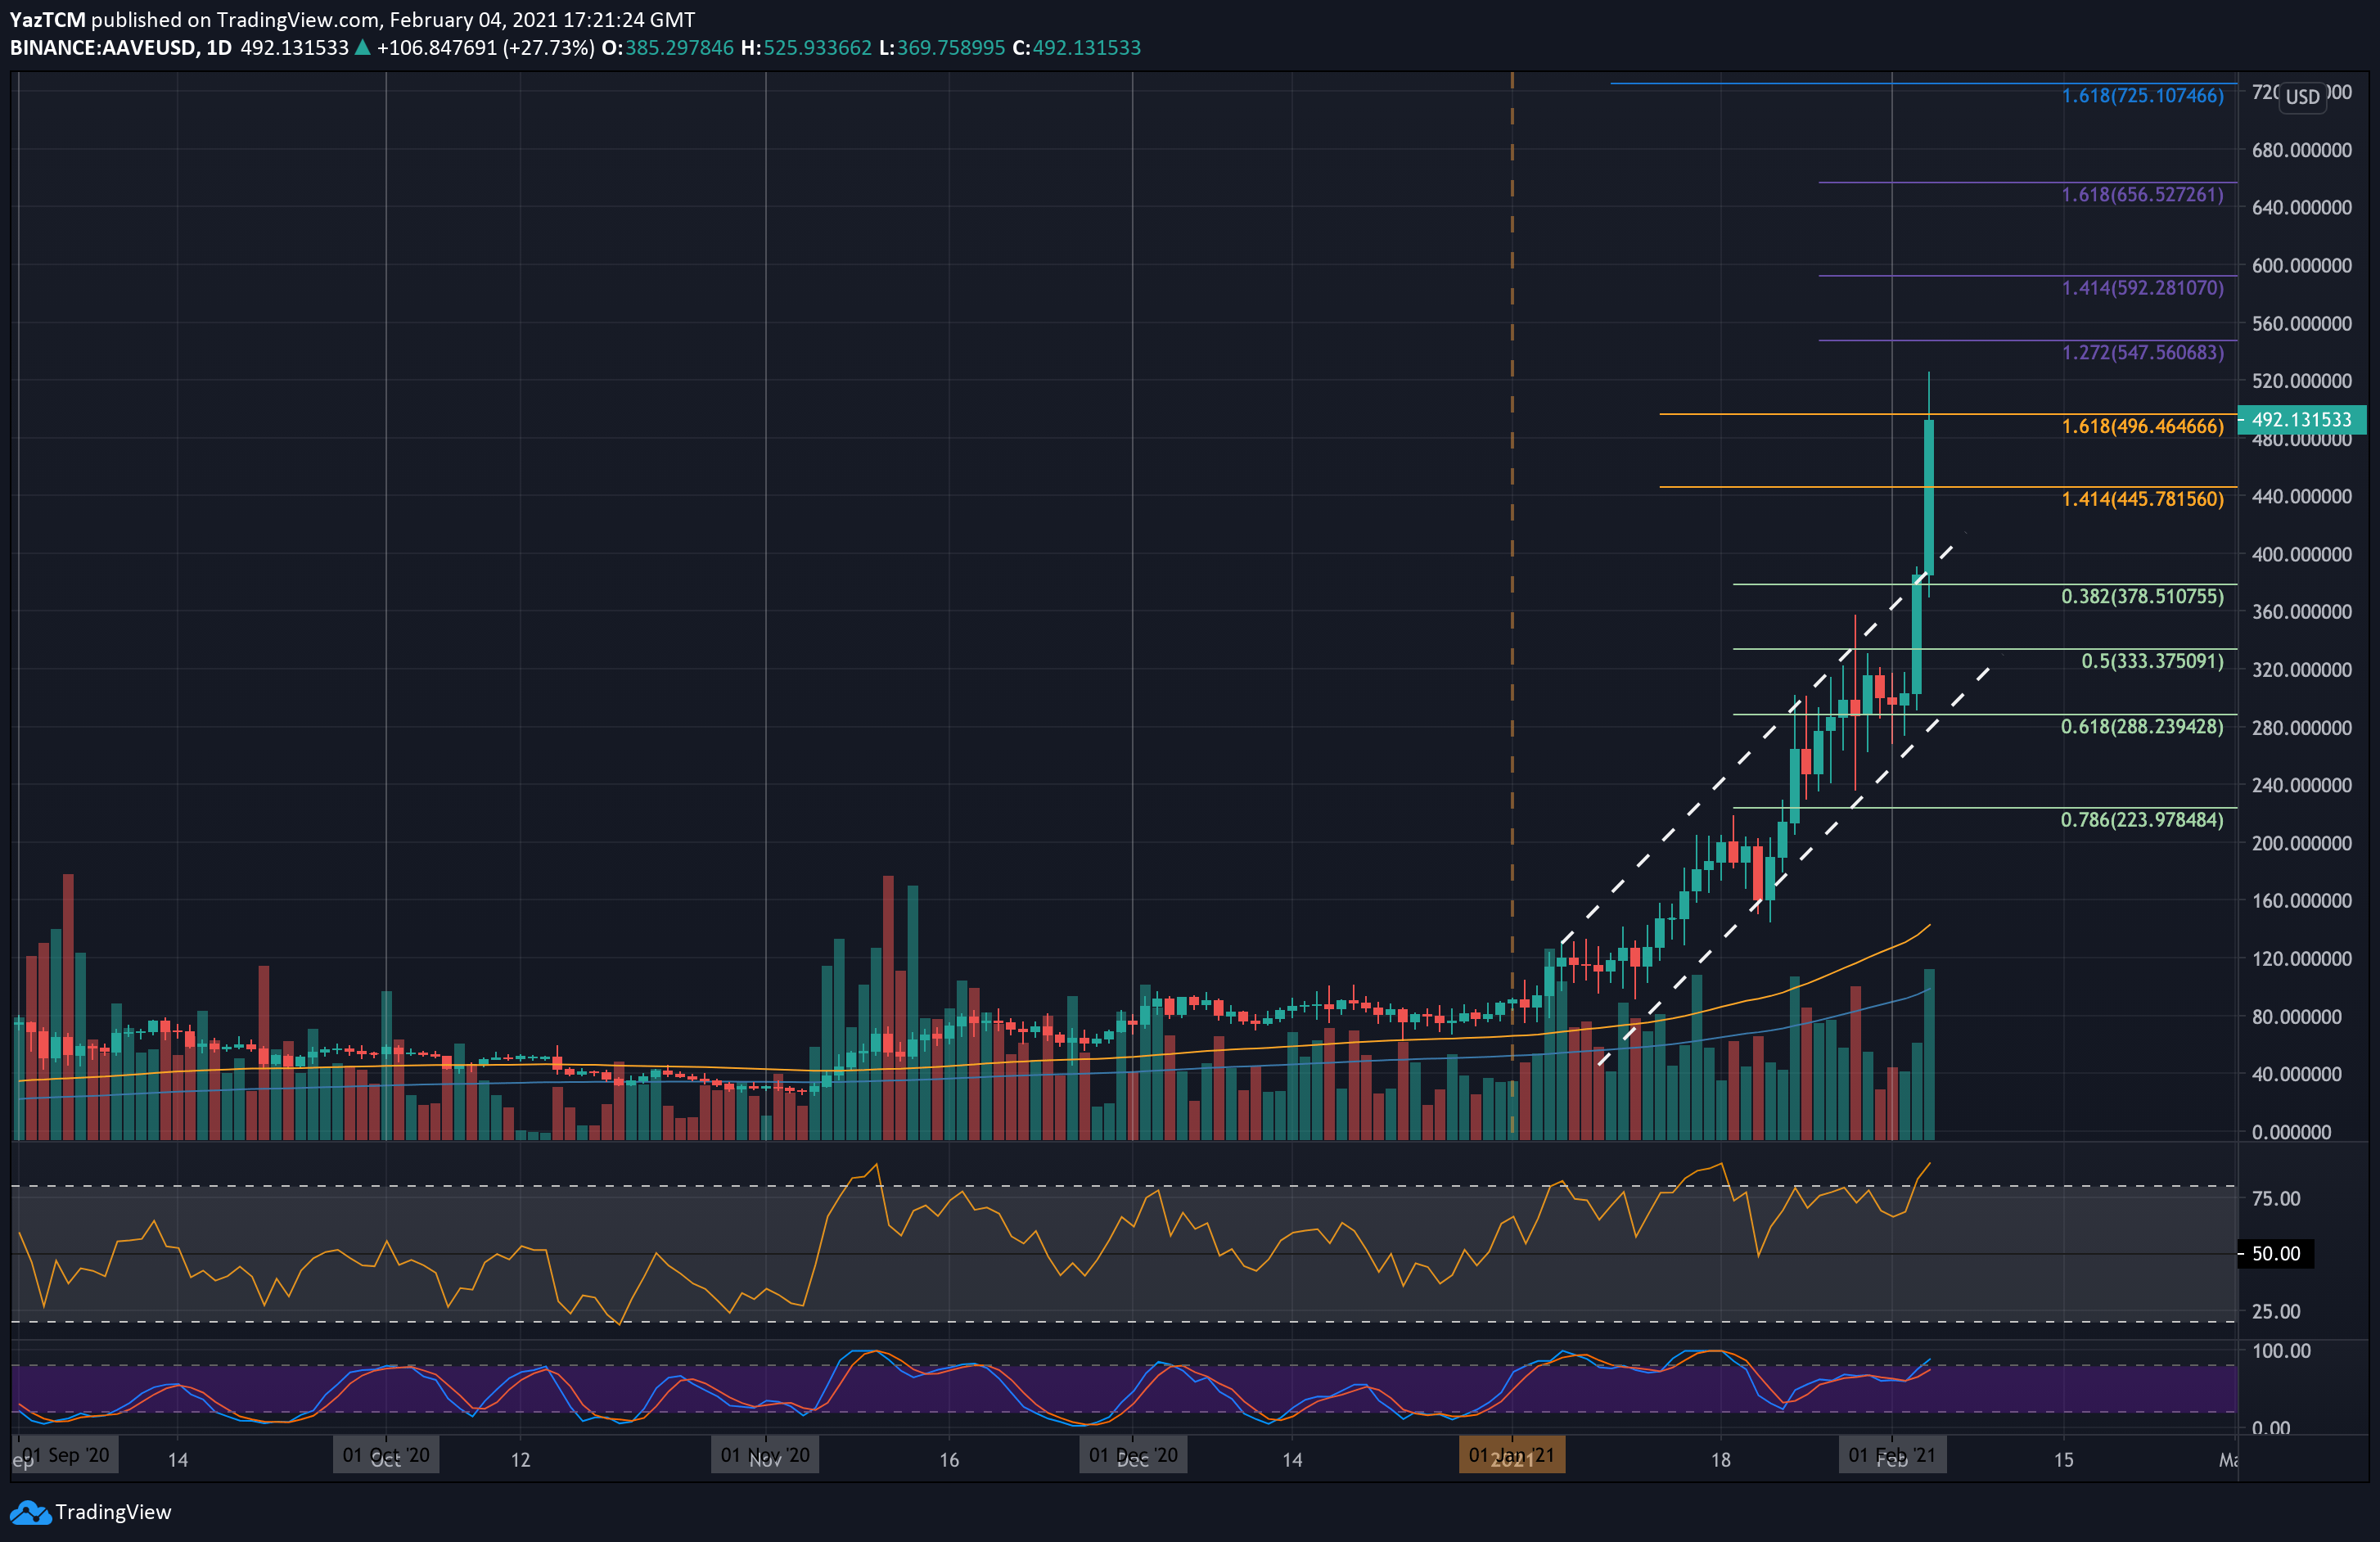
AAVE/USD – Bulls Turn Parabolic Above Ascending Price Channel
Key Support Levels: $445, $400, $378.50.
Key Resistance Levels: $500, $520, $548.
Aave has turned parabolic after managing to surge by a whopping 72% over the past week alone. The cryptocurrency had been rising throughout January as it remained confined within an ascending price channel.
Yesterday, AAVE surge by a total of 27%, allowing the cryptocurrency to reach the upper boundary of this price channel. The further 45% price hike today enabled it to break the upper boundary and turn parabolic.
It managed to surge almost as high as $480, setting a new ATH, before coming back lower to rest at $445, the resistance provided by a 1.414 Fib Extension level. From there, it continued higher over the past couple of hours to reach as high as $520. It is now trading beneath $500 at the $496 resistance.
AAVE-USD Short Term Price Prediction
Looking ahead, once the buyers break $500, the first level of resistance lies at $520 (ATH). This is followed by $548 (1.272 Fib Extension – people), $592 (1.414 Fib Extension – purple), $600, and $656 (1.618 Fib Extension – purple). Added resistance lies at $700 and $725.
On the other side, the first support lies at $445. This is followed by $400, $378.50 (.382 Fib), $320 (lower boundary of the price channel), and $333 (.5 Fib). Additional support lies at $300.
As expected, the RSI has reached extremely overbought conditions as the market turned parabolic, indicating the bulls might be slightly overstretched.
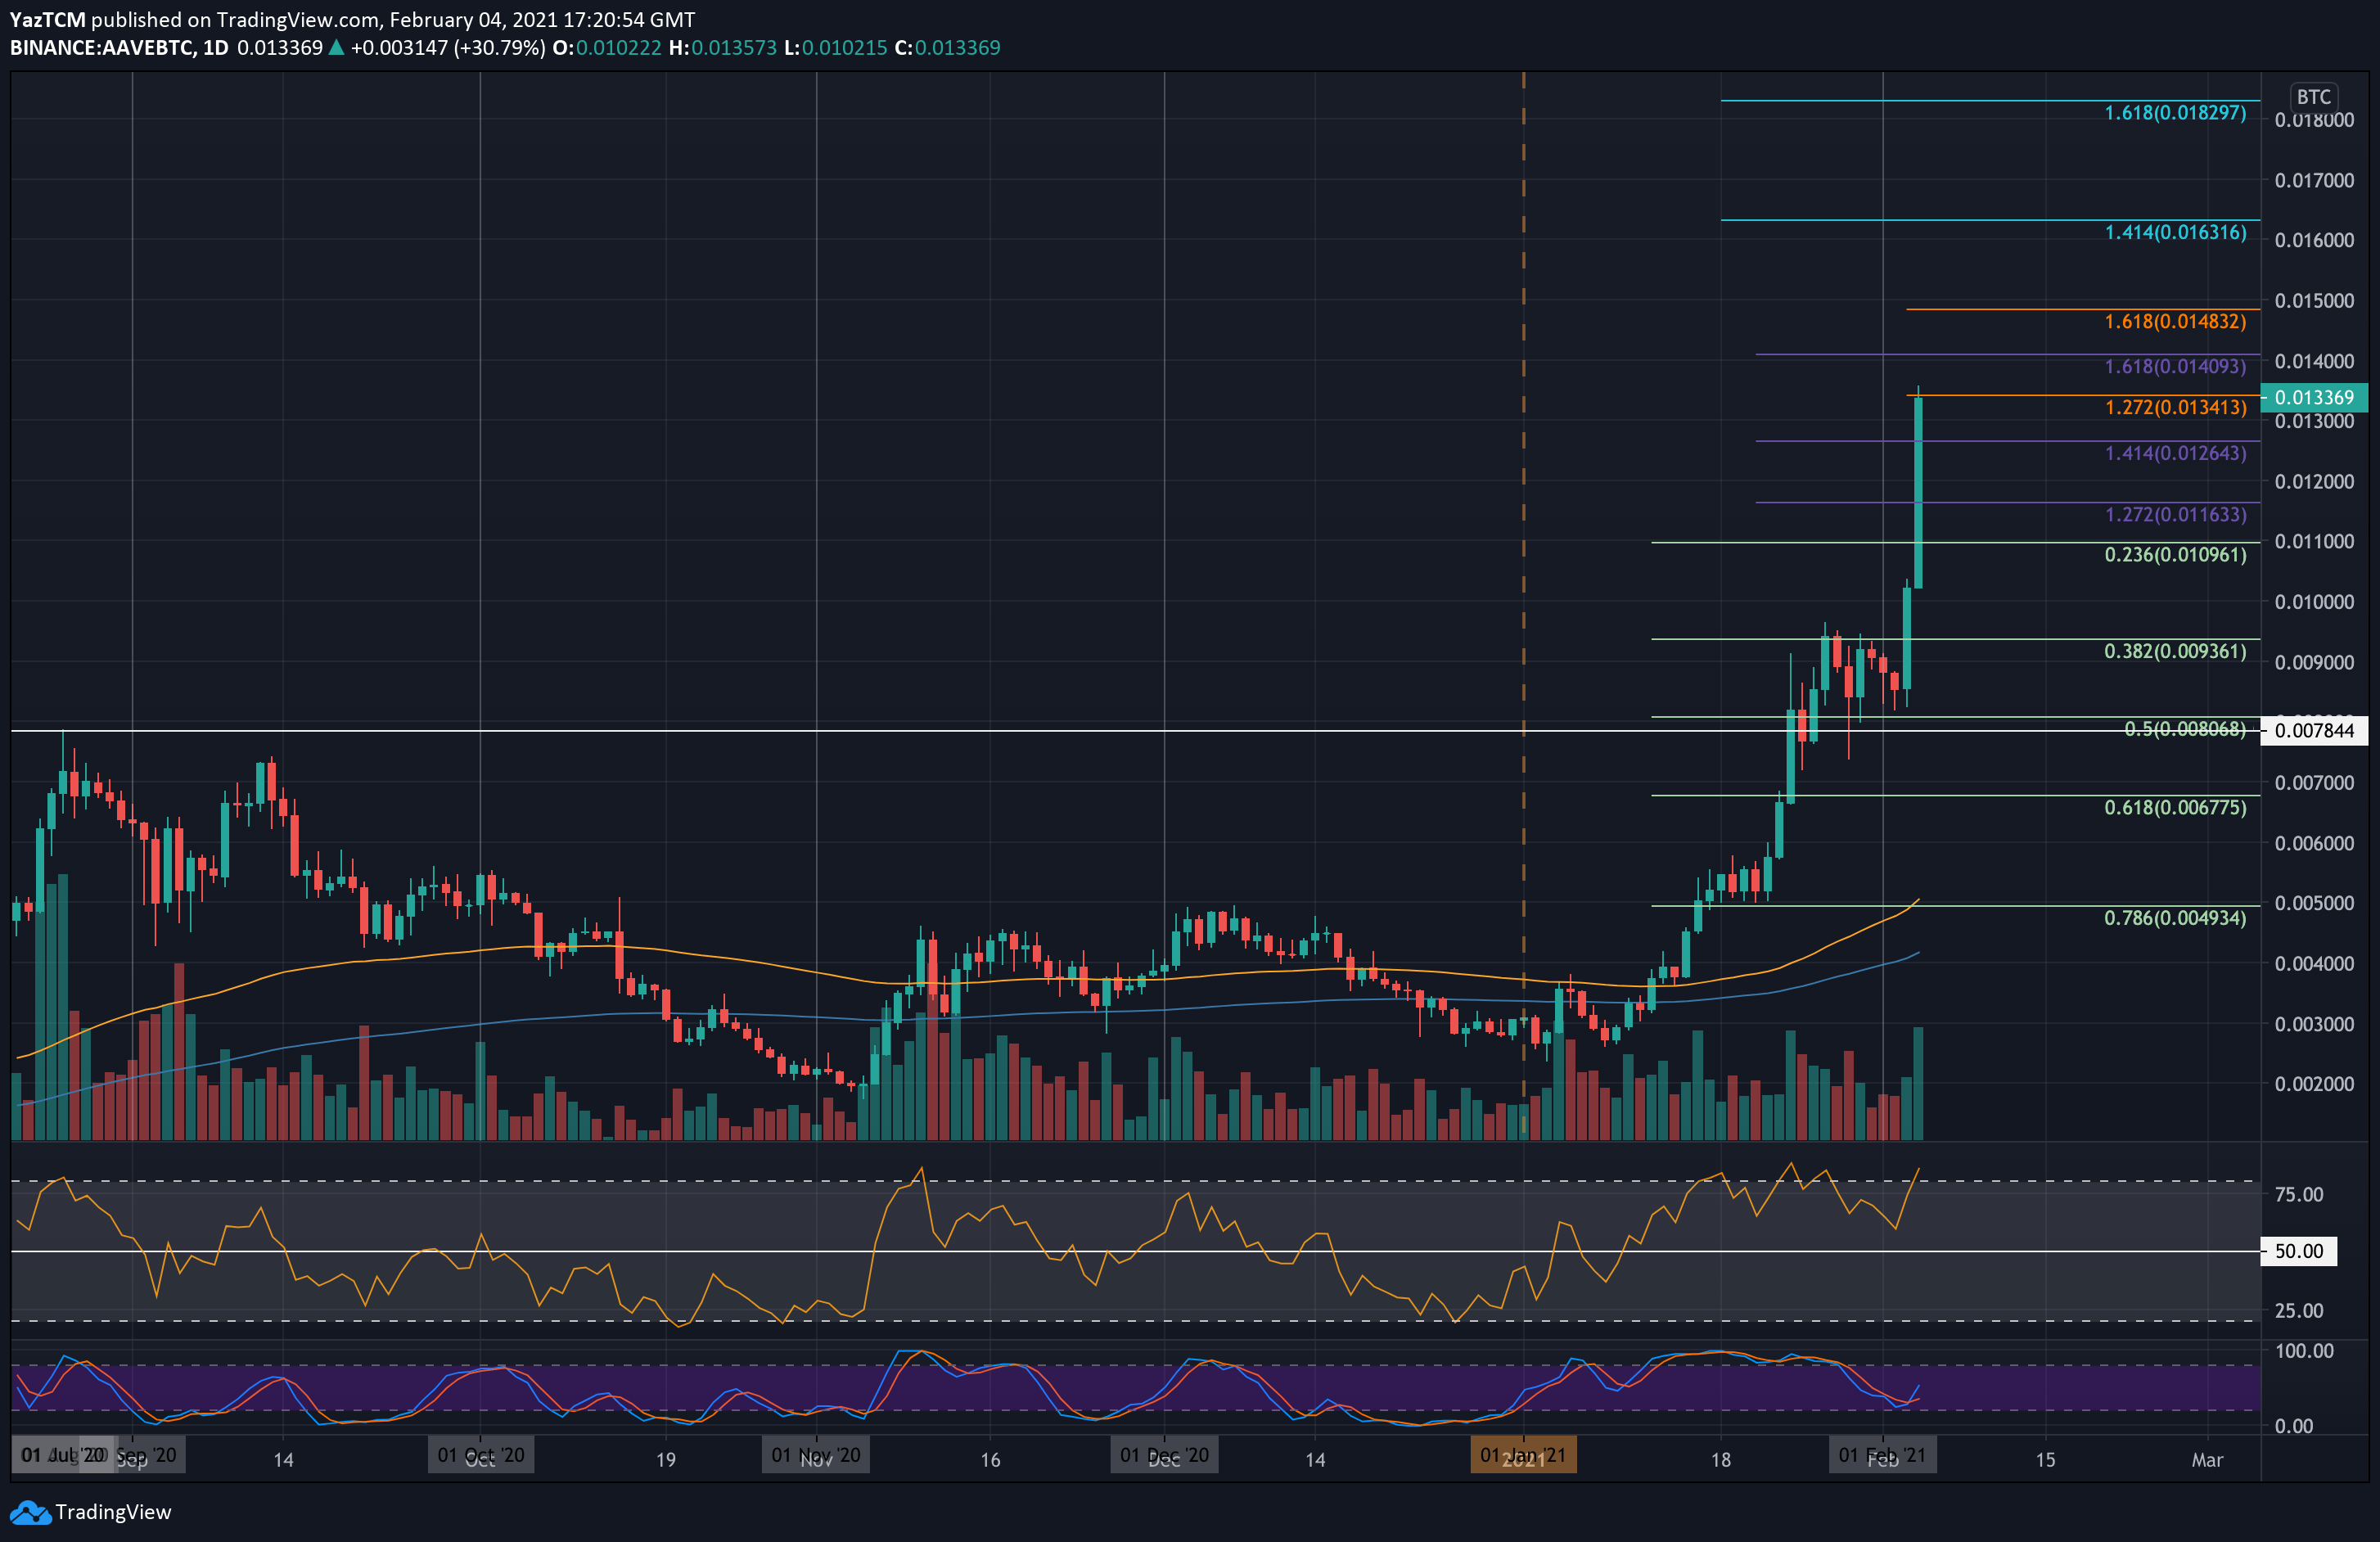
AAVE/BTC – Bulls Breach 0.01 BTC
Key Support Levels: 0.0126 BTC, 0.012 BTC, 0.0109 BTC.
Key Resistance Levels: 0.0134 BTC, 0.014 BTC, 0.0148 BTC.
AAVE is also surging higher against Bitcoin itself. The coin had pushed above 0.003 BTC at the start of January to reach 0.009 BTC by the beginning of February – after setting a new high at 0.0096 BTC.
Yesterday, AAVE bounced from 0.0085 BTC and started to push higher. It managed to break above the previous January high at 0.0096 BTC as it passed the 0.01 BTC level. Today, AAVE surge much higher, reaching the 0.034 BTC resistance level, provided by a 1.272 Fib Extension.
AAVE-BTC Short Term Price Prediction
Looking ahead, the first level of resistance lies at 0.0134 BTC (short term 1.272 Fib Extension). This is followed by 0.014 BTC (1.618 Fib Extension), 0.0148 BTC (short term 1.618 Fib Extension), 0.0161 BTC(1.414 Fib Extension – blue), 0.017 BTC, and 0.0183 BTC (1.618 Fib Extension -blue).
On the other side, the first support lies at 0.0126 BTC. This is followed by 0.012 BTC, 0.0109 BTC (.236 Fib), 0.01 BTC, 0.0093 BTC (.382 Fib), and 0.008 BTC.
Likewise, the RSI is extremely overbought as the buyers might be a little overextended. However, the Stochastic RSI is lined up for a bullish crossover signal that might help to push the market higher.