ADA/USD – Bulls Break Higher Above 50-day MA Key Support Levels: .50, .38, .35.Key Resistance Levels: .70, .80, .00. ADA dropped beneath .50 (50-day MA) over the weekend but managed to find solid support around .35 (100-day MA). This level was further bolstered by a rising trend line that has been in play since the end of April. More specifically, ADA closed the Saturday daily candle above .40 (.5 Fib) and rebounded back above .50 yesterday. Today, it has continued higher as it attempts to break a descending trend line from the May highs. ADA/USD Daily Chart. Source: TradingViewADA-USD Short Term Price Prediction Looking ahead, the first resistance lies at .70 (descending trend line and 20-day MA). This is followed by .80 (bearish .618 Fib), .00
Topics:
Yaz Sheikh considers the following as important: ADABTC, ADAUSD, Cardano (ADA) Price, Price Analysis
This could be interesting, too:
Jordan Lyanchev writes Cardano (ADA) Surpasses Dogecoin After 55% Surge
Jordan Lyanchev writes Trump Confirms Work on Strategic Crypto Reserve: XRP, ADA, SOL Included
Dimitar Dzhondzhorov writes Millions of ADA Sold by Cardano Whales During Market Crash – Will the Decline Continue?
Jordan Lyanchev writes Here’s How Cardano’s 17% Weekly Correction Can Help ADA Hit This Cycle: Analyst
ADA/USD – Bulls Break Higher Above 50-day MA
Key Support Levels: $1.50, $1.38, $1.35.
Key Resistance Levels: $1.70, $1.80, $2.00.
ADA dropped beneath $1.50 (50-day MA) over the weekend but managed to find solid support around $1.35 (100-day MA). This level was further bolstered by a rising trend line that has been in play since the end of April.
More specifically, ADA closed the Saturday daily candle above $1.40 (.5 Fib) and rebounded back above $1.50 yesterday. Today, it has continued higher as it attempts to break a descending trend line from the May highs.
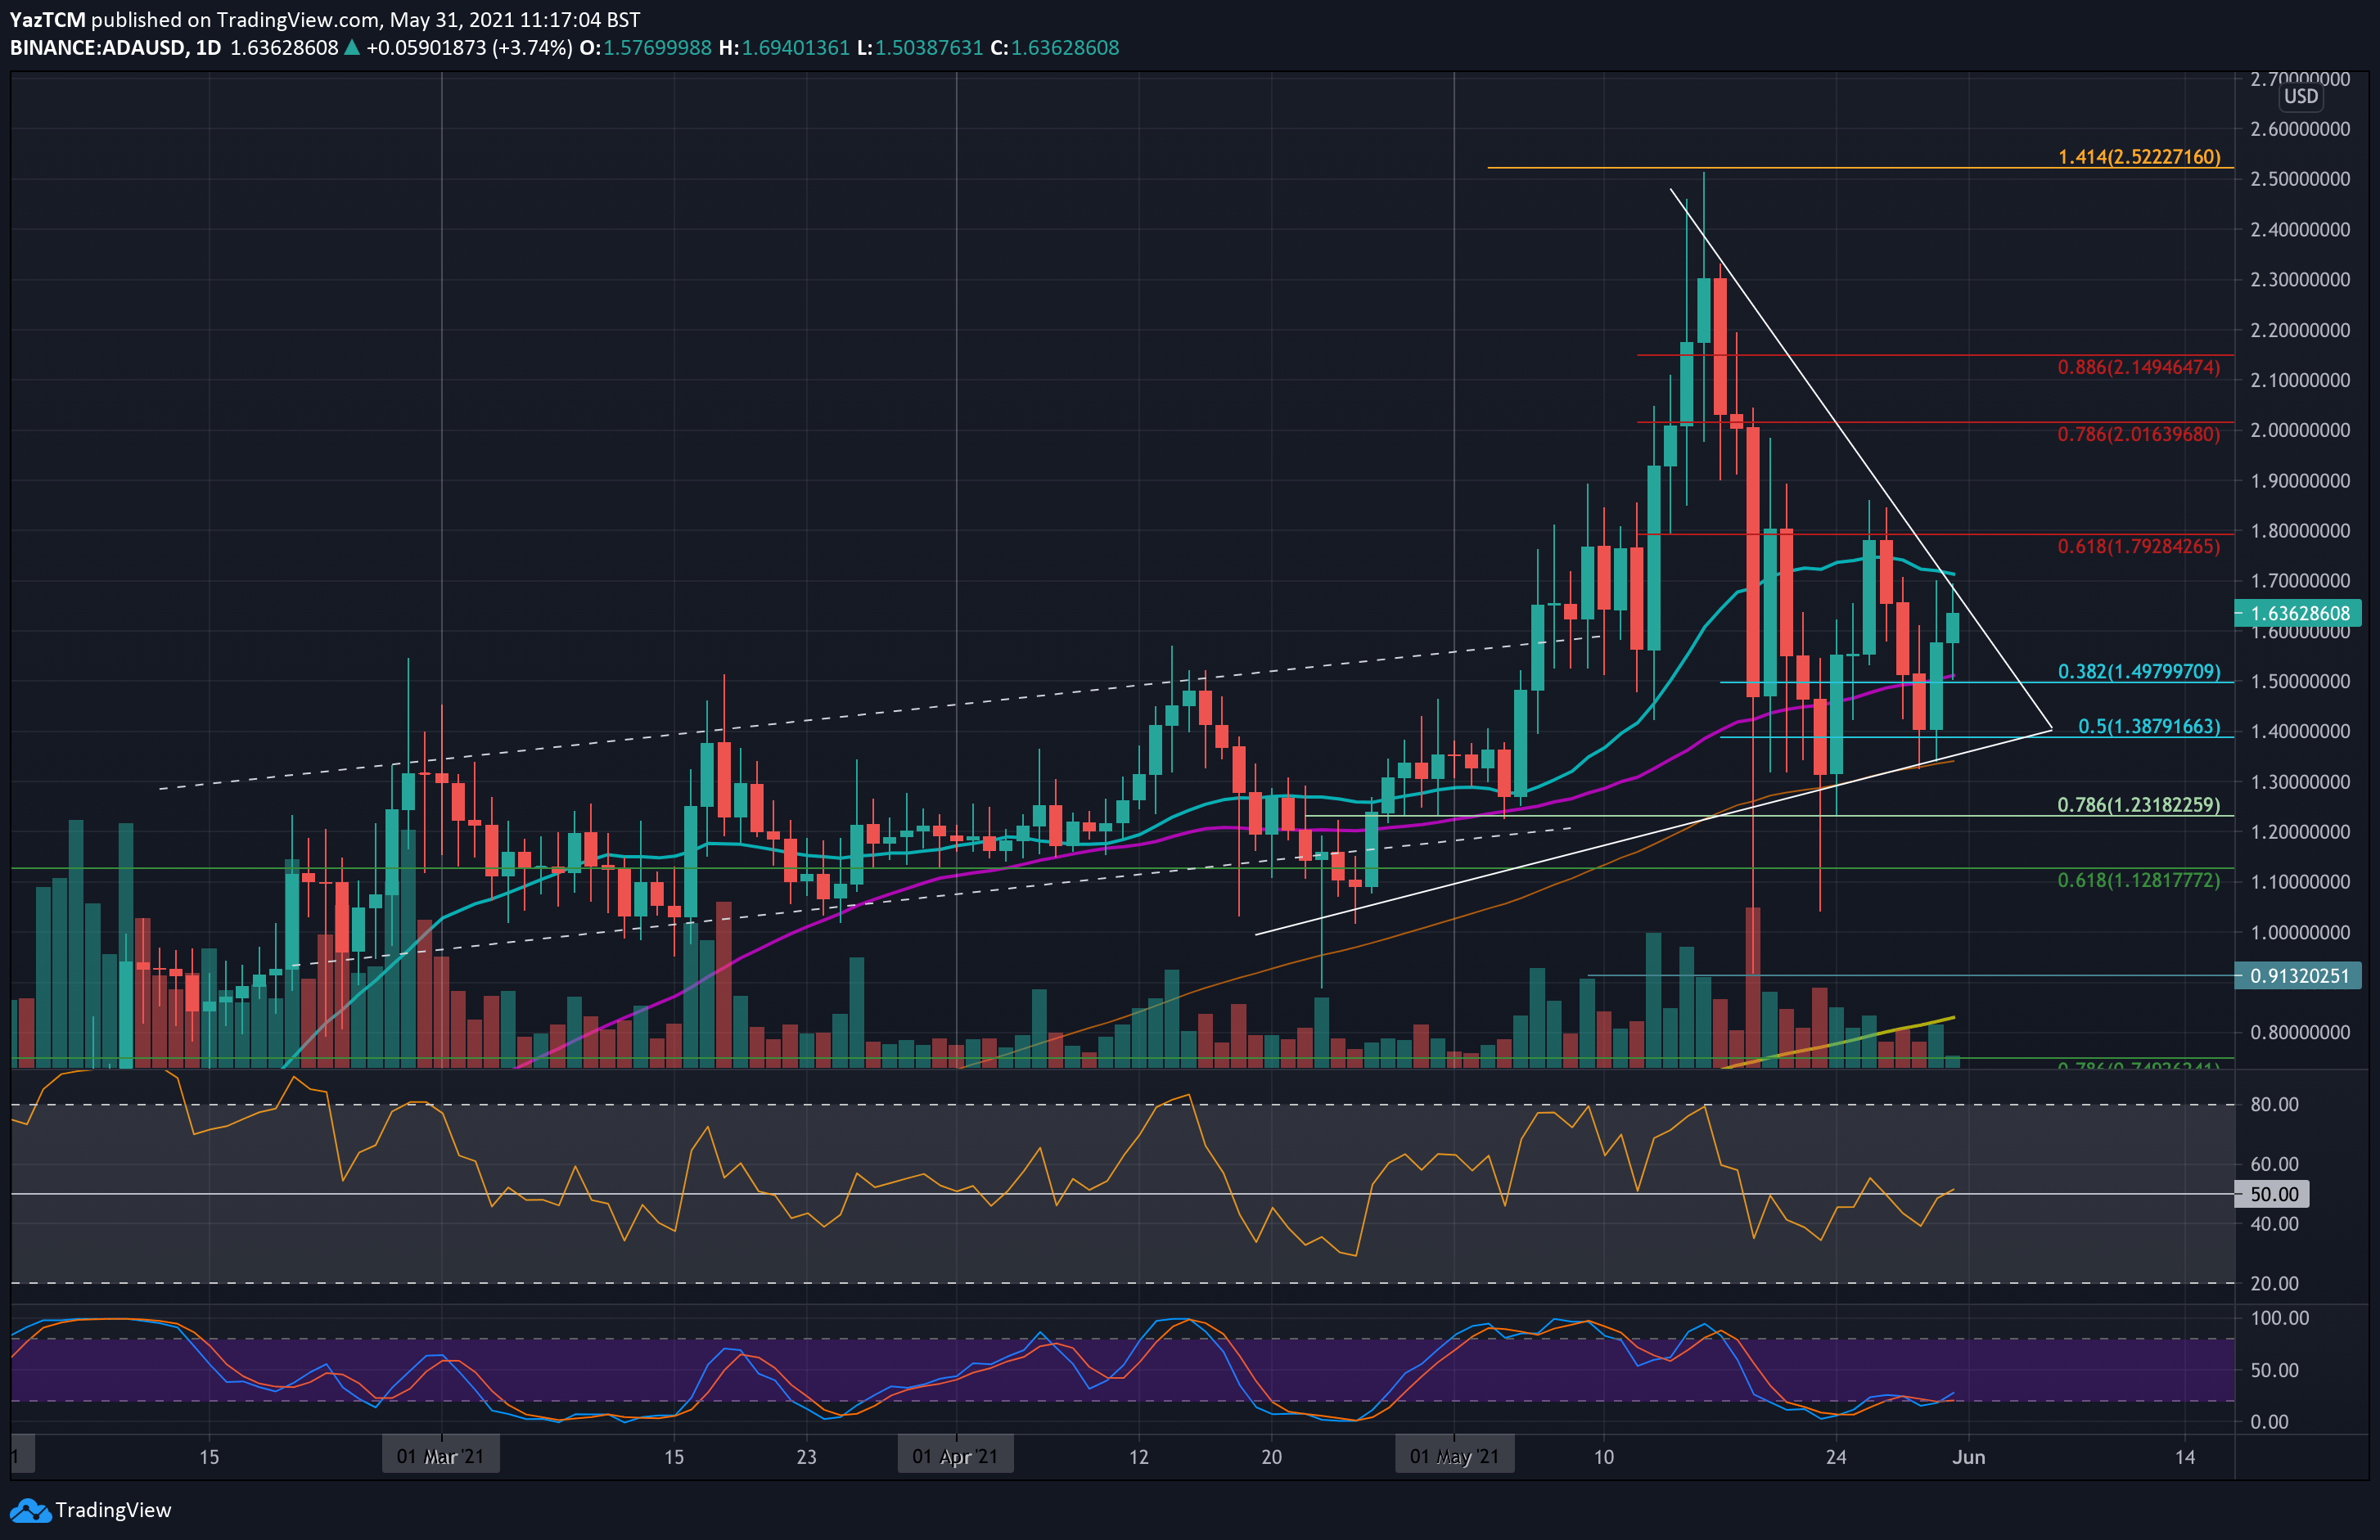
ADA-USD Short Term Price Prediction
Looking ahead, the first resistance lies at $1.70 (descending trend line and 20-day MA). This is followed by $1.80 (bearish .618 Fib), $2.00 (bearish .786 Fib), and $2.15 (bearish .886 Fib).
On the other side, the first support lies at $1.50 (.382 Fib & 50-day MA). This is followed by $1.38 (.5 Fib), $1.35 (100-day MA & rising trend line), and $1.23 (long term .786 Fib).
The RSI has returned to the midline, indicating indecision within the market. The bullish momentum should help ADA break the current descending trend line and head higher if it can continue higher. Additionally, the Stochastic RSI has been coiling and is primed for a bullish crossover signal.
ADA/BTC – ADA Returns To Upper Angle Of Symmetrical Triangle.
Key Support Levels: 4200 SAT, 4000 SAT, 3780 SAT.
Key Resistance Levels: 4570 SAT, 4900 SAT, 5000 SAT.
ADA has been trading in a symmetrical triangle pattern since mid-May. The coin found resistance at the upper angle toward the middle of last week as it attempted to break resistance at 4570 SAT (1.414 Fib Extension).
It failed to break the resistance and ended up dropping into 4000 SAT over the weekend. It rebounded from there yesterday and is now testing the upper angle of the triangle once again today.
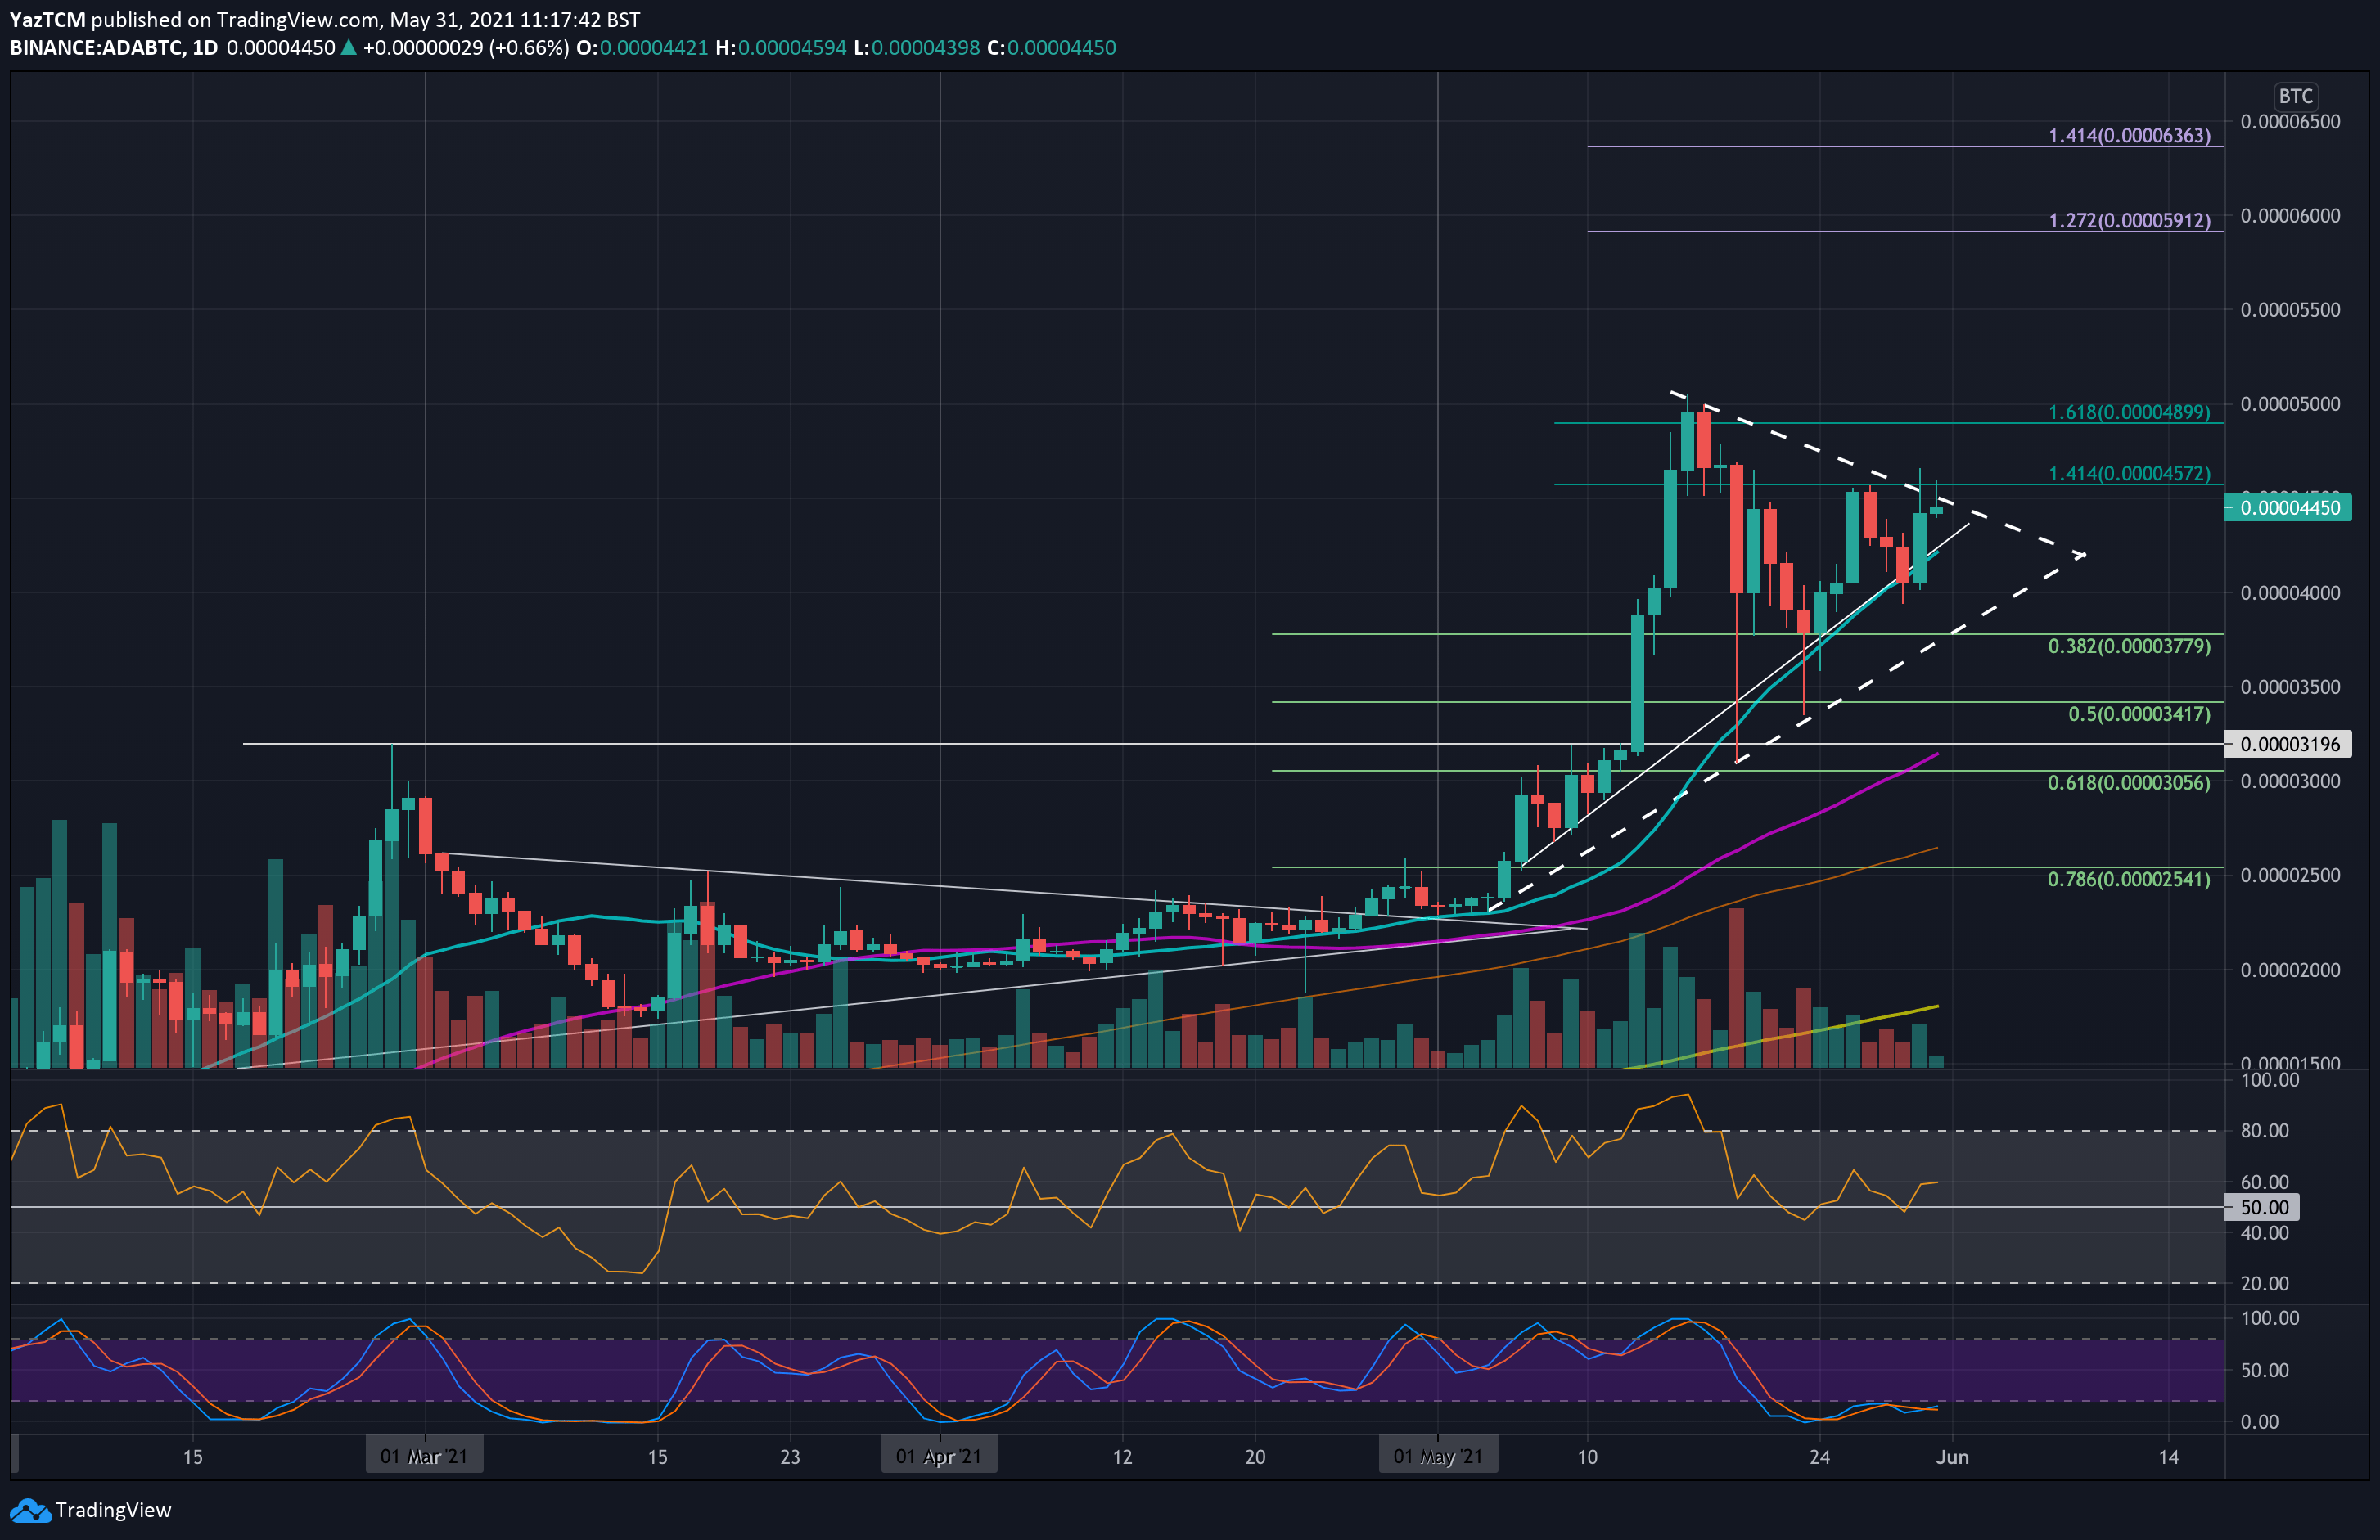
ADA-BTC Short Term Price Prediction
Moving forward, the first resistance lies at 4570 SAT (1.414 Fib Extension & upper angle of triangle). This is followed by 4900 SAT (1.618 Fib Extension), 5000 SAT, and 5500 SAT.
On the other side, the first support lies at 4200 SAT (20-day MA). This is followed by 4000 SAT, 3780 SAT (.382 Fib), 3420 SAT (.5 Fib), and 3190 SAT (50-day MA).
The RSI is showing weak bullish momentum. It would need to climb higher to provide a strong breakout of the current triangle and head toward 5000 SAT.