ADA/USD – ADA Plummets Beneath The 100-day MA Key Support Levels: .07, .00, %excerpt%.913.Key Resistance Levels: .20, .30, .42. ADA fell beneath the 100-day MA at .42 over the weekend and has since plummetted as low as today. The cryptocurrency was trading inside a symmetrical triangle pattern and broke toward the downside of the consolidation on Saturday. Yesterday, ADA slipped from the 100-day MA and fell beneath .20. It continued today as ADA broke support at .12 (long-term .618 Fib) and dropped into (short-term .886 Fib). ADA/USD Daily Chart. Source: TradingView.ADA-USD Short Term Price Prediction Looking ahead, if the bears break .07, the first major support lies at .00 (200-day MA). This is followed by support at %excerpt%.913 (May lows), %excerpt%.847 (downside
Topics:
Yaz Sheikh considers the following as important: ADABTC, ADAUSD, Cardano (ADA) Price, Price Analysis
This could be interesting, too:
Jordan Lyanchev writes Cardano (ADA) Surpasses Dogecoin After 55% Surge
Jordan Lyanchev writes Trump Confirms Work on Strategic Crypto Reserve: XRP, ADA, SOL Included
Dimitar Dzhondzhorov writes Millions of ADA Sold by Cardano Whales During Market Crash – Will the Decline Continue?
Jordan Lyanchev writes Here’s How Cardano’s 17% Weekly Correction Can Help ADA Hit This Cycle: Analyst
ADA/USD – ADA Plummets Beneath The 100-day MA
Key Support Levels: $1.07, $1.00, $0.913.
Key Resistance Levels: $1.20, $1.30, $1.42.
ADA fell beneath the 100-day MA at $1.42 over the weekend and has since plummetted as low as $1 today.
The cryptocurrency was trading inside a symmetrical triangle pattern and broke toward the downside of the consolidation on Saturday. Yesterday, ADA slipped from the 100-day MA and fell beneath $1.20.
It continued today as ADA broke support at $1.12 (long-term .618 Fib) and dropped into $1 (short-term .886 Fib).
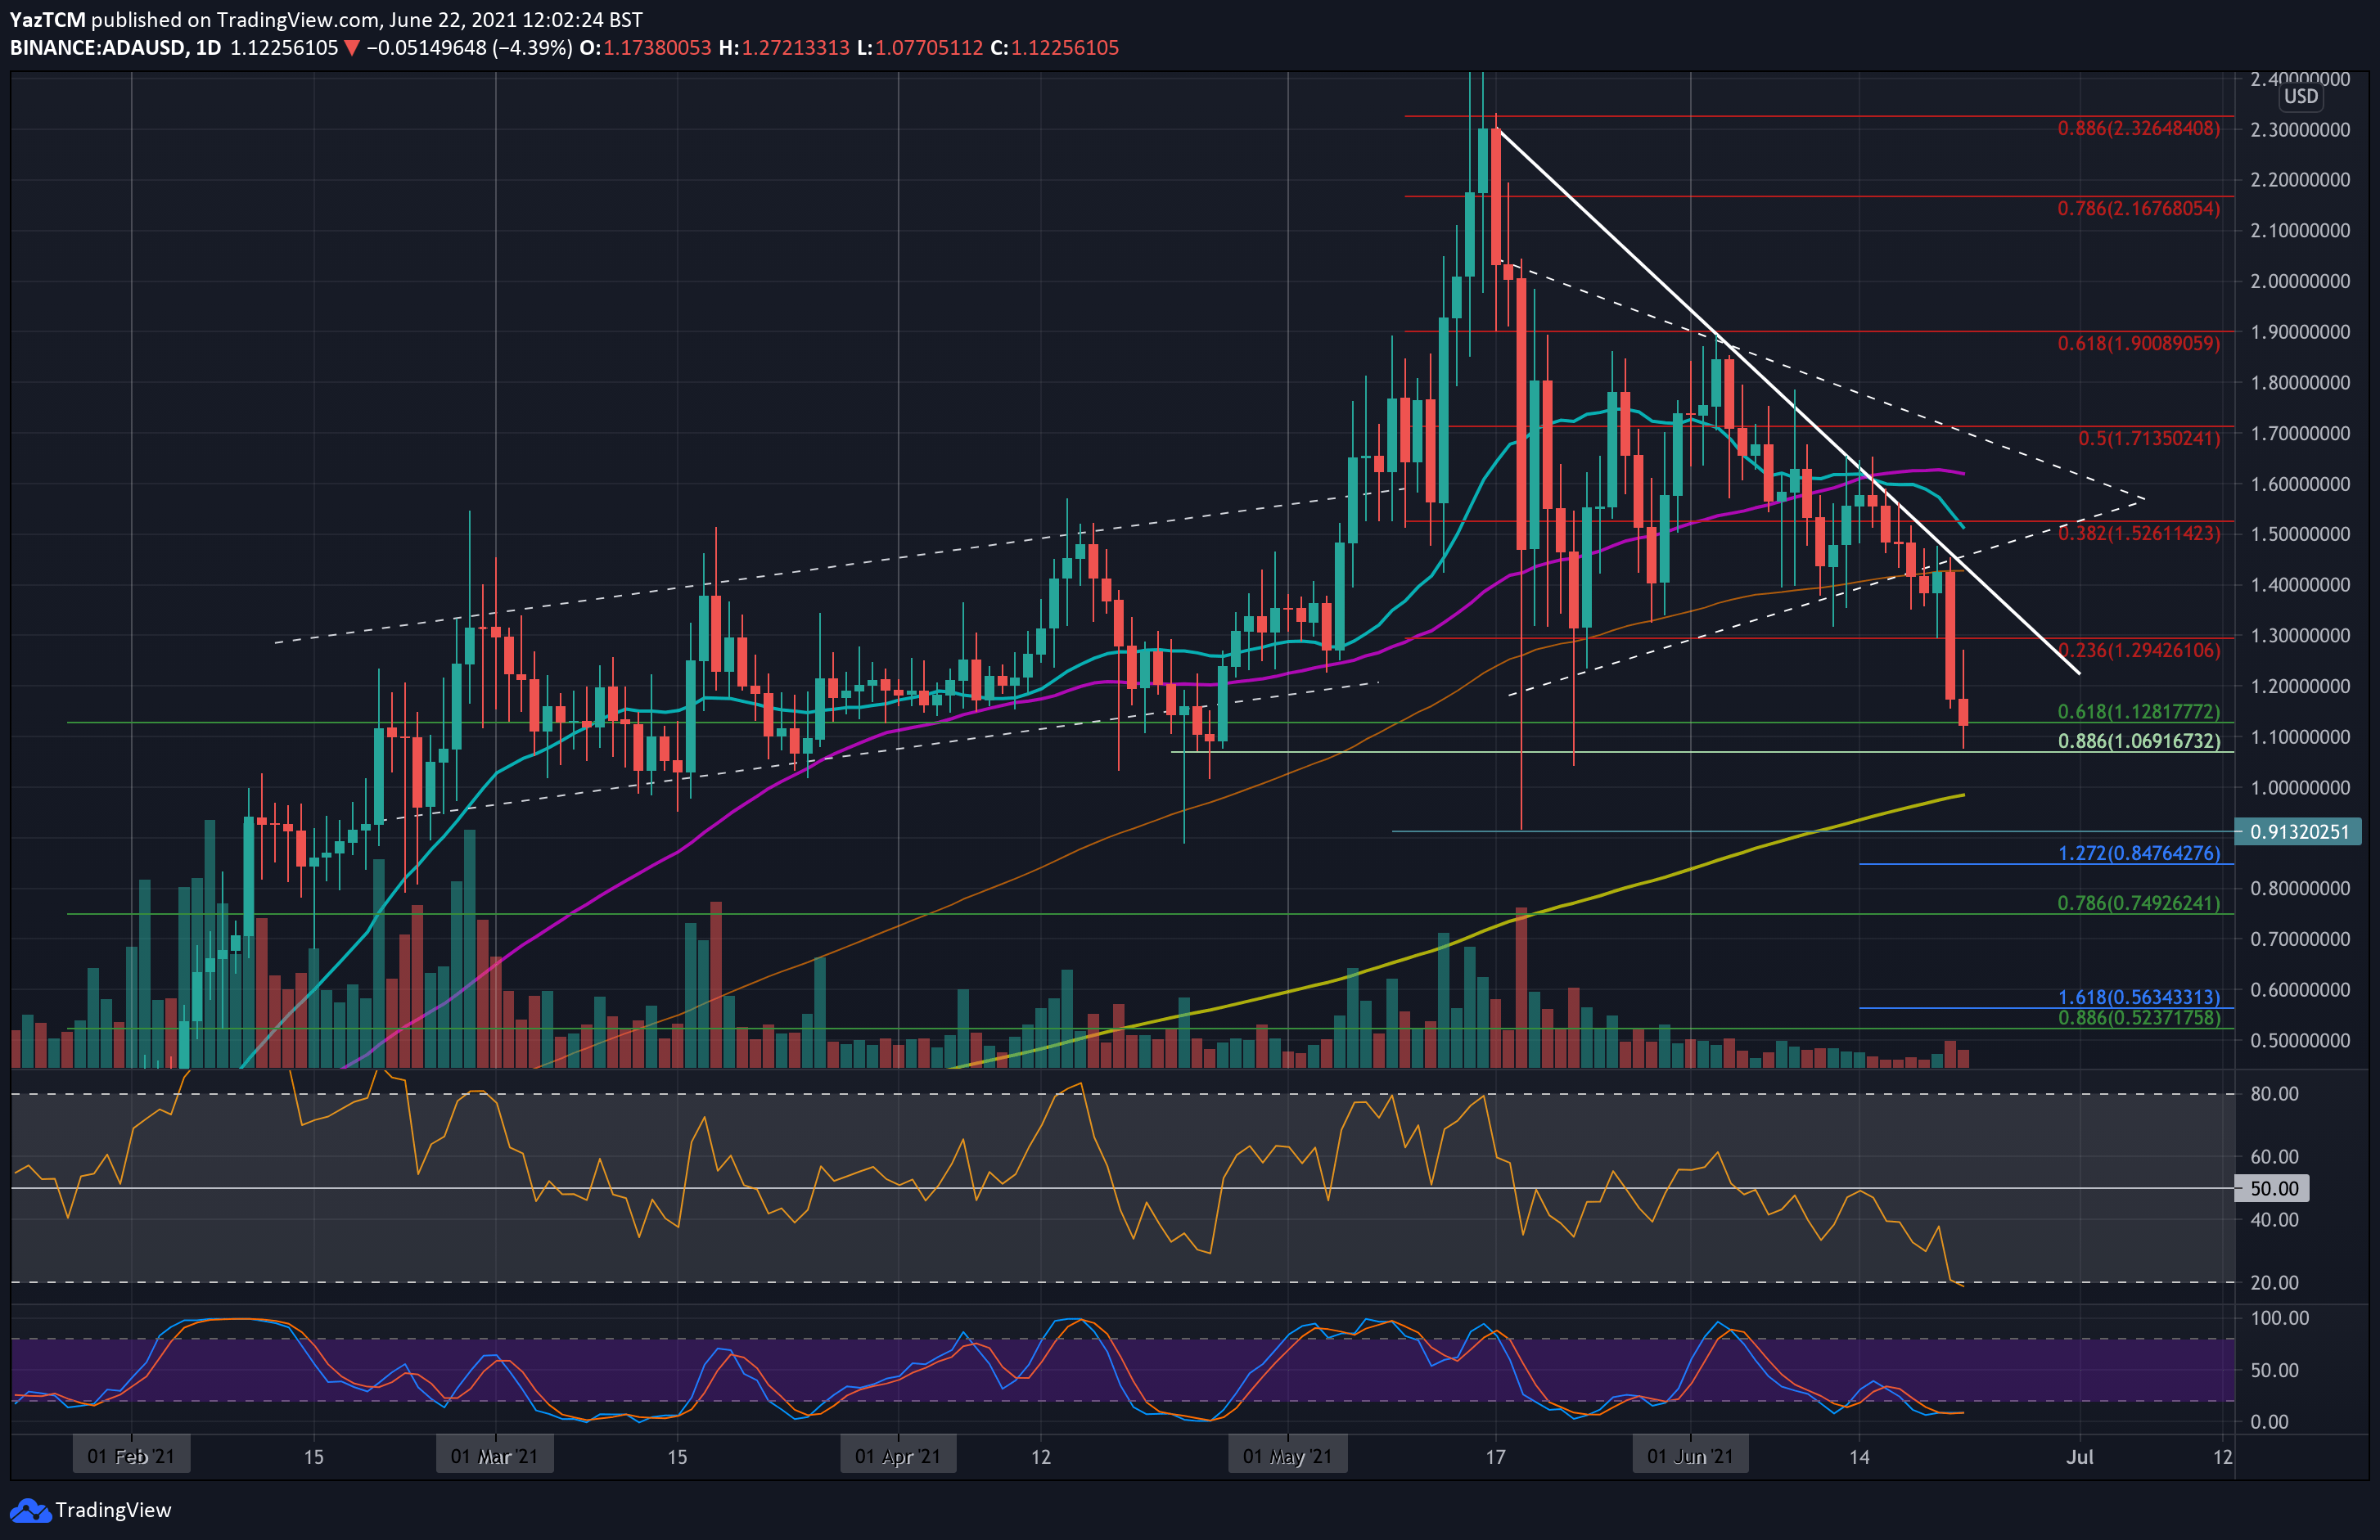
ADA-USD Short Term Price Prediction
Looking ahead, if the bears break $1.07, the first major support lies at $1.00 (200-day MA). This is followed by support at $0.913 (May lows), $0.847 (downside 1.272 Fib Extension), $0.8, and $0.75 (.786 Fib).
On the other side, the first resistance lies at $1.20. This is followed by $1.30 (bearish .236 Fib & falling trend line), $1.42 (100-day MA), and $1.50 (bearish .382 Fib).
The daily RSI reached extremely oversold conditions today, indicating that the sellers must be reaching exhaustion soon. The RSI is now the most oversold since September 2020.
ADA/BTC – ADA Loses 50-day MA and Drops To .5 Fib Support
Key Support Levels: 3440 SAT, 3200 SAT, 3070 SAT.
Key Resistance Levels: 3600 SAT, 3800 SAT, 4000 SAT.
ADA also lost crucial support at 3820 SAT (.382 Fib) this week. It had established this support in June and managed to close each daily candle above it through the month. ADA bounced higher from it over the weekend and climbed above the 50-day MA.
Unfortunately, it was unable to close above the 50-day MA at 4000 SAT and dropped lower from there yesterday as it fell beneath 3820 SAT (.382 Fib). Today, it continued until added support was found at 3440 SAT (.5 Fib).
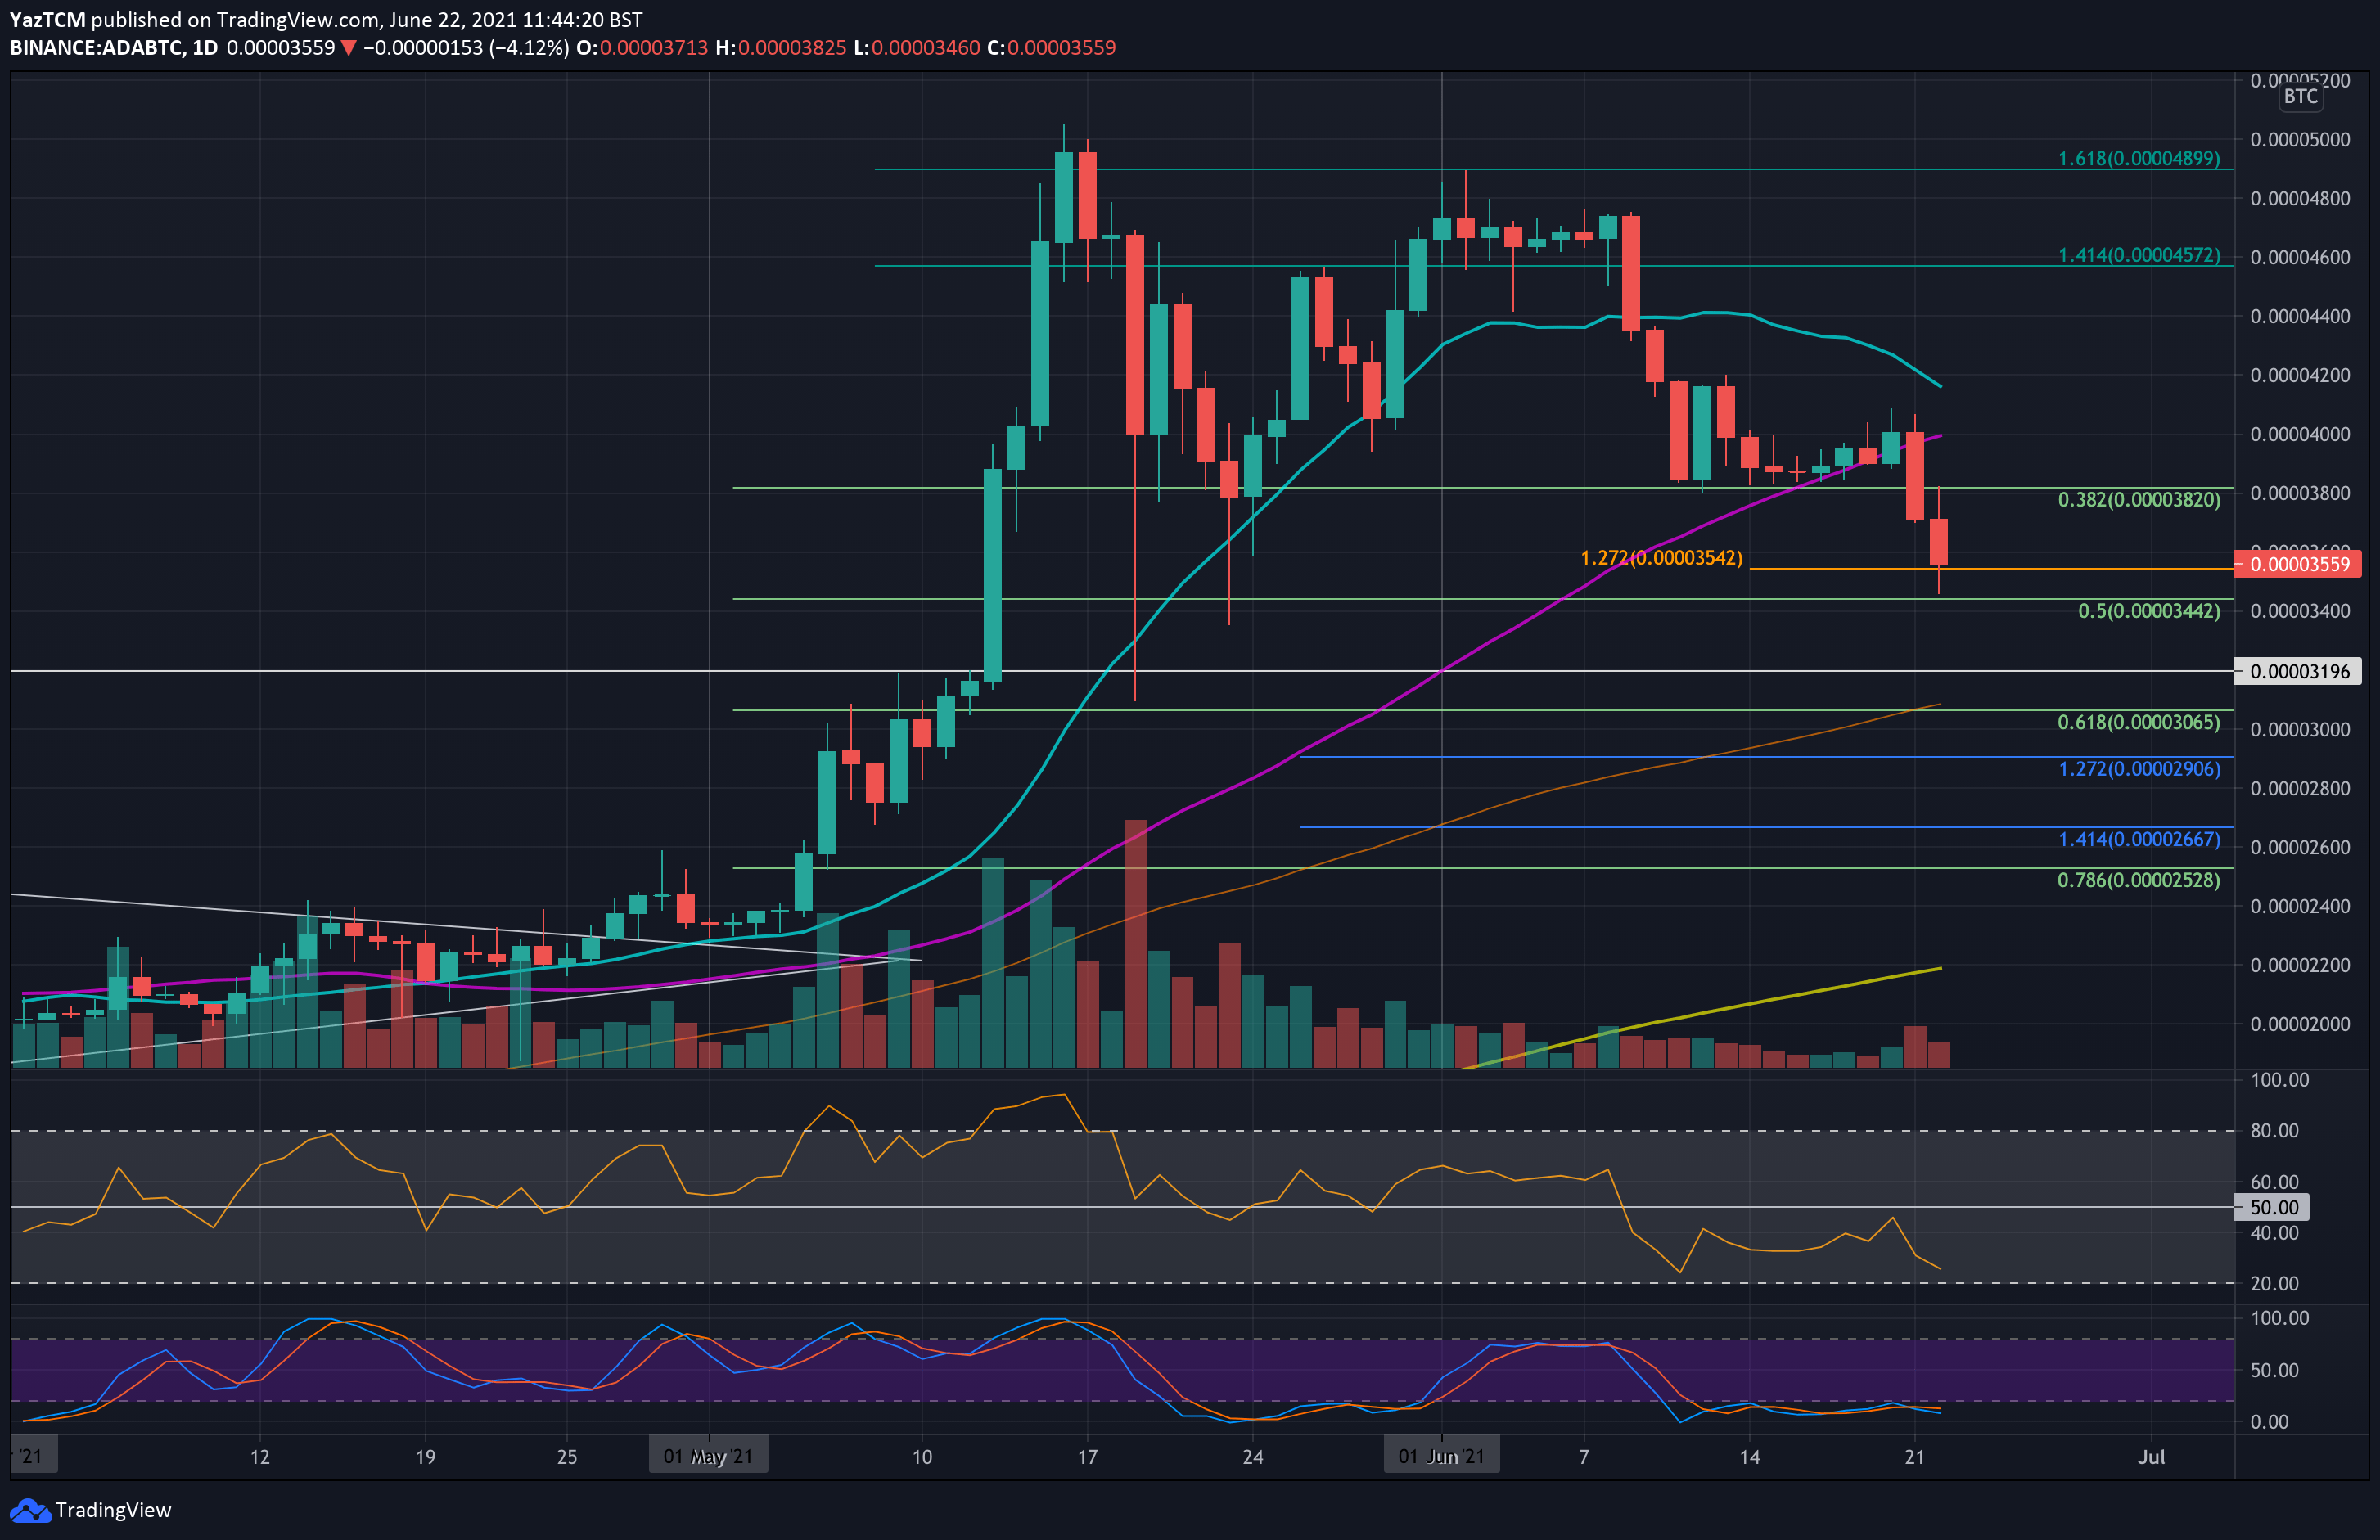
ADA-BTC Short Term Price Prediction
Moving forward, the first support lies at 3440 SAT (.5 Fib). This is followed by 3200 SAT, 3070 SAT (.618 Fib & 100-day MA), and 3000 SAT.
On the other side, the first resistance lies at 3600 SAT. This is followed by 3800 SAT, 4000 SAT (50-day MA), and 4190 SAT (20-day MA).
The RSI is in bearish territory and is still not oversold. This indicates that there might be some more selling pressure on the way.