ADA/USD – ADA Bounces From Ascending Price Channel Support Key Support Levels: .95 – , .20, .42.Key Resistance Levels: .72, .58, .50. ADA has been trading inside an ascending price channel for the entire period of August. The cryptocurrency recently hit resistance at .95, provided by a 1.272 Fib Extension, and rolled over from there over the weekend. Cardano’s price found support at the lower boundary of the ascending price channel and has since rebounded back above .80. The resistance near will be the next crucial level for the market to break to be able to continue the bull run. ADA/USD Daily Chart. Source: TradingView.ADA-USD Short Term Price Prediction Looking ahead, the first support lies between .95 (1.272 Fib extension) and . Beyond ,
Topics:
Yaz Sheikh considers the following as important: ADABTC, ADAUSD, Cardano (ADA) Price, Price Analysis
This could be interesting, too:
Jordan Lyanchev writes Cardano (ADA) Surpasses Dogecoin After 55% Surge
Jordan Lyanchev writes Trump Confirms Work on Strategic Crypto Reserve: XRP, ADA, SOL Included
Dimitar Dzhondzhorov writes Millions of ADA Sold by Cardano Whales During Market Crash – Will the Decline Continue?
Jordan Lyanchev writes Here’s How Cardano’s 17% Weekly Correction Can Help ADA Hit This Cycle: Analyst
ADA/USD – ADA Bounces From Ascending Price Channel Support
Key Support Levels: $2.95 – $3, $3.20, $3.42.
Key Resistance Levels: $2.72, $2.58, $2.50.
ADA has been trading inside an ascending price channel for the entire period of August. The cryptocurrency recently hit resistance at $2.95, provided by a 1.272 Fib Extension, and rolled over from there over the weekend.
Cardano’s price found support at the lower boundary of the ascending price channel and has since rebounded back above $2.80. The resistance near $3 will be the next crucial level for the market to break to be able to continue the bull run.
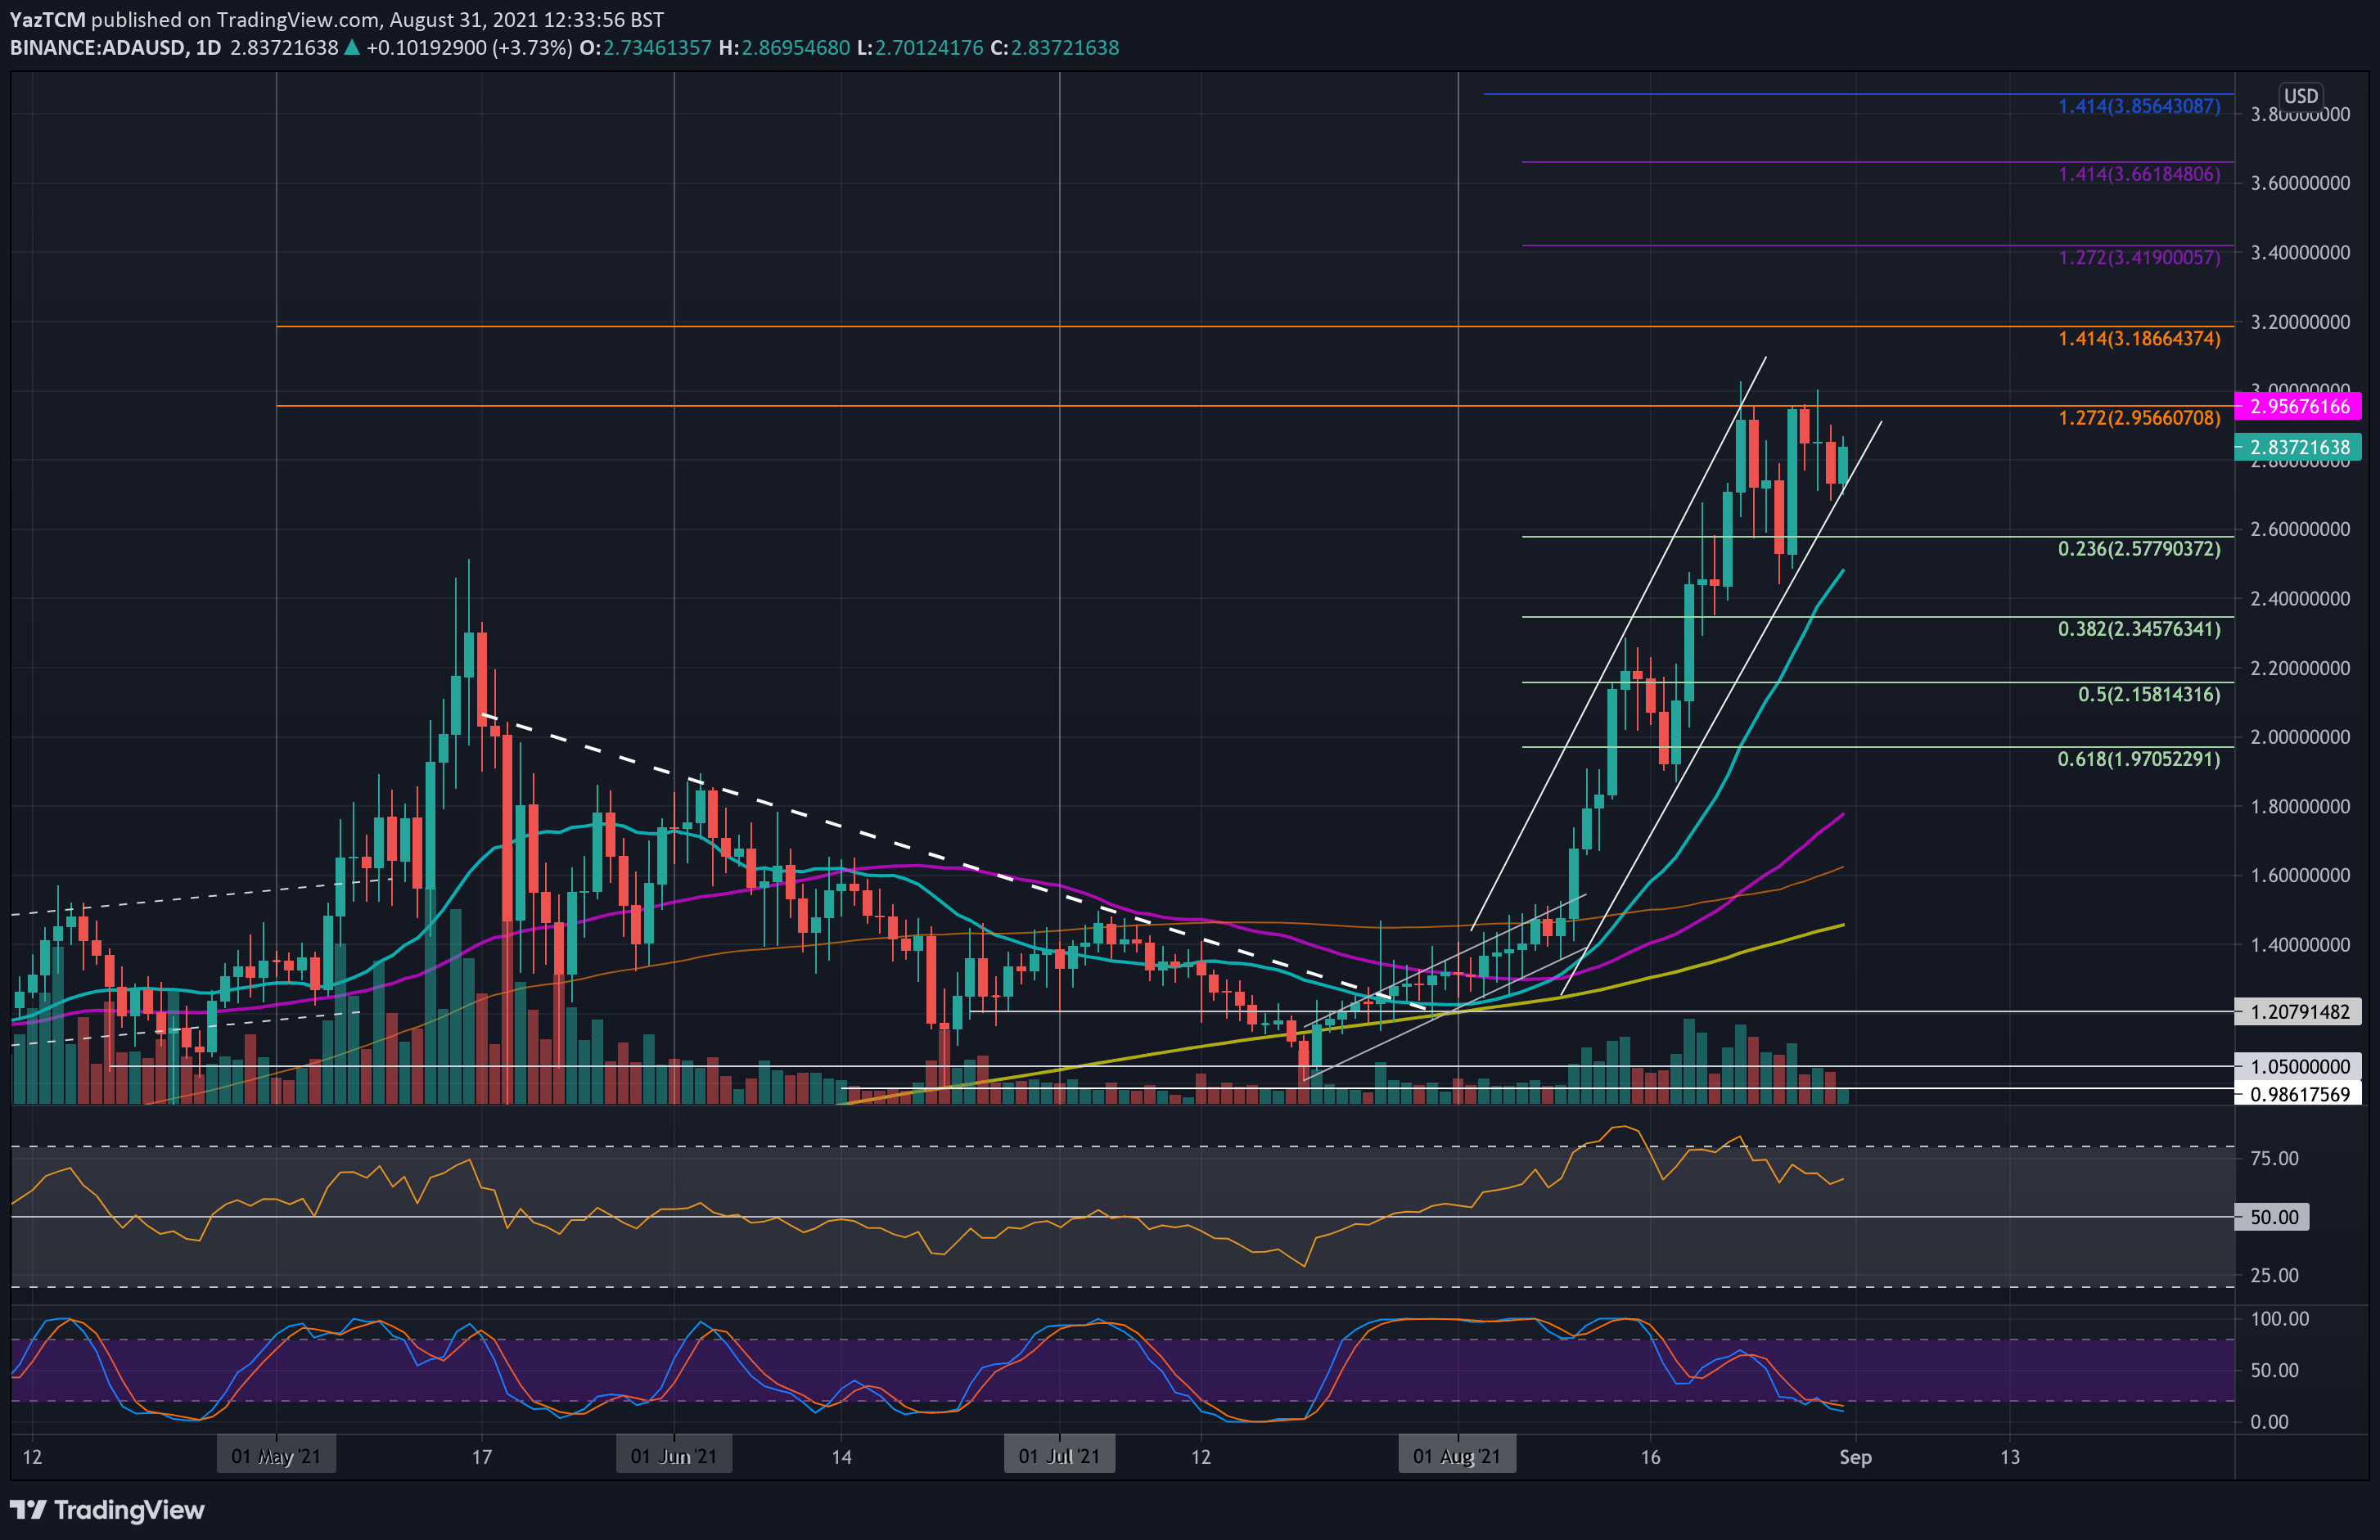
ADA-USD Short Term Price Prediction
Looking ahead, the first support lies between $2.95 (1.272 Fib extension) and $3. Beyond $3, added resistance lies at $3.20 (1.414 Fib Extension), $3.42 (1.272 Fib Extension – purple), $3.66 (1.414 Fib Extension – purple), and $3.80.
On the other side, the first support lies at the lower angle of the price channel, around $2.72. This is followed by $2.58 (.236 Fib), $2.50 (20-day MA), $2.35 (.382 Fib), and $2.15 (.5 Fib).
The RSI is heading lower, indicating the bullish momentum is fading a little. However, it still remains strong in the bullish favor as it sits above the midline.
ADA/BTC – Bulls Set Target For 6000 SAT ATH Price
Key Support Levels: 5800 SAT, 5360 SAT, 5200 SAT.
Key Resistance Levels: 6000 SAT, 6200 SAT, 6300 SAT.
ADA continues to trade inside its own ascending price channel against BTC. The cryptocurrency reached as high as 6000 SAT last week as it set a new ATH price there.
Over the weekend, ADA pulled back from the 6000 SAT resistance but managed to maintain the support at 5800 SAT. Today, it bounced higher from the 5800 SAT support and pushed higher from the lower angle of the price channel. The 6000 SAT resistance is the next target to break to continue the bull run.

ADA-BTC Short Term Price Prediction
Moving forward, if the buyers break 6000 SAT, the first resistance lies at 6200 SAT (1.414 Fib Extension – green). This is followed by 6300 SAT (1.272 Fib Extension), 6540 SAT (1.414 Fib Extension), and 6560 SAT (1.618 Fib Extension – green).
On the other side, the first support lies at 5800 SAT. Beneath the price channel, support lies at 5360 SAT (.236 Fib), 5200 SAT (20-day MA), and 5000 SAT (.382 Fib).
Again, the RSI remains above the midline as the buyers control the market momentum completely.