ADA/USD – Bulls Attempt To Defend .10.Key Support Levels: .07, .00, %excerpt%.944.Key Resistance Levels: .20, .32, .40.ADA is down by a total of 13.5% over the past week as it slips from above .30 to reach the current .11 level. There was a bearish divergence that was playing out from mid-Feb to the start of March that caused the market to roll over from .30 over the past week.After rolling over, the coin dropped beneath .30 and continued to fall until the market found support at .10. The bulls have done well to close every daily candle this week above this level. It is also bolstered by an ascending trend line that dates back to mid-Feb 2021.ADA/USD Daily Chart. Source: TradingViewADA-USD Short Term Price PredictionLooking ahead, if the bulls can rebound from .10, the
Topics:
Yaz Sheikh considers the following as important: ADABTC, ADAUSD, Cardano (ADA) Price, Price Analysis
This could be interesting, too:
Jordan Lyanchev writes Cardano (ADA) Surpasses Dogecoin After 55% Surge
Jordan Lyanchev writes Trump Confirms Work on Strategic Crypto Reserve: XRP, ADA, SOL Included
Dimitar Dzhondzhorov writes Millions of ADA Sold by Cardano Whales During Market Crash – Will the Decline Continue?
Jordan Lyanchev writes Here’s How Cardano’s 17% Weekly Correction Can Help ADA Hit This Cycle: Analyst
ADA/USD – Bulls Attempt To Defend $1.10.
Key Support Levels: $1.07, $1.00, $0.944.
Key Resistance Levels: $1.20, $1.32, $1.40.
ADA is down by a total of 13.5% over the past week as it slips from above $1.30 to reach the current $1.11 level. There was a bearish divergence that was playing out from mid-Feb to the start of March that caused the market to roll over from $1.30 over the past week.
After rolling over, the coin dropped beneath $1.30 and continued to fall until the market found support at $1.10. The bulls have done well to close every daily candle this week above this level. It is also bolstered by an ascending trend line that dates back to mid-Feb 2021.
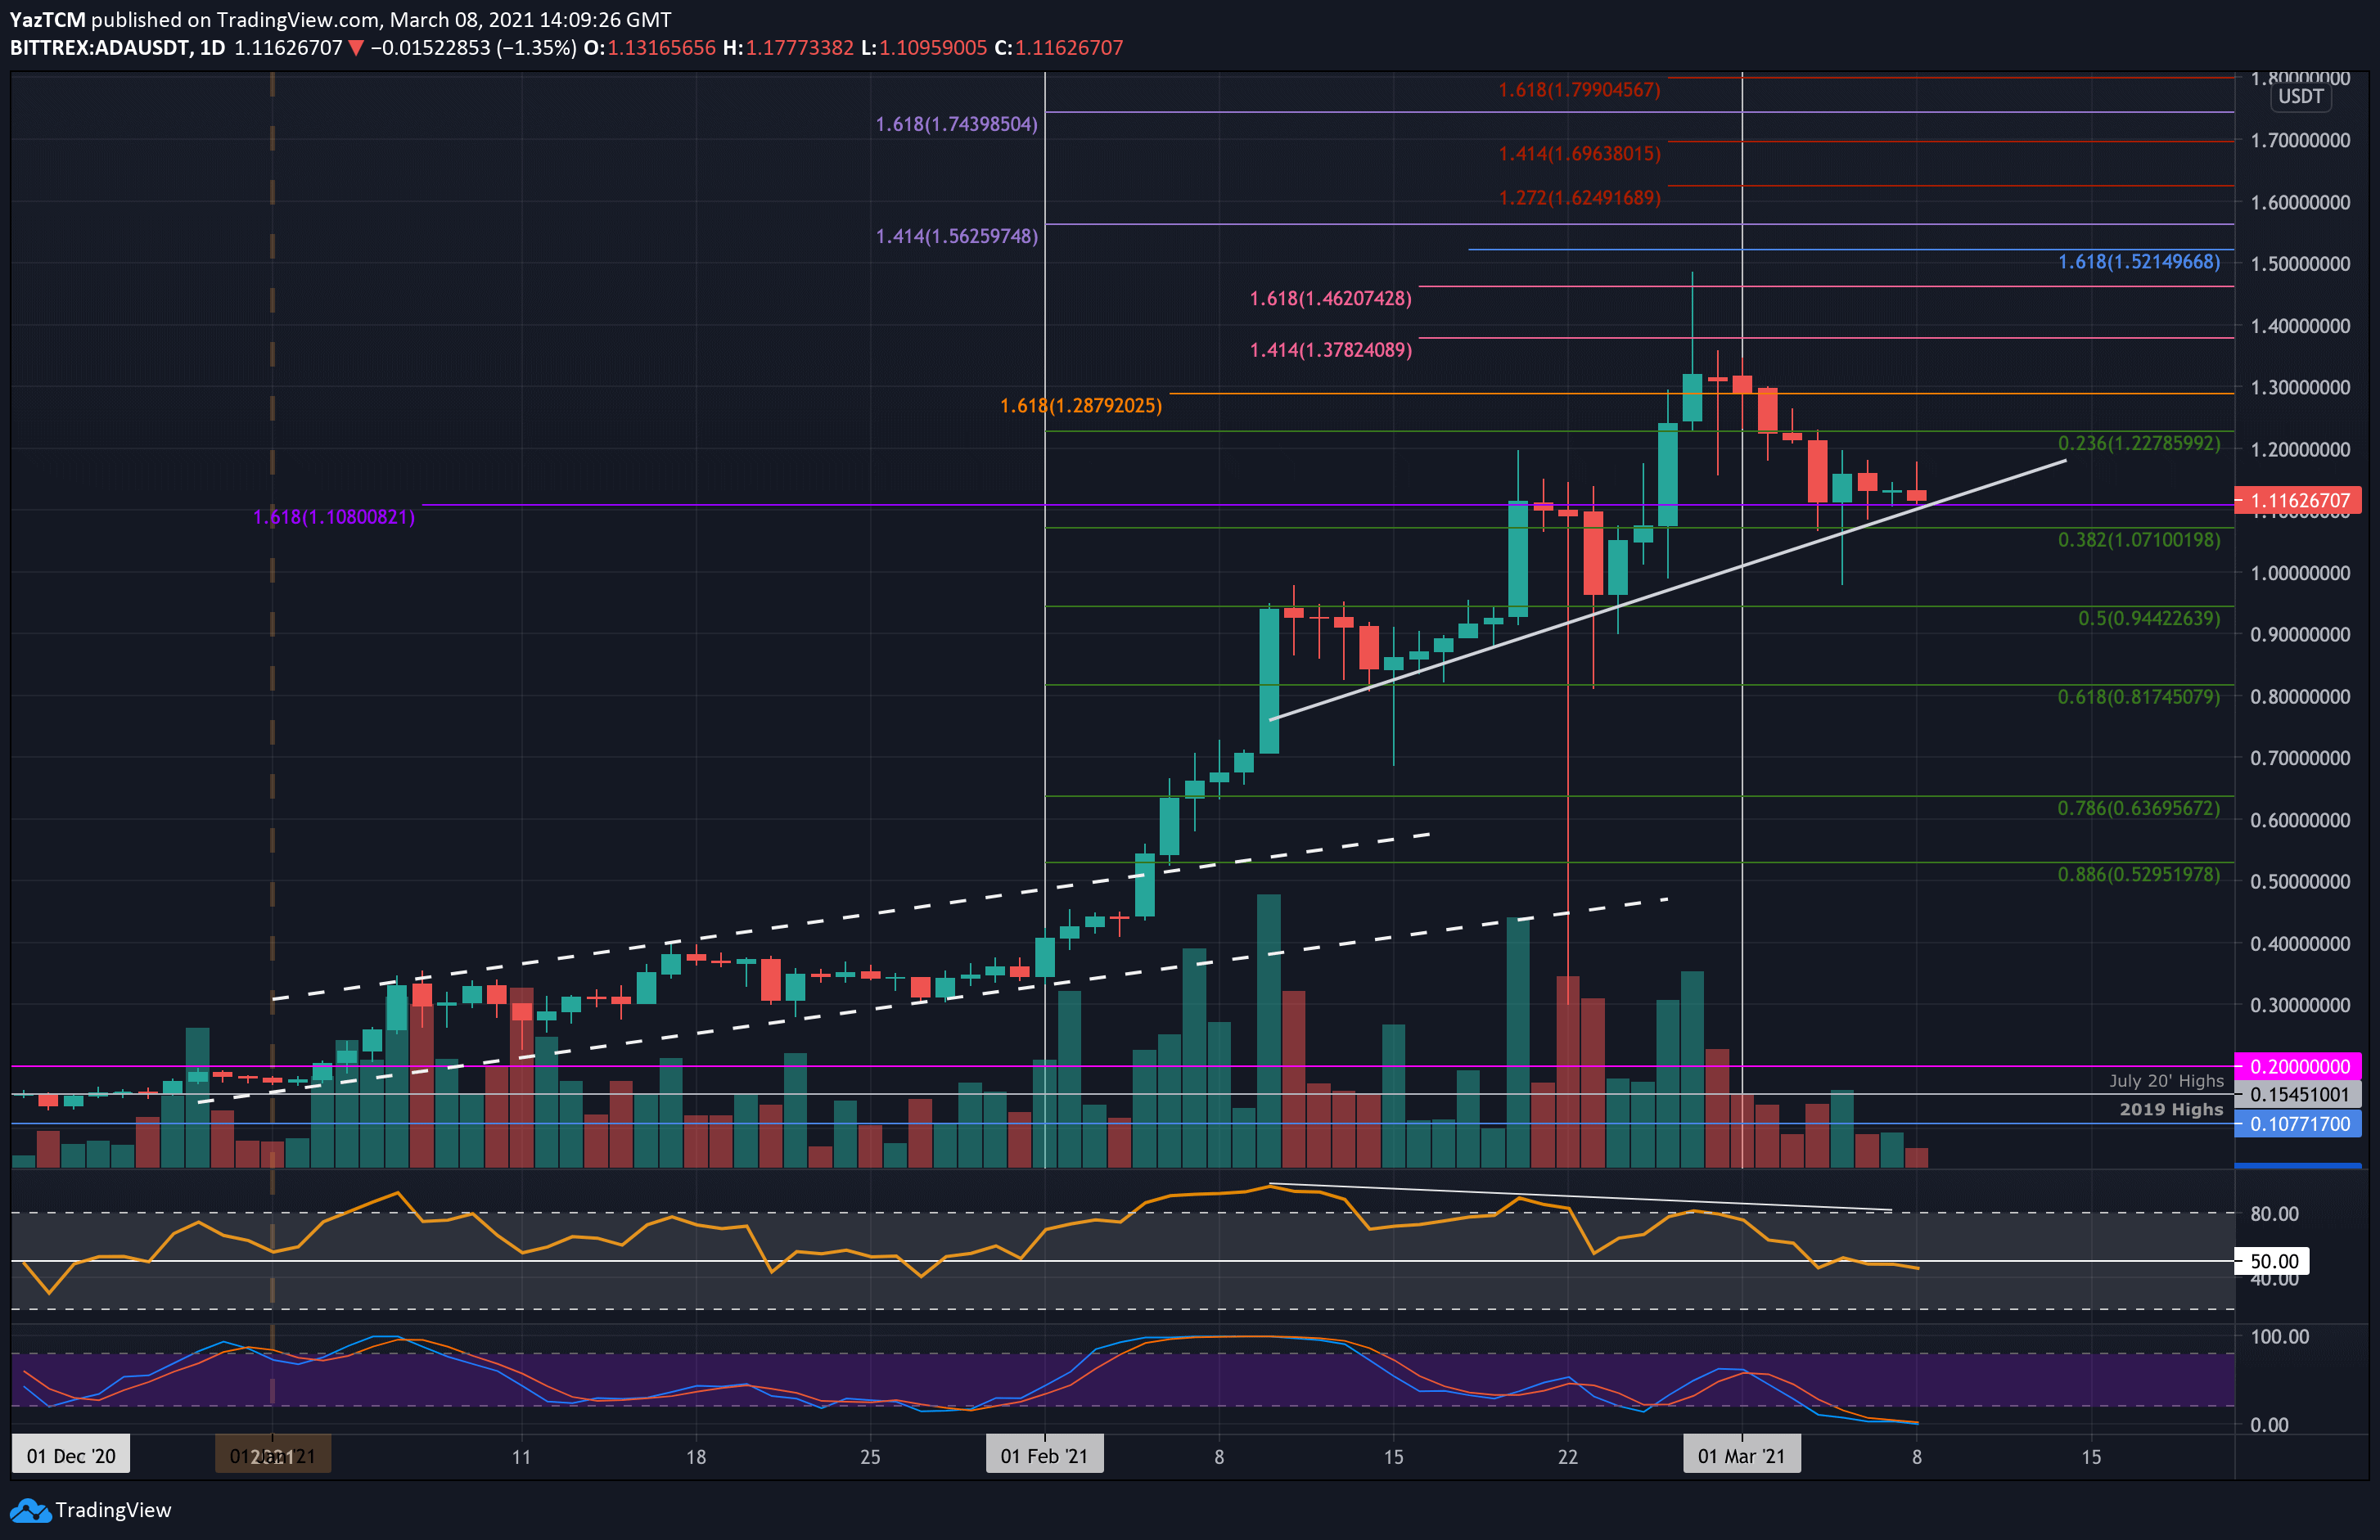
ADA-USD Short Term Price Prediction
Looking ahead, if the bulls can rebound from $1.10, the first level of resistance lies at $1.20. This is followed by $1.32 (February High-Day Closing price), $1.40, and $1.48 (ATH Price).
On the other side, if the sellers break beneath $1.10 and fall below the ascending trend line, support first lies at $1.07 (.382 Fib). This is followed by $1.00, $0.95 (.5 Fib), and $0.817 (.618 Fib).
The RSI is now slightly beneath the midline, indicating that the bears are in the process of taking over the market momentum. If the RSI continues to dip, ADA can be expected to break beneath the ascending trend line.
ADA/BTC – Bulls Meet Ascending Trend Line Support
Key Support Levels: 2200 SAT, 2086 SAT, 1950 SAT.
Key Resistance Levels: 2300 SAT, 2456 SAT, 2600 SAT.
ADA has also been declining against bitcoin over the past week. It had set a fresh 2021 high at 3195 SAT toward the end of February but started to drop from there. Toward the end of last week, ADA managed to find support at 2300 SAT (.5 Fib Retracement).
Unfortunately, the bears pushed beneath this support over the weekend as ADA falls into 2200 SAT and meets the support at the ascending trend line.
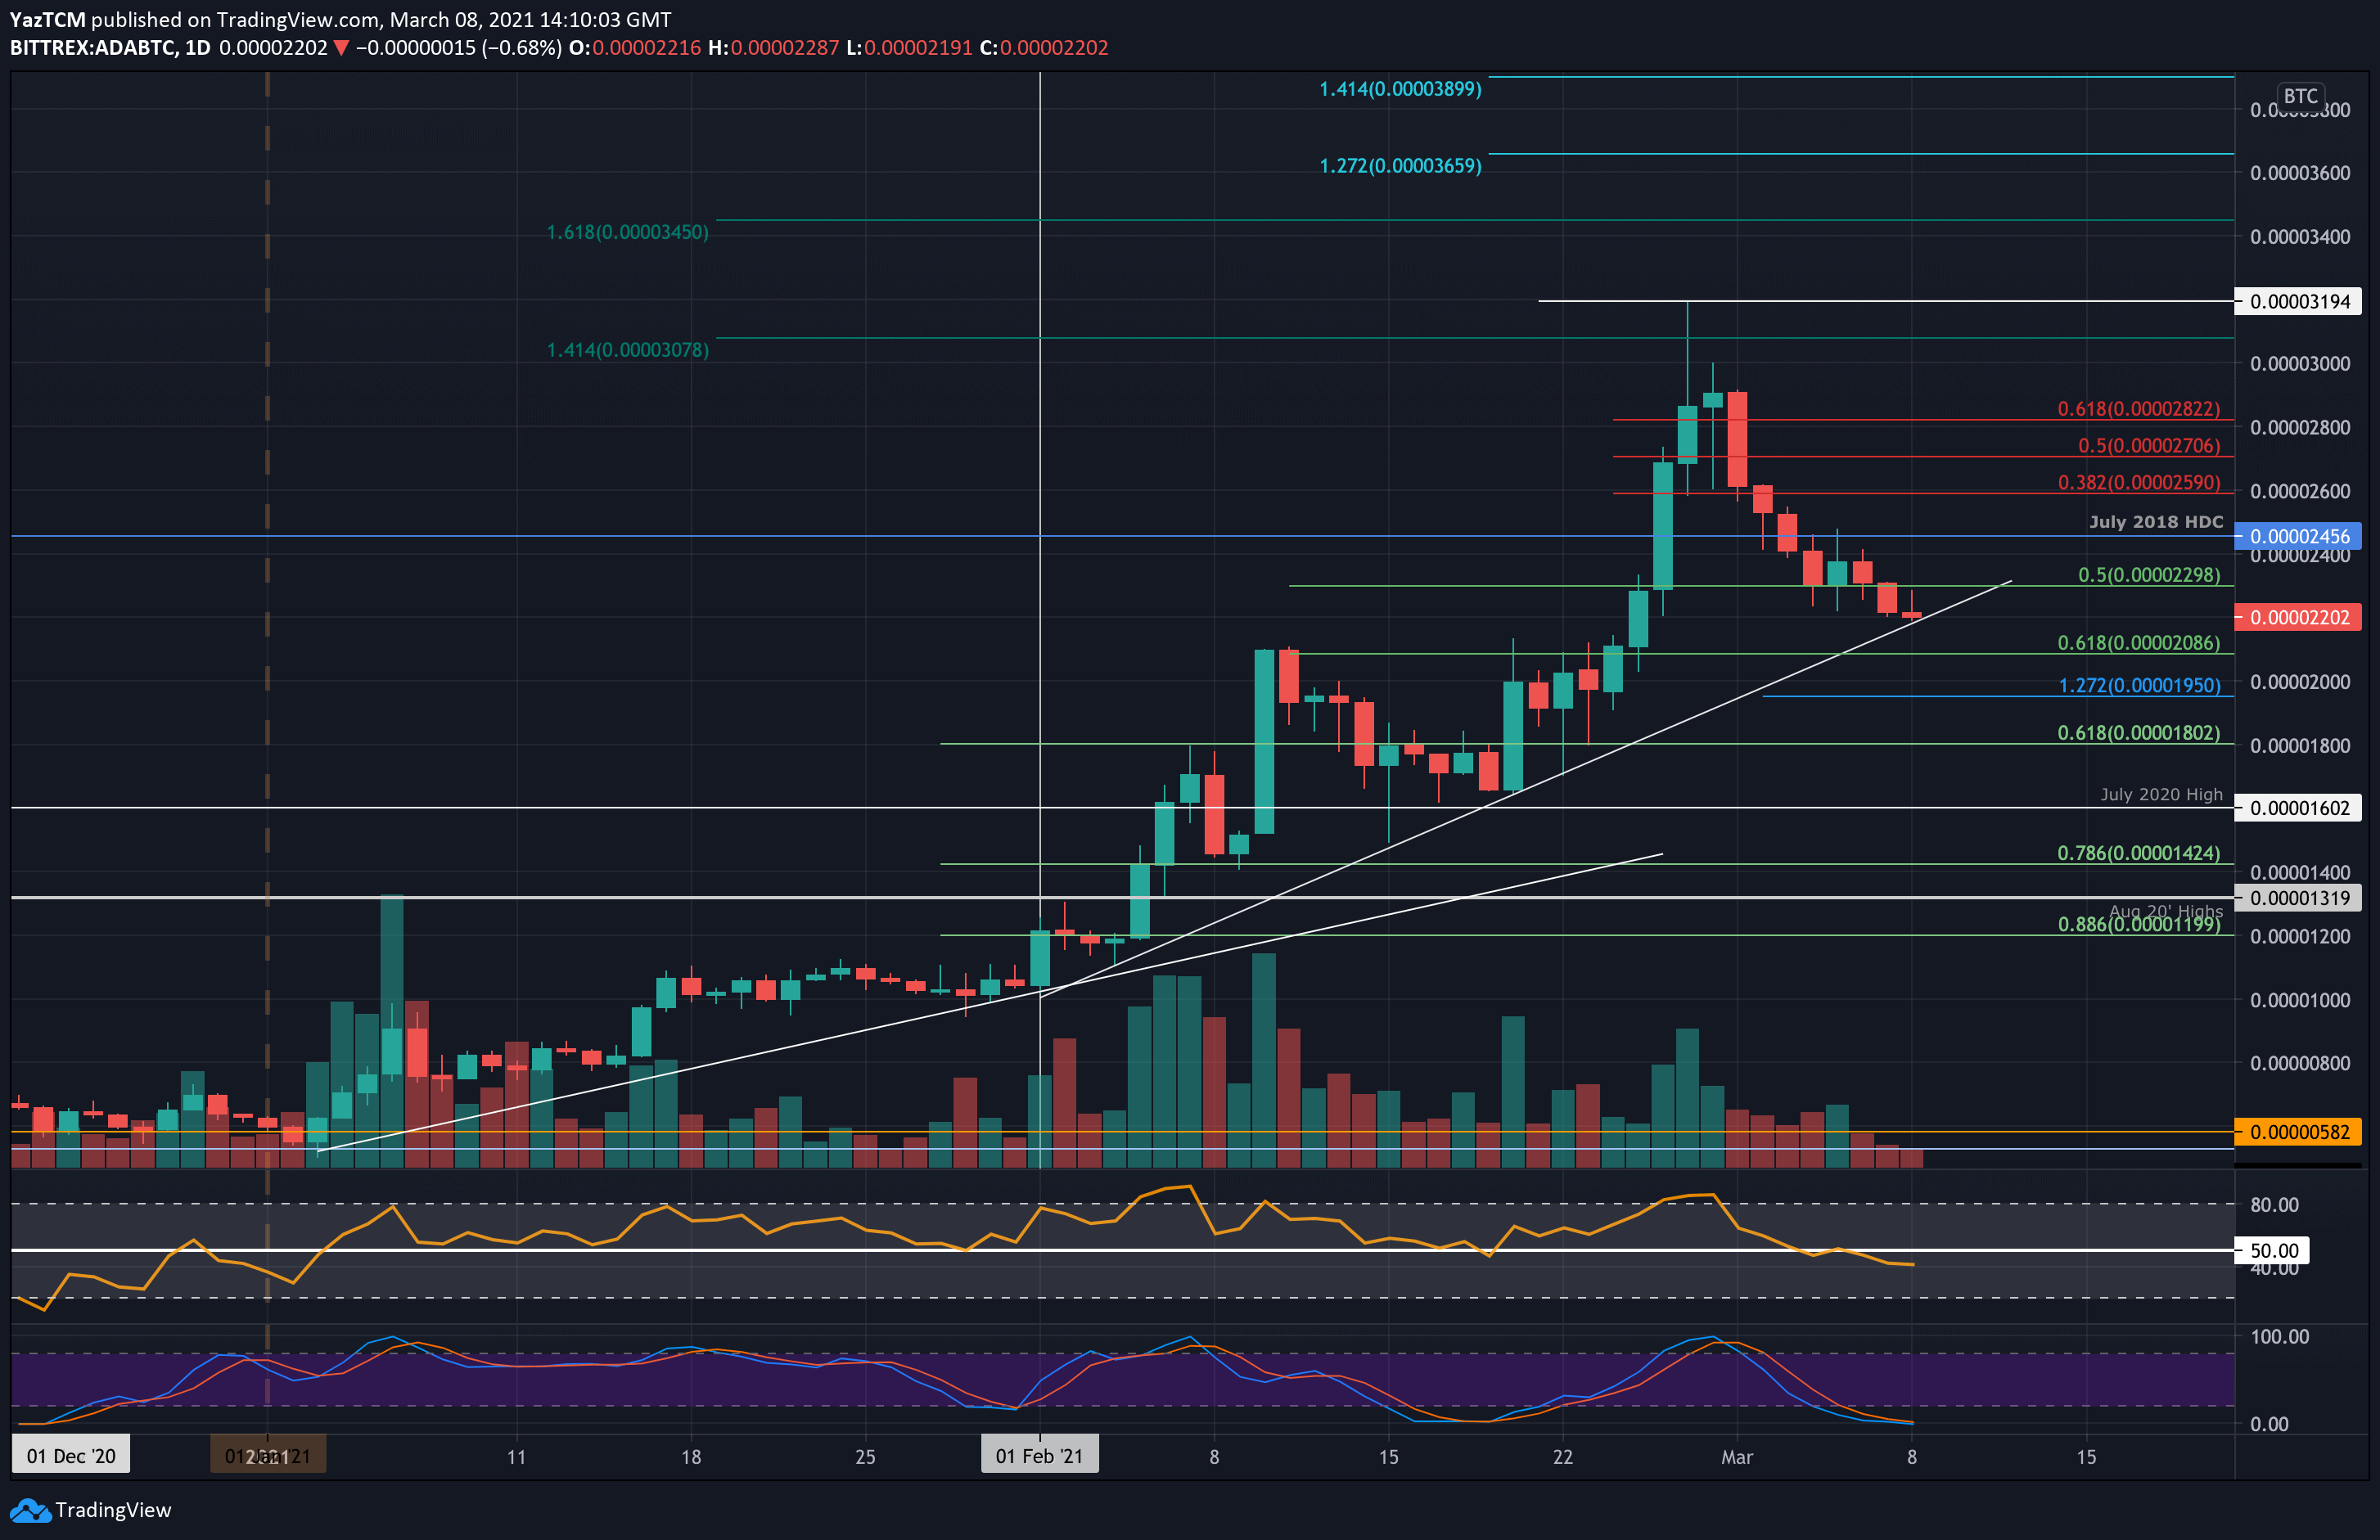
ADA-BTC Short Term Price Prediction
Looking ahead, the first level of support beneath the trend line lies at 2086 SAT (.618 Fib). This is followed by 1950 SAT (downside 1.272 Fib Extension), 1800 SAT (long term .618 Fib), and 1600 SAT (July 2020 High).
On the other side, the first level of resistance lies at 2300 SAT. This is followed by 2456 SAT (July 2018 High-Day Close), 2600 SAT, and 2700 SAT.
Likewise, the RSI here is beneath the midline, indicating the bears are in control of the market momentum.