ADA/USD – Cardano Climbs Into 4th Ranked PositionKey Support Levels: %excerpt%.6, %excerpt%.54, %excerpt%.5.Key Resistance Levels: %excerpt%.67, %excerpt%.7, %excerpt%.78.Over the past three days, Cardano has managed to surge by a total of 45% after rising from %excerpt%.44 to reach the current %excerpt%.66 level. On Friday, the cryptocurrency penetrated beyond the upper boundary of an ascending price channel as it turned parabolic.Yesterday, it broke beyond resistance at %excerpt%.55, allowing it to climb above %excerpt%.6 and reach as high as %excerpt%.67. Today, It spiked as high as %excerpt%.7 before dropping back into the %excerpt%.66 level.A strong increase in volume has accompanied the recent price surge. It began rising at the start of 2021 but faded at the tail end of January. However, in February, the volume has started to pick up again, allowing ADA to push
Topics:
Yaz Sheikh considers the following as important: ADABTC, ADAUSD, Cardano (ADA) Price, Price Analysis
This could be interesting, too:
Jordan Lyanchev writes Cardano (ADA) Surpasses Dogecoin After 55% Surge
Jordan Lyanchev writes Trump Confirms Work on Strategic Crypto Reserve: XRP, ADA, SOL Included
Dimitar Dzhondzhorov writes Millions of ADA Sold by Cardano Whales During Market Crash – Will the Decline Continue?
Jordan Lyanchev writes Here’s How Cardano’s 17% Weekly Correction Can Help ADA Hit This Cycle: Analyst
ADA/USD – Cardano Climbs Into 4th Ranked Position
Key Support Levels: $0.6, $0.54, $0.5.
Key Resistance Levels: $0.67, $0.7, $0.78.
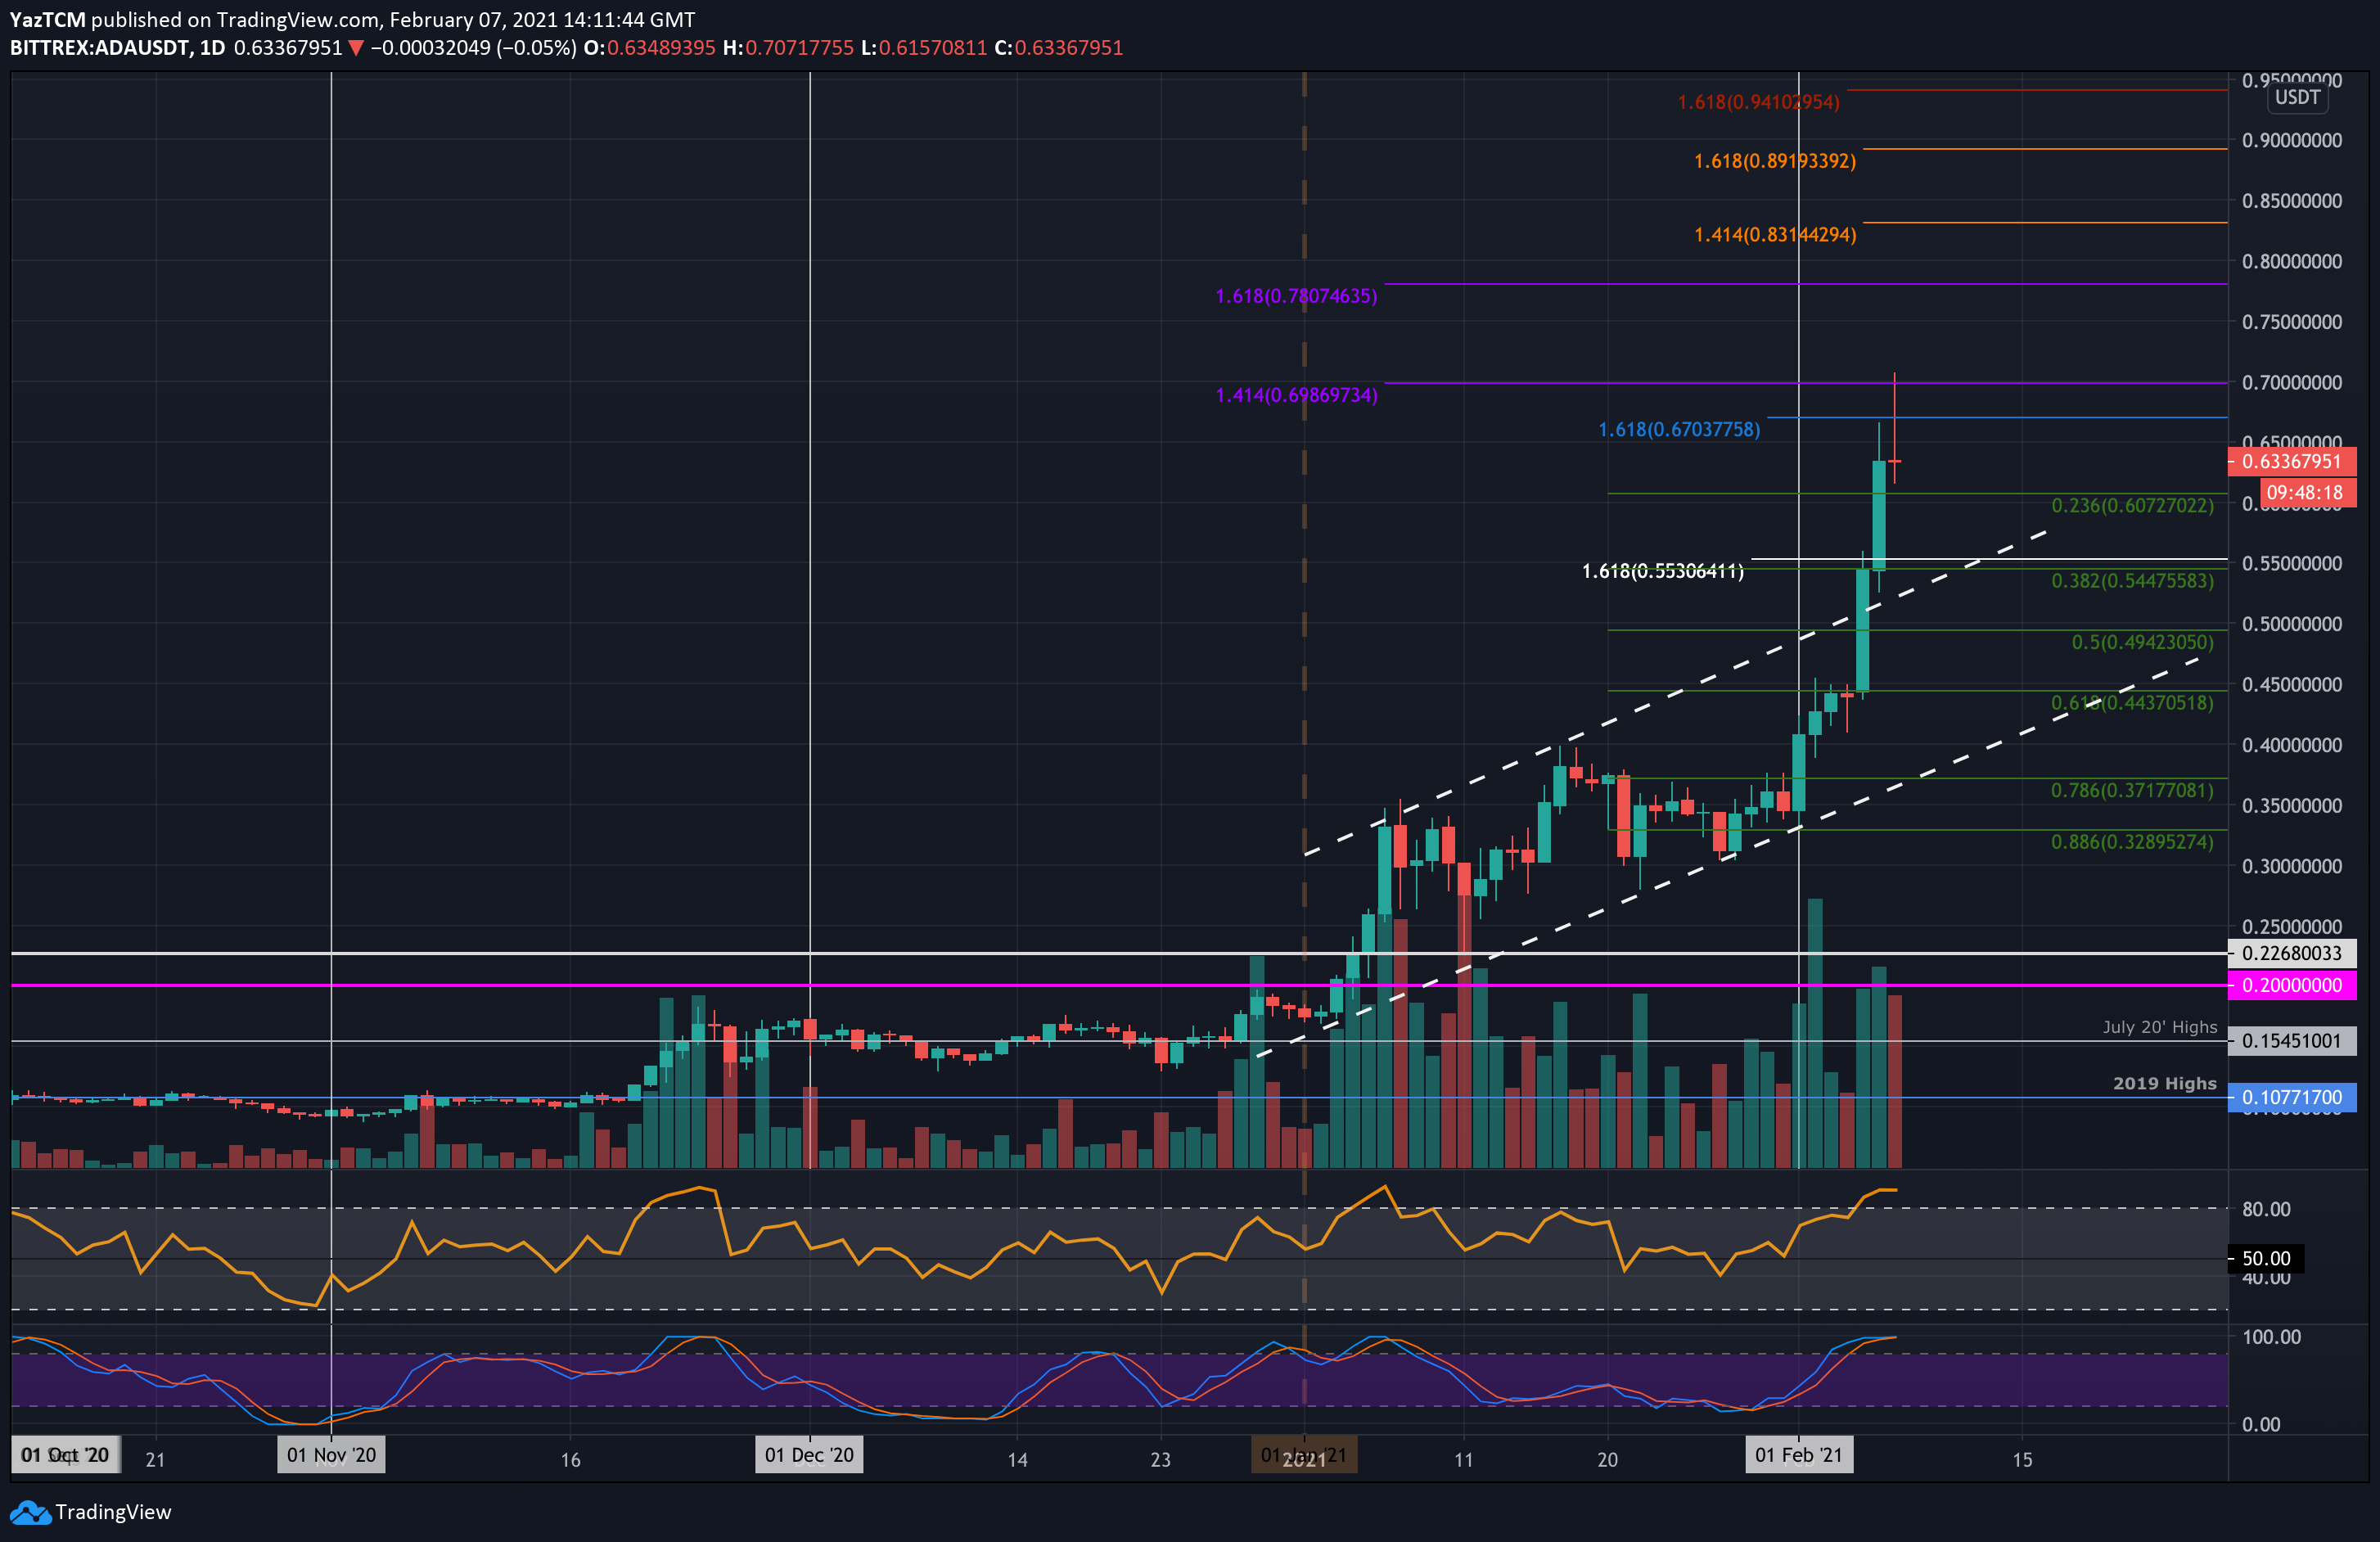
Over the past three days, Cardano has managed to surge by a total of 45% after rising from $0.44 to reach the current $0.66 level. On Friday, the cryptocurrency penetrated beyond the upper boundary of an ascending price channel as it turned parabolic.
Yesterday, it broke beyond resistance at $0.55, allowing it to climb above $0.6 and reach as high as $0.67. Today, It spiked as high as $0.7 before dropping back into the $0.66 level.
A strong increase in volume has accompanied the recent price surge. It began rising at the start of 2021 but faded at the tail end of January. However, in February, the volume has started to pick up again, allowing ADA to push higher.
ADA-USD Short Term Price Prediction
Looking ahead, the first level of strong resistance lies at $0.67 (1.618 Fib Extension). This is followed by $0.7, $0.78 (1.618 Fib Extension – purple), and $0.831 (1.414 Fib Extension – orange). Further resistance lies at $0.89, $0.941, and $1.00.
On the other side, the first support lies at $0.6 (.236 Fib). This is followed by $0.54 (.382 Fib), $0.5 (.5 Fib), and $0.44 (.618 Fib).
The RSI is overextended as it trades above 80 in overbought conditions. This suggests the bulls might need a retracement before being able to continue higher. Additionally, the Stochastic RSI is in overbought conditions and is primed for a bearish crossover signal that will lower the market.
ADA/BTC – Bulls Reach Fresh 22-Month Highs.
Key Support Levels: 1600 SAT, 1500 SAT, 1470 SAT.
Key Resistance Levels: 1755 SAT, 1800 SAT, 1930 SAT.
Against Bitcoin, ADA managed to break beyond the July 2020 highs today at 1600 SAT. This allowed it to surge to its highest price in 22 months at 1800 SAT. The coin had started to surge on Friday as it pushed above 1200 SAT to break beyond the August 2020 peak at 1320 SAT.
The market has turned truly parabolic and has already increased over 200% from the January 2021 lows.
Similarly, the recent price hikes have been accompanied by a strong surge in volume as the bulls start to target ADA as a major portfolio option.

ADA-BTC Short Term Price Prediction
Looking ahead, the first level of resistance lies at 1755 SAT (bearish .886 Fib). This is followed by 1800 SAT, 1930 SAT (1.272 Fib Extension), 2000 SAT, and 2095 SAT (1.414 Fib Extension). Added resistance lies at 2240 SAT (short term 1.618 Fib Extension) and 2333 SAT.
On the other side, the first support lies at 1600 SAT (July 2020 Highs). This is followed by 1500 SAT (July 2020 High-Day Closing Price), 1471 SAT (.382 Fib), and 1370 SAT (.5 Fib).
Likewise, the RSI is extremely overbought as the bullish momentum is the highest it has been since July 2020. This suggests the buyers might be a little overextended.