ADA/USD – Bulls Struggle To Make Ground Above 20-day MA Key Support Levels: .20, .00, .95.Key Resistance Levels: .22, .36, .50. ADA rebounded from the support at (.618 Fib) on Friday and broke above the September descending trend line. Although it did spike above the 20-day MA to reach as high as .36 (bearish .382 Fib), it could never close above that level. Over the weekend, ADA continued to trade beneath the 20-day MA as it failed to establish any sustainable momentum above it. A strong closing candle above it would signal that ADA is ready to head back toward the September highs. ADA/USD Daily Chart. Source: TradingView.ADA-USD Short Term Price Prediction Looking ahead, the first resistance lies at the 20-day MA, around .22. This is followed by .36
Topics:
Yaz Sheikh considers the following as important: ADABTC, ADAUSD, Cardano (ADA) Price, Price Analysis
This could be interesting, too:
Jordan Lyanchev writes Cardano (ADA) Surpasses Dogecoin After 55% Surge
Jordan Lyanchev writes Trump Confirms Work on Strategic Crypto Reserve: XRP, ADA, SOL Included
Dimitar Dzhondzhorov writes Millions of ADA Sold by Cardano Whales During Market Crash – Will the Decline Continue?
Jordan Lyanchev writes Here’s How Cardano’s 17% Weekly Correction Can Help ADA Hit This Cycle: Analyst
ADA/USD – Bulls Struggle To Make Ground Above 20-day MA
Key Support Levels: $2.20, $2.00, $1.95.
Key Resistance Levels: $2.22, $2.36, $2.50.
ADA rebounded from the support at $2 (.618 Fib) on Friday and broke above the September descending trend line. Although it did spike above the 20-day MA to reach as high as $2.36 (bearish .382 Fib), it could never close above that level.
Over the weekend, ADA continued to trade beneath the 20-day MA as it failed to establish any sustainable momentum above it. A strong closing candle above it would signal that ADA is ready to head back toward the September highs.
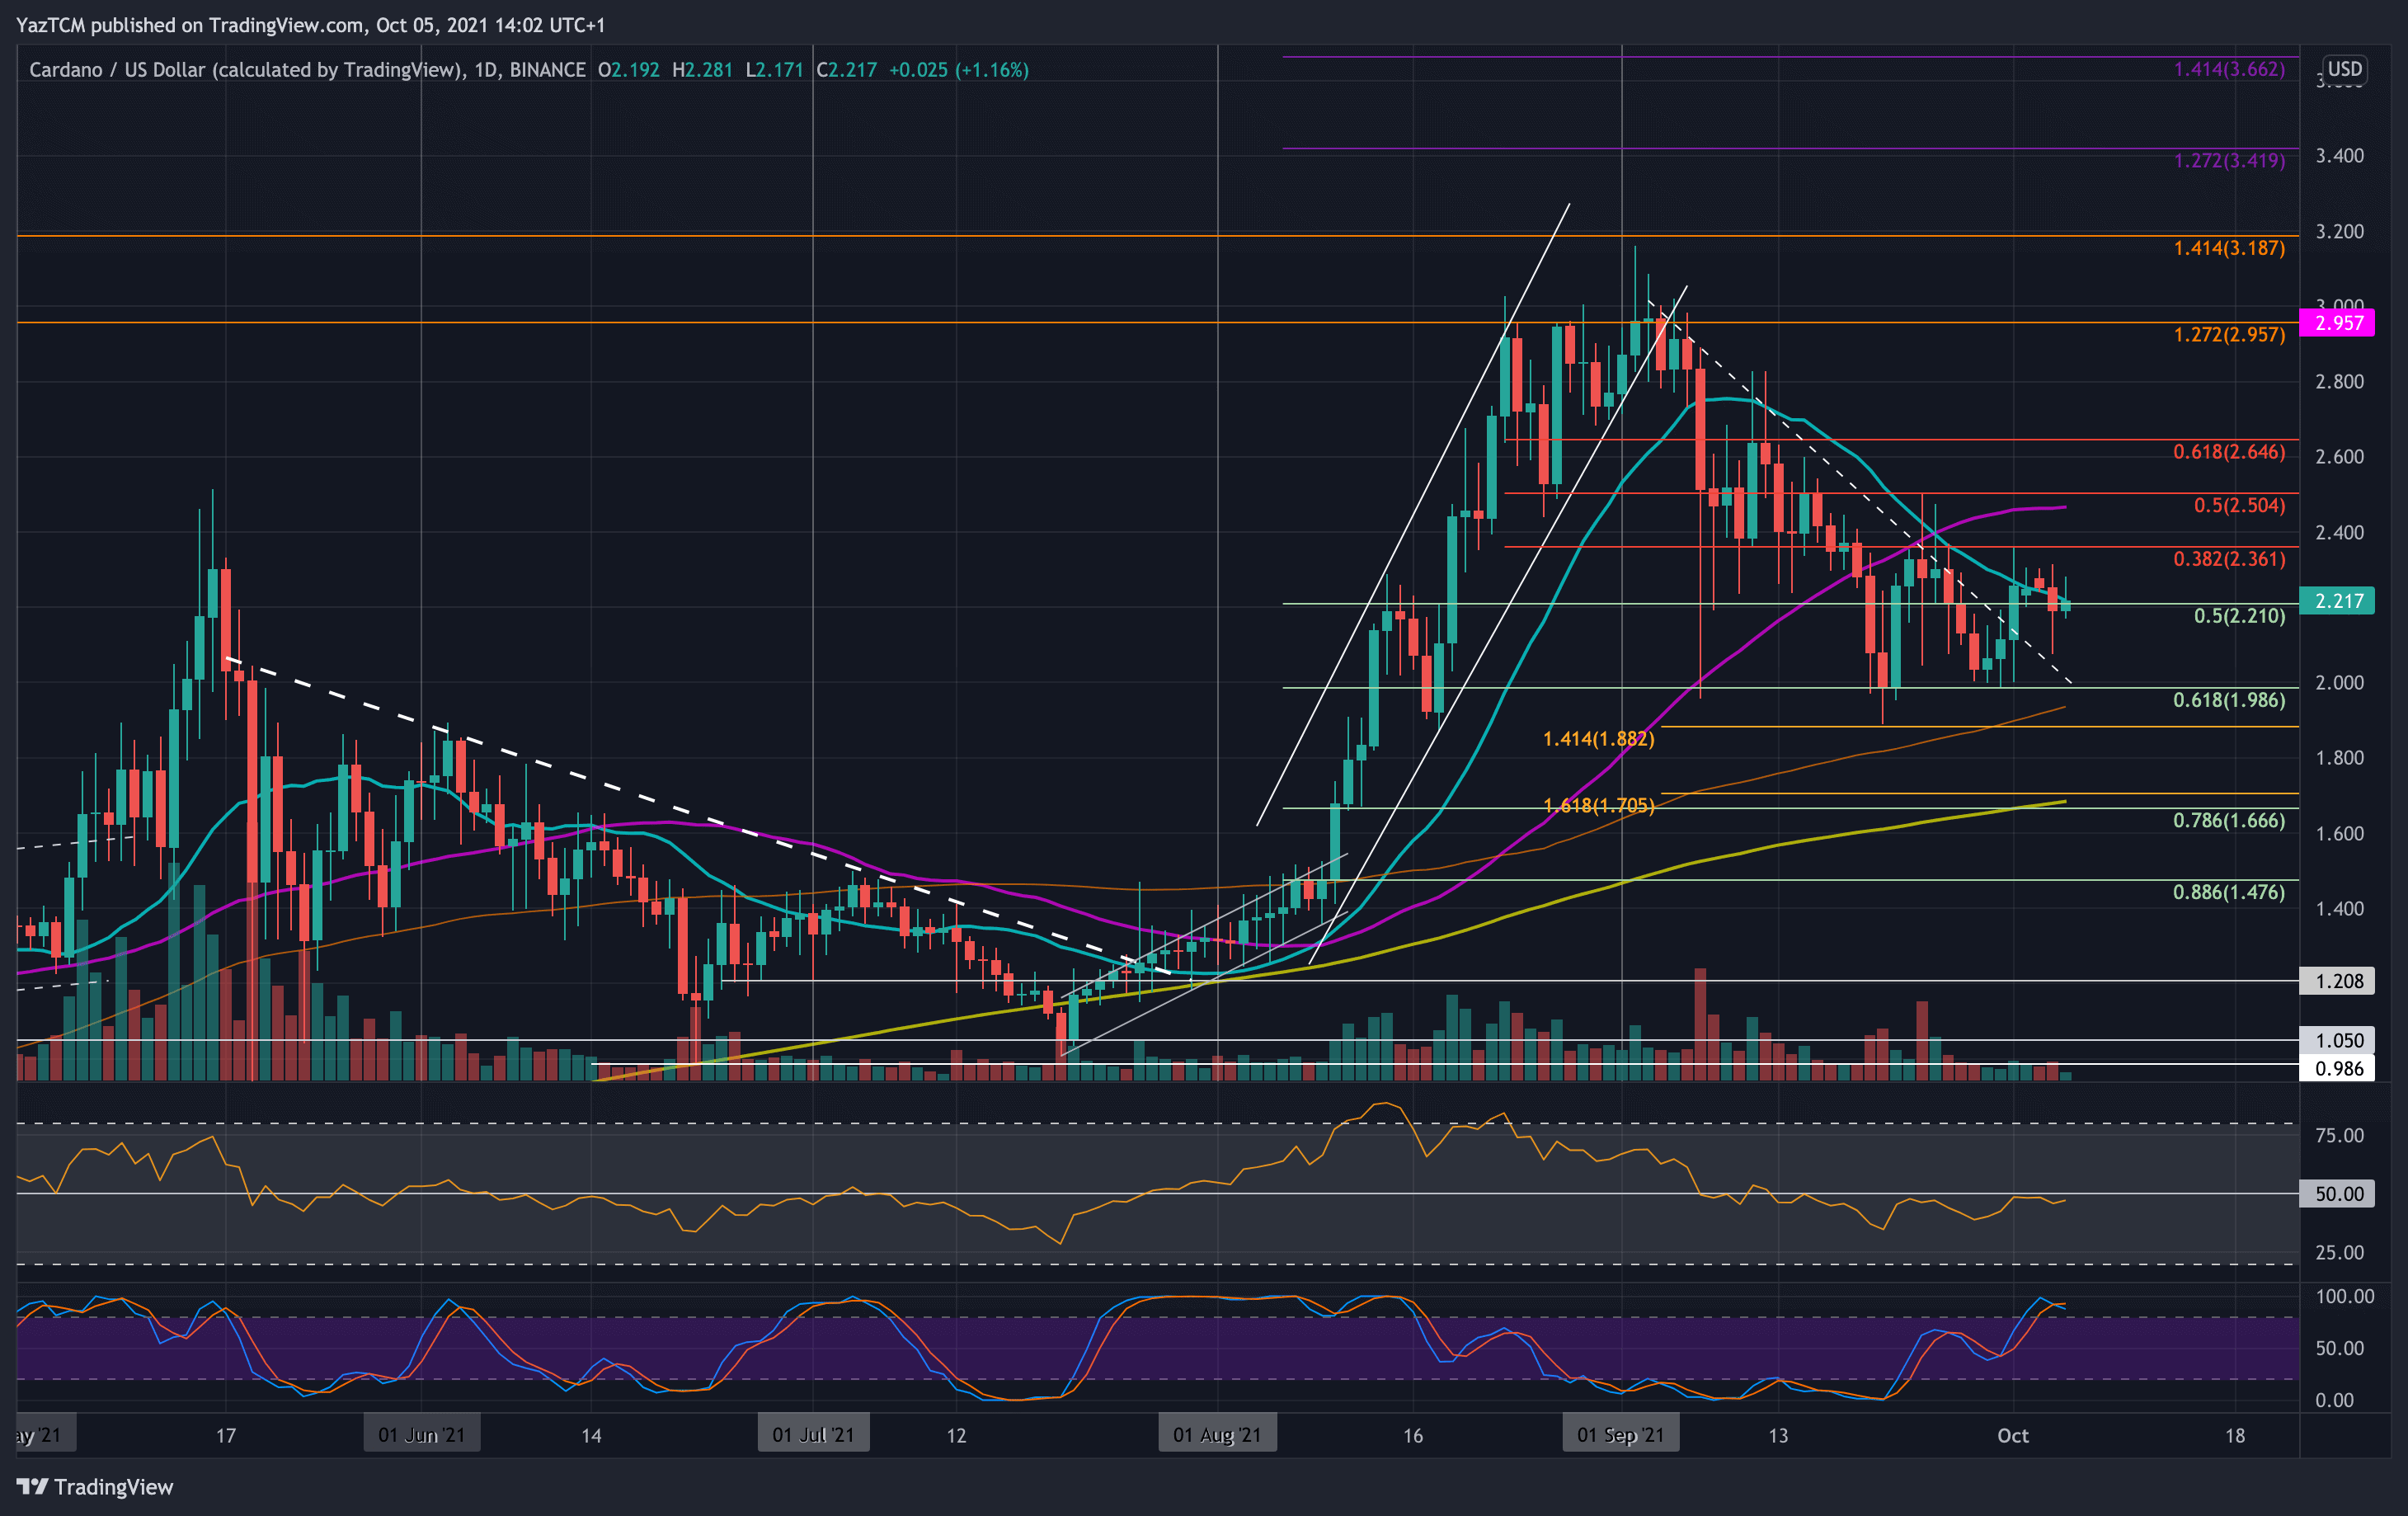
ADA-USD Short Term Price Prediction
Looking ahead, the first resistance lies at the 20-day MA, around $2.22. This is followed by $2.36 (bearish .382 Fib), $2.50 (bearish .5 Fib & 50-day MA), and $2.65 (bearish .618 Fib).
On the other side, the first support lies at $2.20. This is followed by $2.00 (.618 Fib), $1.95 (100-day MA), $1.88 (downside 1.414 Fib Extension), and $1.80.
The daily RSI is coiling beneath the midline, indicating that the previous bearish momentum is fading.
ADA/BTC – Bears Push Beneath .5 Fib Support
Key Support Levels: 4350 SAT, 4220 SAT, 4000 SAT.
Key Resistance Levels: 4500 SAT, 4700 SAT, 5000 SAT.
ADA fell beneath critical support at 4700 SAT (.5 Fib) yesterday as it continued to decrease further below 4500 SAT and the 100-day MA. The cryptocurrency has been trading inside a descending price channel since hitting the resistance at 6000 SAT in the first week of September.
Initially, ADA found support at 4800 SAT but could not hold the level over the weekend. The lower angle of the price channel is still available for support moving forward.
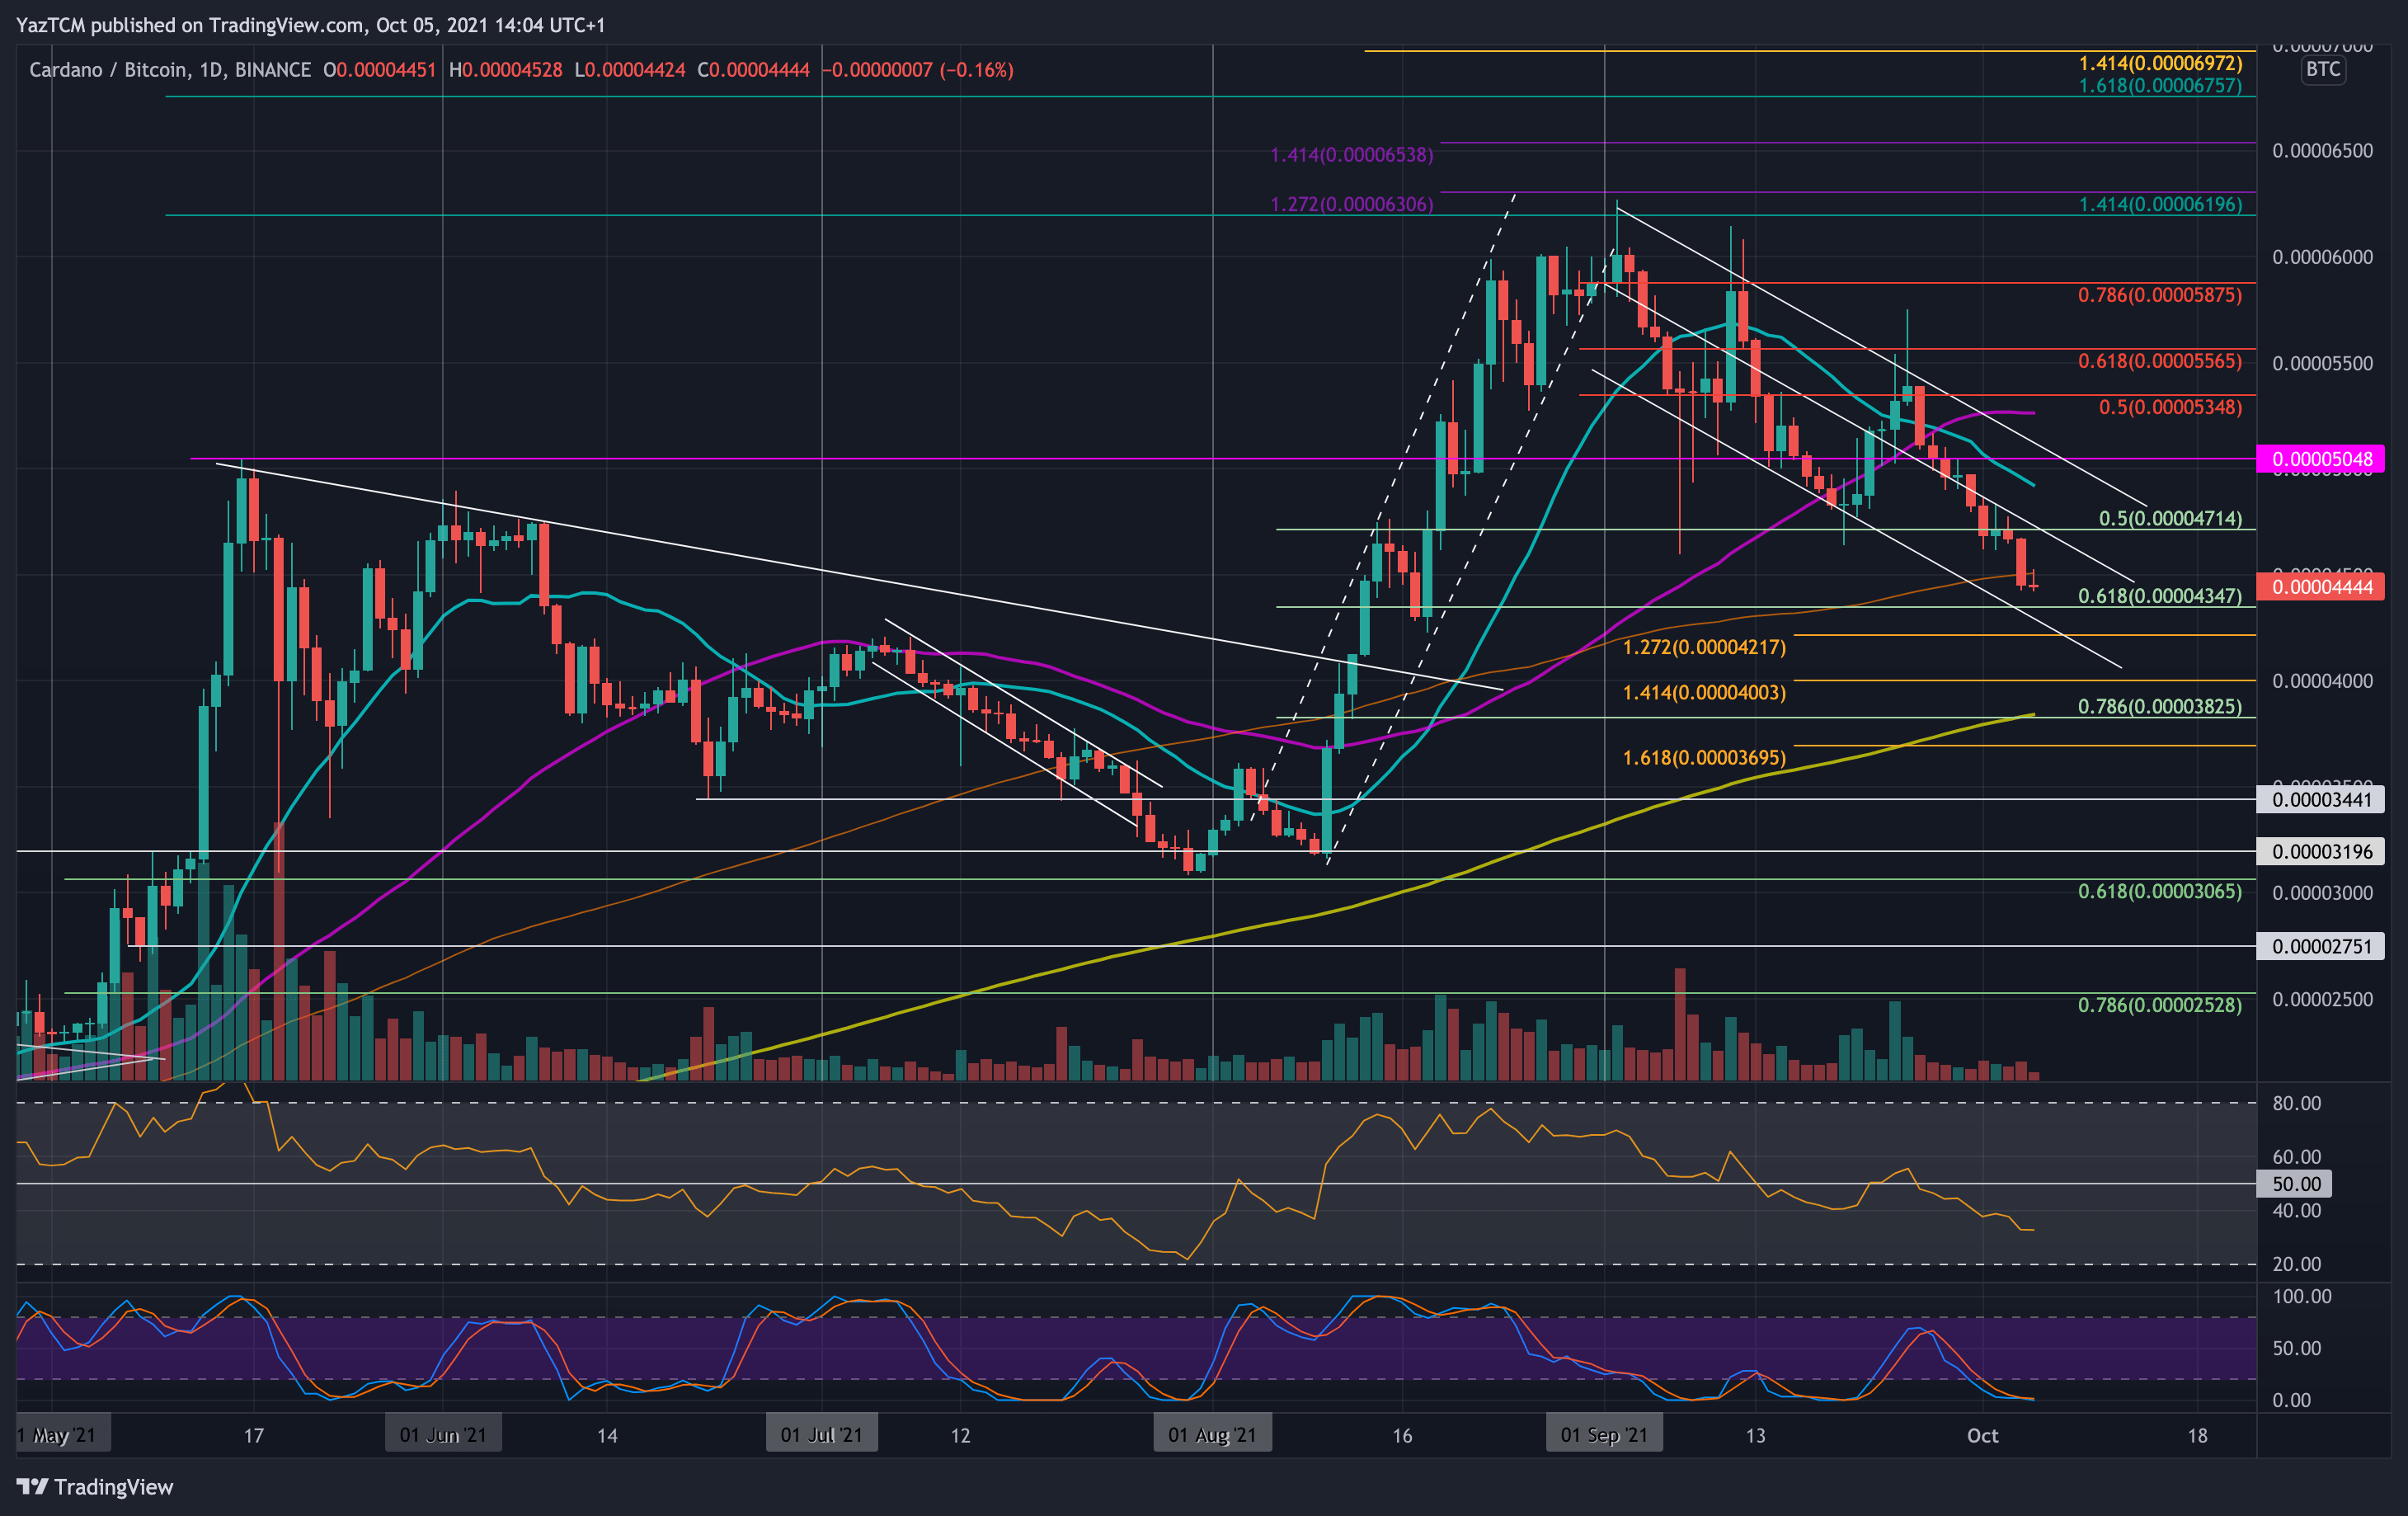
ADA-BTC Short Term Price Prediction
Looking ahead, the first strong support lies at 4350 SAT (.618 Fib). This is followed by 4220 SAT (downside 1.272 Fib Extension & lower angle of price channel), 4000 SAT, and 3825 SAT (200-day MA).
On the other side, the first resistance lies at 4500 SAT. This is followed by 4700 SAT, 5000 SAT, and 5300 SAT (50-day MA).
The RSI is sinking lower from the midline, indicating the bearish momentum is now increasing.