LINK/USD – LINK Finally Breaks December ResistanceKey Support Levels: .30, .50, .Key Resistance Levels: , .66, .73.LINK pretty much traded sideways throughout December. Our previous LINK analysis stated that it must break either .30 or .50 to dictate the next direction. Although it briefly penetrated below .50 toward the end of December, it never closed a daily candle beneath .In January 2021, LINK started to push higher from as it increased by a total of 33% to reach .65 today. In doing so, the coin finally broke beyond the December resistance and is now poised to move higher – providing it can clear .66.LINK/USD Daily Chart. Source: TradingViewLINK-USD Short Term Price PredictionLooking ahead, the first level of resistance lies at . This is
Topics:
Yaz Sheikh considers the following as important: Chainlink (LINK) Price, LINKBTC, LINKUSD, Price Analysis
This could be interesting, too:
Chayanika Deka writes Chainlink’s MVRV Ratio Signals Selling Exhaustion: What’s Next for LINK?
Chayanika Deka writes Whale and Shark Activity Pushes Chainlink (LINK) Past For the First Time in 37 Months
Martin Young writes Chainlink Partners With Major Finance Firms on AI, Oracles, and Blockchain Data Solution Project
Dimitar Dzhondzhorov writes Top 10 Cryptocurrencies by ‘Notable Development Activity’ (Santiment)
LINK/USD – LINK Finally Breaks December Resistance
Key Support Levels: $14.30, $13.50, $13.
Key Resistance Levels: $15, $15.66, $16.73.
LINK pretty much traded sideways throughout December. Our previous LINK analysis stated that it must break either $14.30 or $11.50 to dictate the next direction. Although it briefly penetrated below $11.50 toward the end of December, it never closed a daily candle beneath $11.
In January 2021, LINK started to push higher from $11 as it increased by a total of 33% to reach $14.65 today. In doing so, the coin finally broke beyond the December resistance and is now poised to move higher – providing it can clear $15.66.
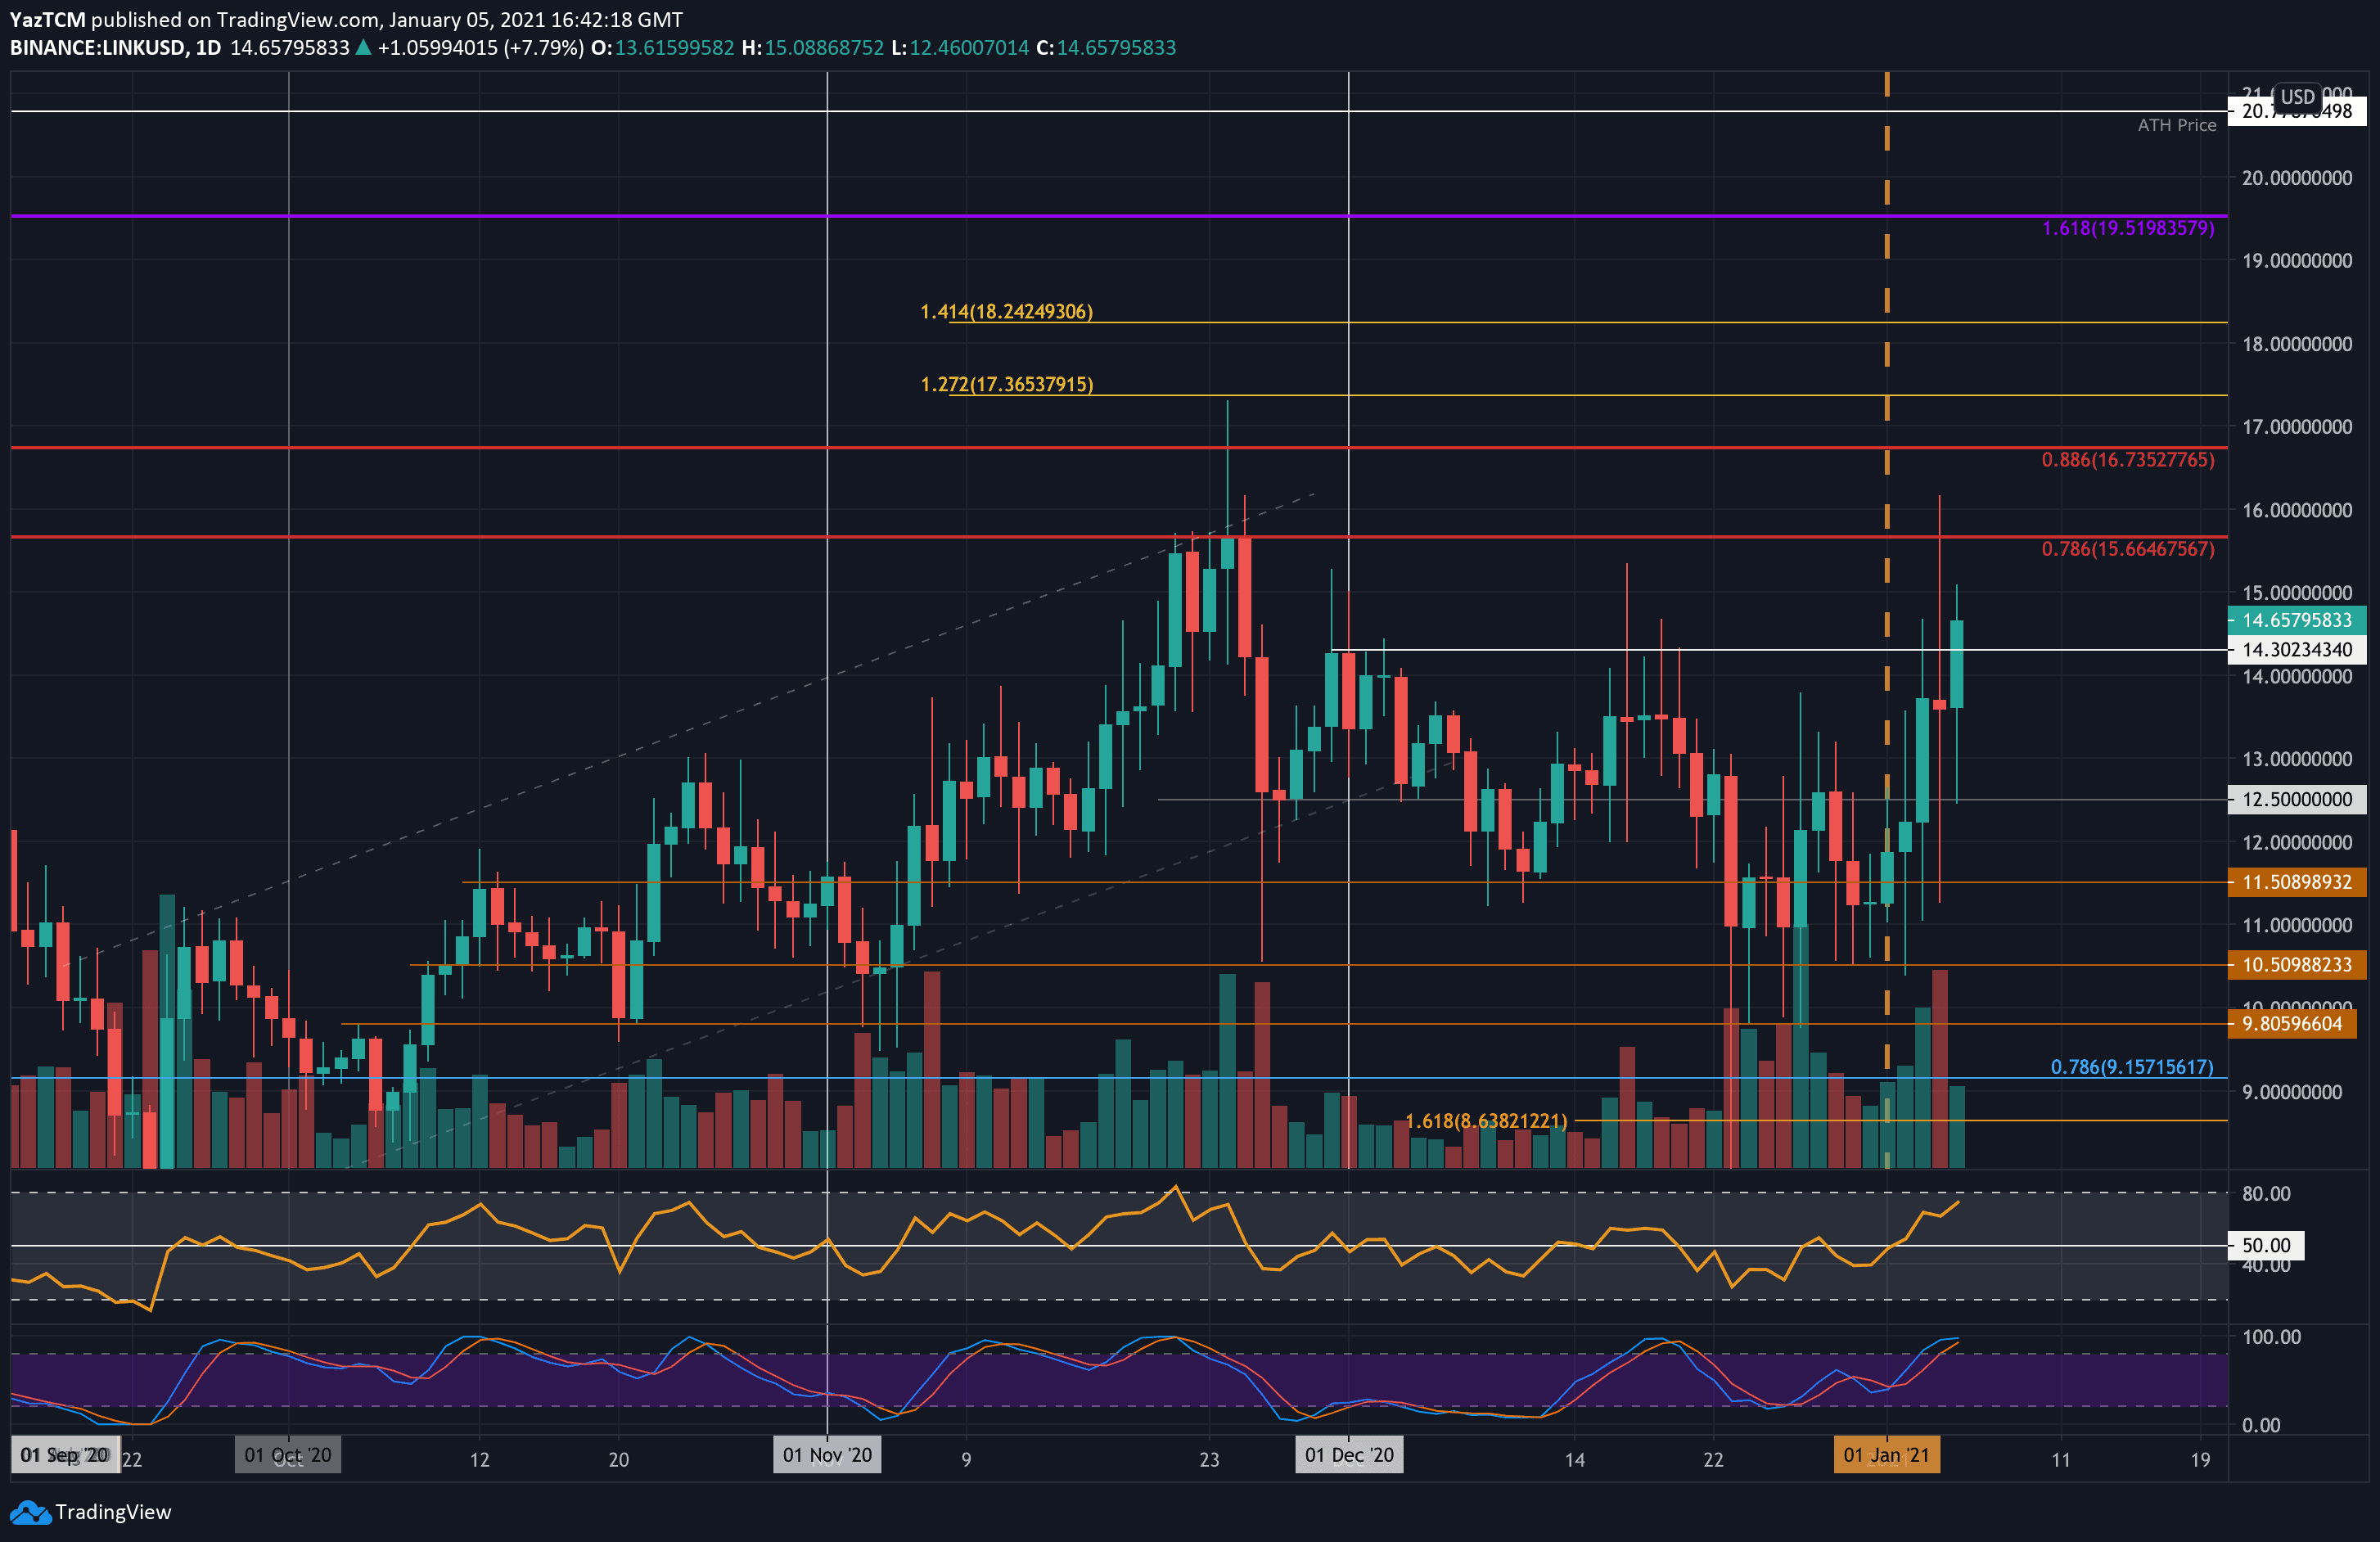
LINK-USD Short Term Price Prediction
Looking ahead, the first level of resistance lies at $15. This is followed by $15.66 (bearish .786 Fib & November 2020 resistance), $16, and $16.73 (bearish .886 Fib). Additional resistance is found at $17.35 and $18.24.
On the other side, the first level of support lies at $14.30. This is followed by $13.50, $13, $12.50, and $11.50.
The RSI is pushing higher as the bullish momentum increases within the market. It still has room to continue before becoming overbought.
LINK/BTC – Buyers Rebound From Downside 1.618 Fib Extension
Key Support Levels: 43,000 SAT, 41,500 SAT, 40,000 SAT.
Key Resistance Levels: 50,200 SAT, 52,600 SAT, 55,000 SAT.
Against Bitcoin, LINK fell by a steep 49% in December as it dropped from above 74,000 SAT to reach the support at 37,700 SAT (downside 1.618 Fibonacci Extension level).
From there, it rebounded at this support in January and started to push higher again. It is currently trading at 45,250 SAT.
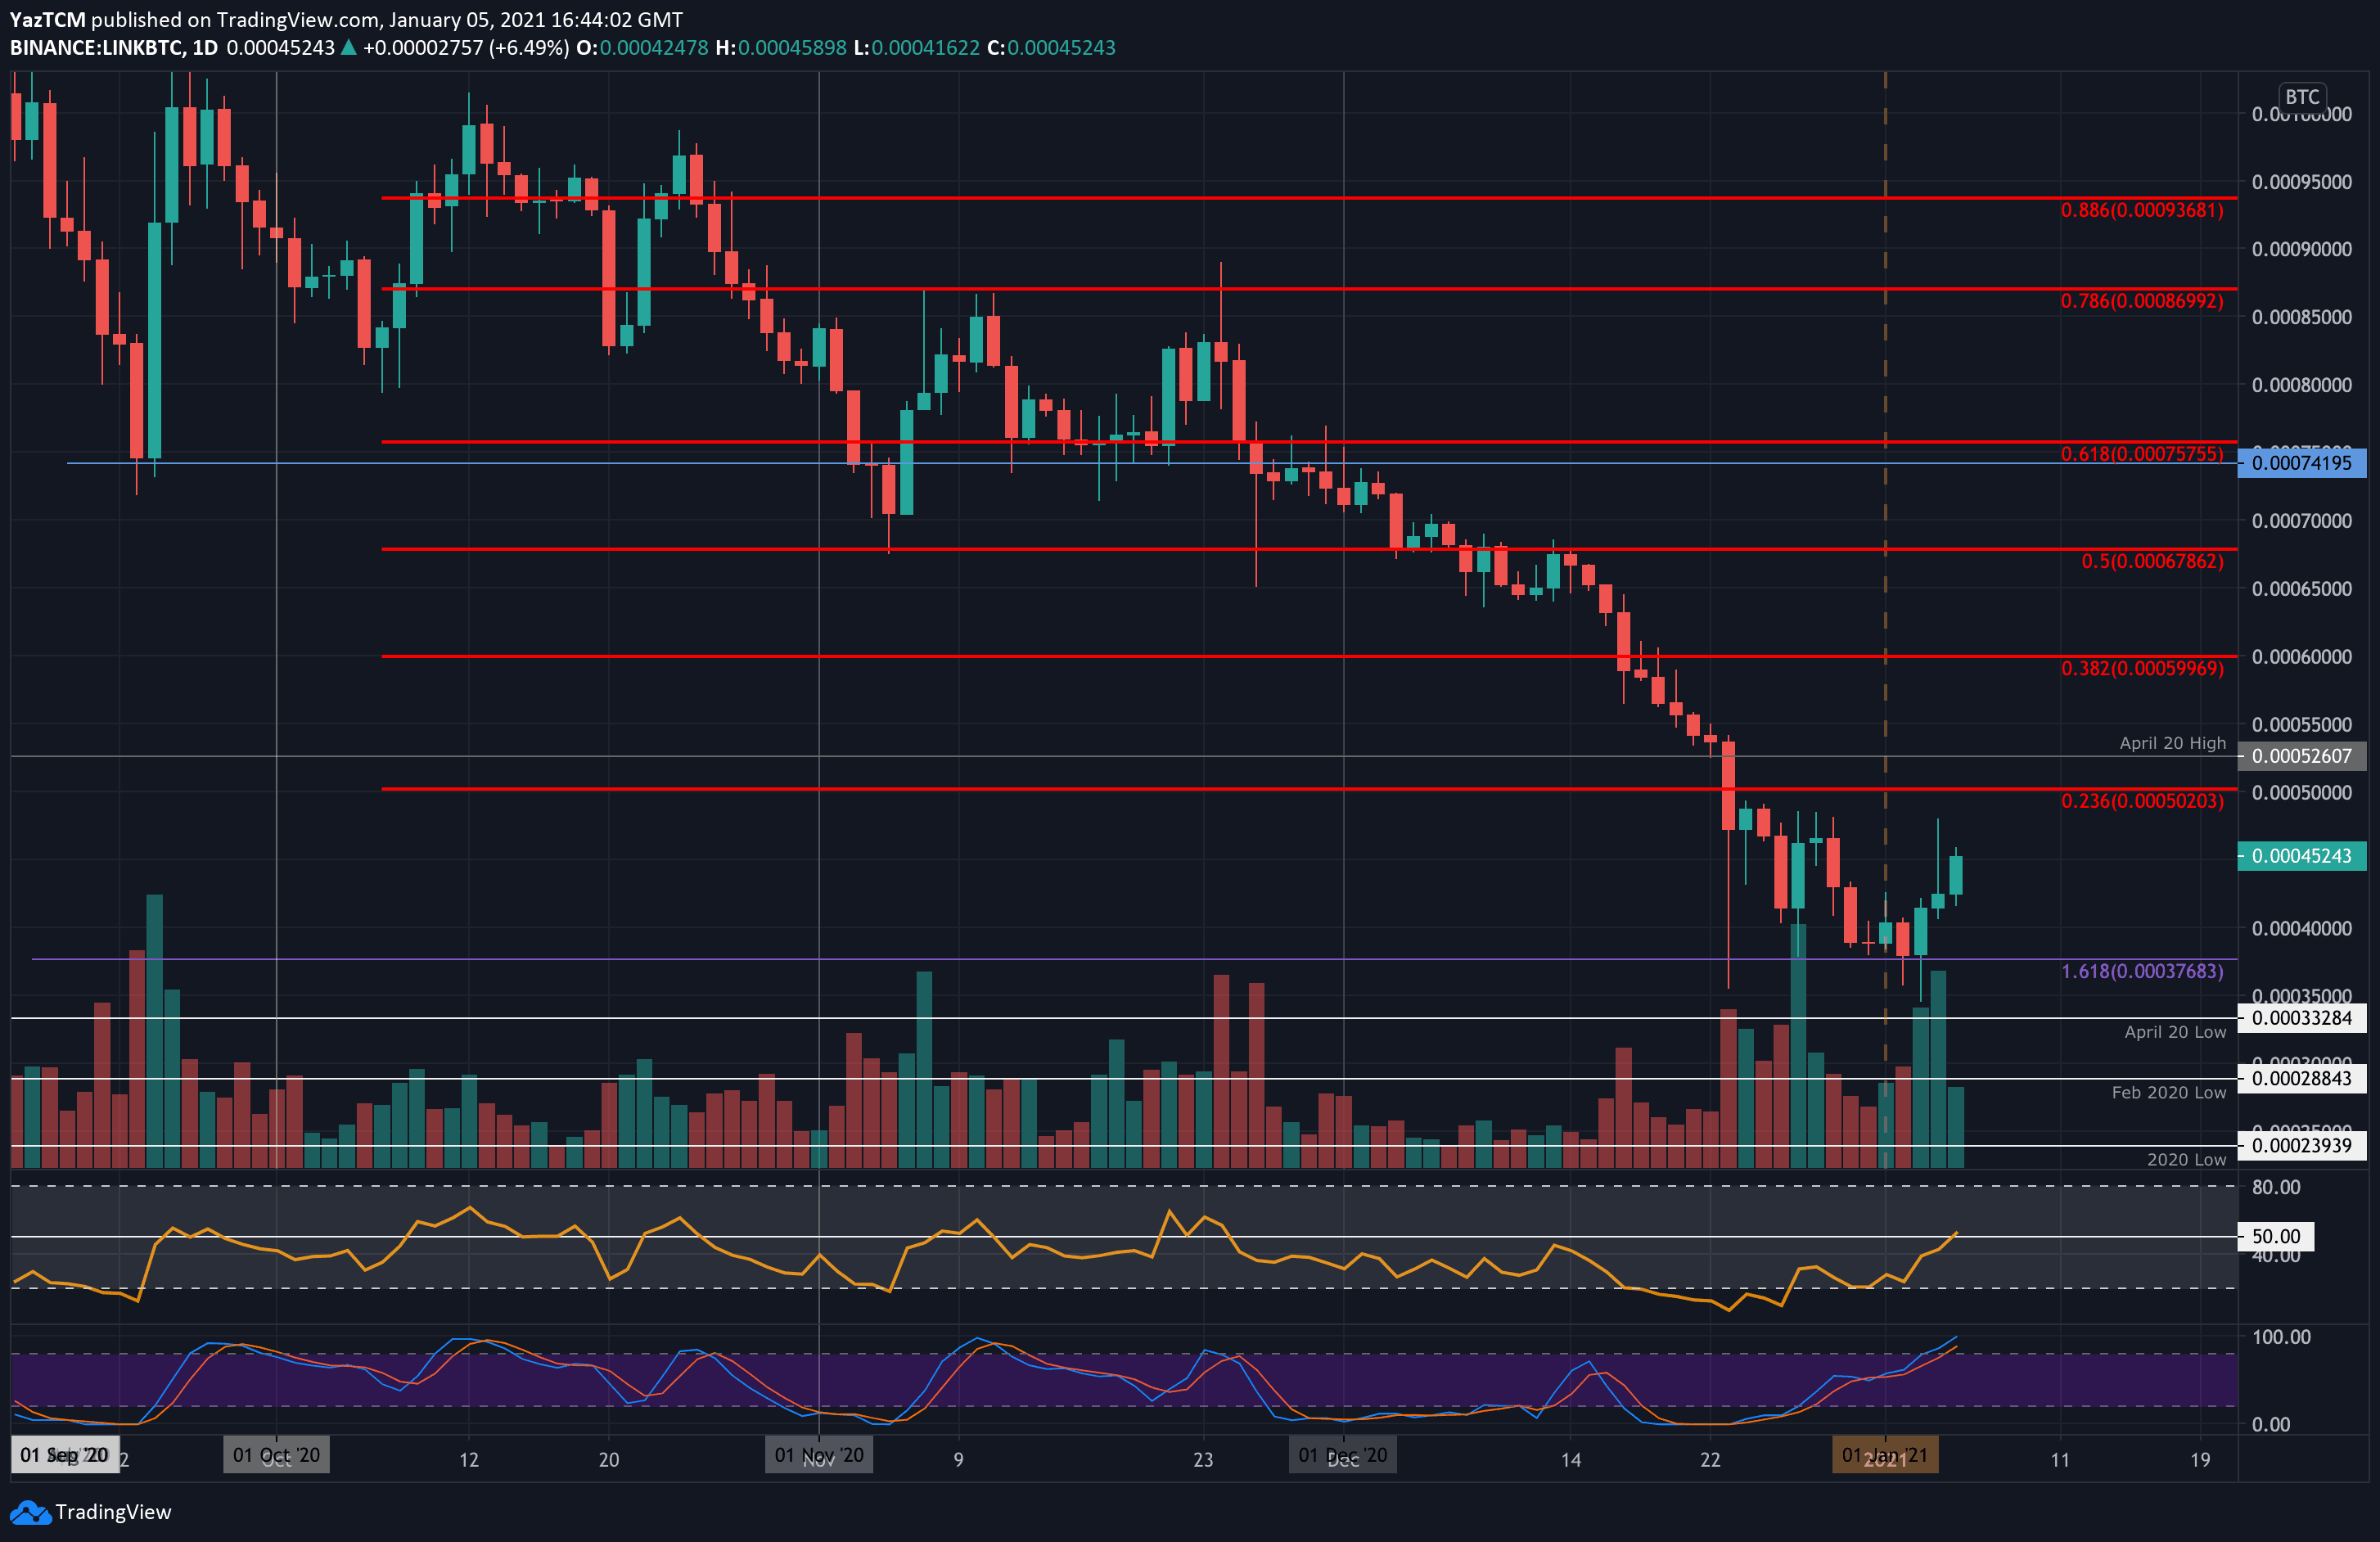
LINK-BTC Short Term Price Prediction
Moving forward, the first level of strong resistance lies at 50,200 SAT (bearish .236 Fib Retracement). This is followed by 52,600 SAT (April 20 highs), 55,000 SAT, and 60,000 SAT (bearish .382 Fib Retracement).
On the other side, the first level of support lies at 43,000 SAT. This is followed by 41,500 SAT, 40,000, and 37,700 SAT. Beneath the December 2020 lows, added support is found at 35,000 SAT and 33,300 SAT (April 2020 lows).
The RSI has returned to the mid-line to indicate the bearish momentum has faded. It will still need to rise above the mid-line for the bulls to control the market momentum.