XRP/USD – Bears Starting To Retake ControlKey Support Levels: %excerpt%.45, %excerpt%.4, %excerpt%.36.Key Resistance Levels: %excerpt%.5, %excerpt%.556, %excerpt%.6.XRP had seen an interesting few days this week as it surged as high as %excerpt%.685 (1.272 Fib Extension) on Monday when the rest of the market was tumbling. By the end of the day, XRP had dropped back into the %excerpt%.56 level to close the daily candle.Yesterday, XRP saw a steep downturn as it dropped beneath %excerpt%.5 to reach as low as %excerpt%.36. The bulls quickly regrouped and allowed the daily candle to close sound %excerpt%.47. Today, it seems that XRP is trending lower as it battles to remain above support around %excerpt%.45 (.5 Fib).XRP/USD Daily Chart. Source: TradingViewXRP-USD Short Term Price PredictionLooking ahead, the first support lies at %excerpt%.45. This is followed by %excerpt%.4 (.618 Fib &
Topics:
Yaz Sheikh considers the following as important: Ripple (XRP) Price, XRP Analysis, xrpbtc, xrpusd
This could be interesting, too:
Jordan Lyanchev writes Ripple’s (XRP) Surge to Triggers Over Million in Short Liquidations
Jordan Lyanchev writes Trump Confirms Work on Strategic Crypto Reserve: XRP, ADA, SOL Included
Dimitar Dzhondzhorov writes Is a Major Ripple v. SEC Lawsuit Development Expected This Week? Here’s Why
Mandy Williams writes Ripple Releases Institutional DeFi Roadmap for XRP Ledger in 2025
XRP/USD – Bears Starting To Retake Control
Key Support Levels: $0.45, $0.4, $0.36.
Key Resistance Levels: $0.5, $0.556, $0.6.
XRP had seen an interesting few days this week as it surged as high as $0.685 (1.272 Fib Extension) on Monday when the rest of the market was tumbling. By the end of the day, XRP had dropped back into the $0.56 level to close the daily candle.
Yesterday, XRP saw a steep downturn as it dropped beneath $0.5 to reach as low as $0.36. The bulls quickly regrouped and allowed the daily candle to close sound $0.47. Today, it seems that XRP is trending lower as it battles to remain above support around $0.45 (.5 Fib).

XRP-USD Short Term Price Prediction
Looking ahead, the first support lies at $0.45. This is followed by $0.4 (.618 Fib & 100-days EMA), $0.36, $0.35 (200-days EMA & Feb 2020 Highs), and $0.372 (.786 Fib).
On the other side, the first resistance lies at $0.5. This is followed by $0.556, $0.6, and $0.65 (bearish .786 Fib). Added resistance lies at $0.685 and $0.718.
The RSI has recently stumbled beneath the midline, indicating the bears have regained control of the market momentum. If it continues to head lower, XRP can be expected to head back toward $0.4 (100-days EMA).
XRP/BTC – Bears Push XRP Beneath 1000 SAT
Key Support Levels: 867 SAT, 800 SAT, 700 SAT.
Key Resistance Levels: 1000 SAT, 1200 SAT, 1300 SAT.
Against Bitcoin, XRP has dropped back beneath 1000 SAT today as it trades around 950 SAT. The coin had been holding above 1000 SAT for most of February but slipped below the support over the weekend as it toward 867 SAT.
It rebounded from there on Monday to reach as high as 1200 SAT (Dec 2017 lows) but was unable to maintain these highs. As a result, XRP fell beneath the support at 1000 SAT yesterday and continued beneath 980 SAT (.786 Fib) today.
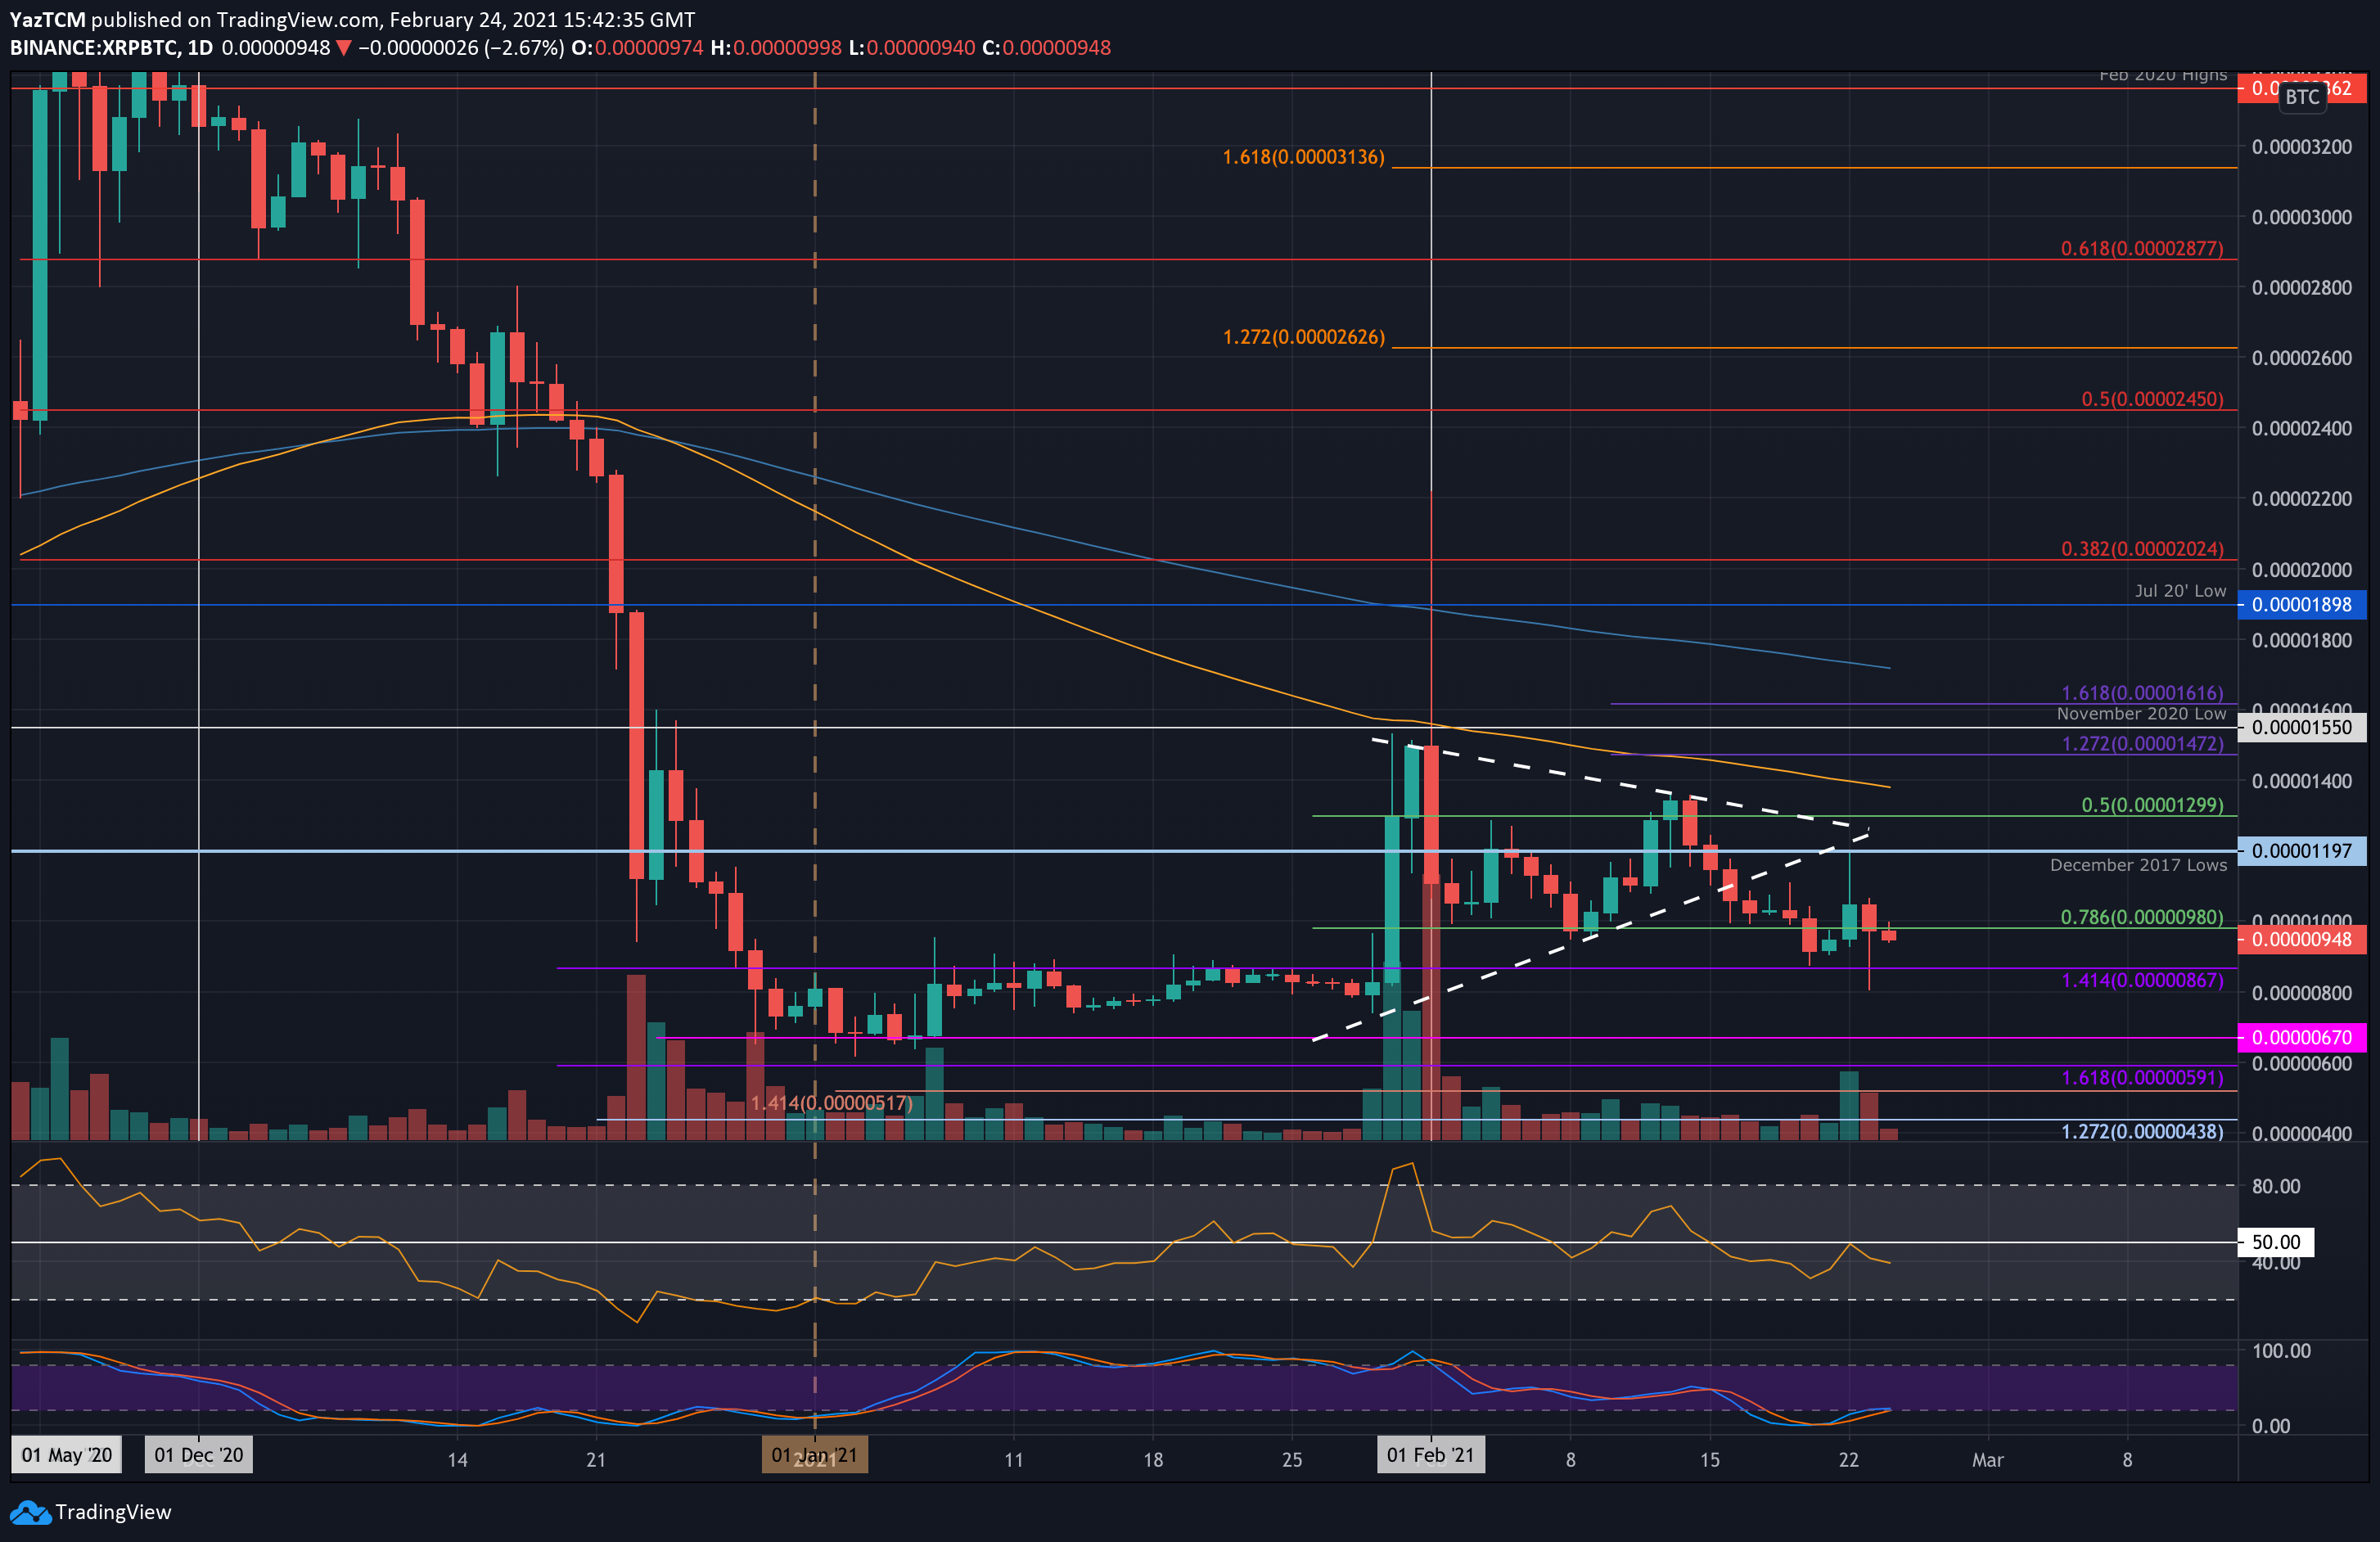
XRP-BTC Short Term Price Prediction
Moving forward, the first support lies at 867 SAT (upper boundary of January price range). This is followed by 800 SAT, 700 SAT, and 670 SAT (lower boundary of January price range).
On the other side, the first resistance lies at 1000 SAT. This is followed by 1200 SAT (Dec 2018 lows), 1300 SAT, and 1400 SAT (100-days EMA).
The RSI attempting to break the midline on Monday but failed to overcome it. It has turned lower again today as the bearish momentum starts to gather steam.