XRP/USD – XRP Continues To Set Multi-Year Highs Key Support Levels: .63, .50, .41.Key Resistance Levels: .77, .98, .10. XRP surged by a whopping 87% over the past week as the coin currently sits at around .7. The cryptocurrency was trading at .00 just six days ago but has since shot up higher to break resistance at .25 (Feb 2018 highs) and reach highs not seen since January 2018. On Tuesday, XRP surged from .40 to reach as high as .90. It continued higher yesterday to set a new 2021 high at .98 before it rolled over and dropped lower to the current level. The sentiment is now overwhelmingly bullish, but the market might be a little overextended at this moment in time. XRP/USD Daily Chart. Source: TradingViewXRP-USD Short Term Price Prediction
Topics:
Yaz Sheikh considers the following as important: Ripple (XRP) Price, XRP Analysis, xrpbtc, xrpusd
This could be interesting, too:
Jordan Lyanchev writes Ripple’s (XRP) Surge to Triggers Over Million in Short Liquidations
Jordan Lyanchev writes Trump Confirms Work on Strategic Crypto Reserve: XRP, ADA, SOL Included
Dimitar Dzhondzhorov writes Is a Major Ripple v. SEC Lawsuit Development Expected This Week? Here’s Why
Mandy Williams writes Ripple Releases Institutional DeFi Roadmap for XRP Ledger in 2025
XRP/USD – XRP Continues To Set Multi-Year Highs
Key Support Levels: $1.63, $1.50, $1.41.
Key Resistance Levels: $1.77, $1.98, $2.10.
XRP surged by a whopping 87% over the past week as the coin currently sits at around $1.7. The cryptocurrency was trading at $1.00 just six days ago but has since shot up higher to break resistance at $1.25 (Feb 2018 highs) and reach highs not seen since January 2018.
On Tuesday, XRP surged from $1.40 to reach as high as $1.90. It continued higher yesterday to set a new 2021 high at $1.98 before it rolled over and dropped lower to the current level. The sentiment is now overwhelmingly bullish, but the market might be a little overextended at this moment in time.
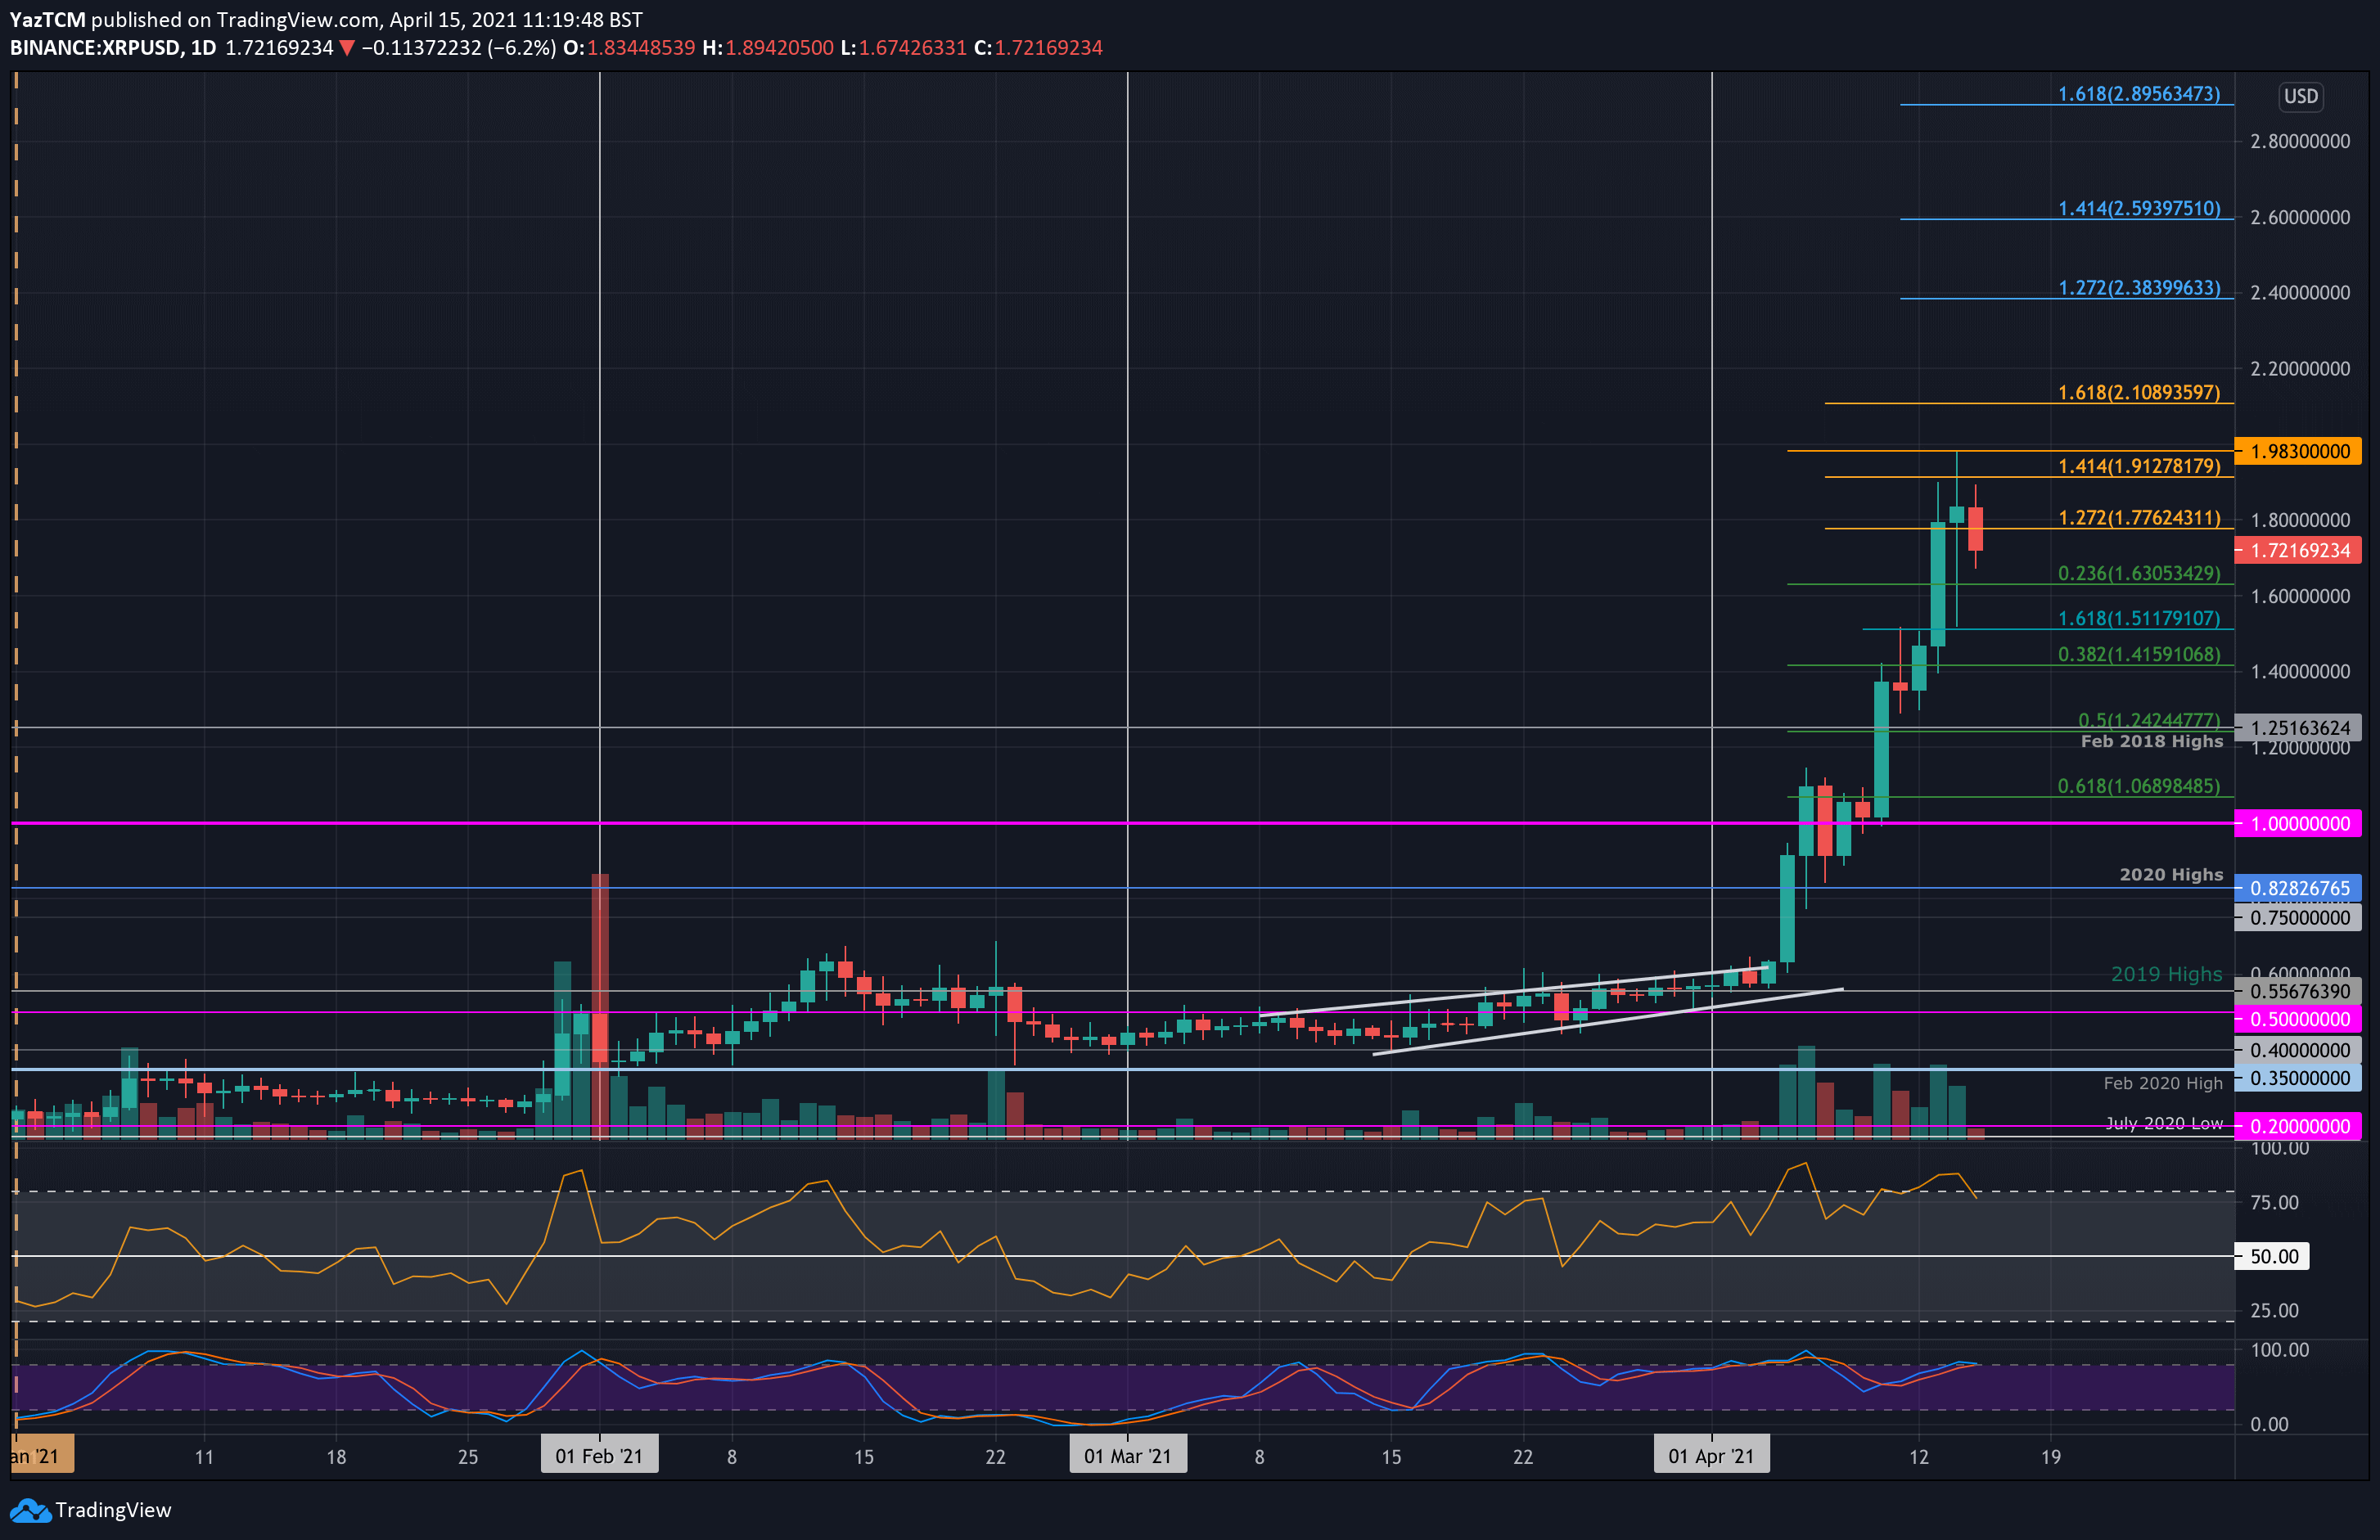
XRP-USD Short Term Price Prediction
Looking ahead, the first resistance lies at $1.77 (1.272 Fib Extension). This is followed by $1.98 (2021 High), $2.00, and $2.10 (1.618 Fib Extension). Additional resistance lies at $2.20, $2.38 (1.272 Fib Extension – blue), $2.50, and $2.60 (1.414 Fib Extension – blue).
On the other side, the first support lies at $1.63 (.236 Fib). This is followed by $1.50, $1.41 (.382 Fib), $1.24 (.5 Fib & Feb 2018 Highs), and $1.06 (.618 Fib).
As expected, the RSI is extremely overbought and is starting to head lower. The momentum remains strong in the bulls’ favor. Still, a retracement might be necessary to provide breathing room for the bulls to recover from any potential exhaustion before pushing higher again.
XRP/BTC – Bulls Reach 3000 SAT For First Time Since December 2020
Key Support Levels: 2450 SAT, 2450 SAT, 2225 SAT.
Key Resistance Levels: 2877 SAT, 3058 SAT, 3200 SAT.
XRP is also looking bullish in April against BTC after breaking above an ascending triangle at the start of the month to surge higher. Initially, it found resistance at 1900 SAT (July 20 lows), but this resistance was broken last week as XRP continued to push higher.
This week, XRP managed to break resistance at 2450 SAT (bearish .5 Fib) on Tuesday to reach as high as 3058 SAT yesterday for the first time since December 2020. It has since dropped back beneath 3000 SAT as it trades at 2743 SAT.
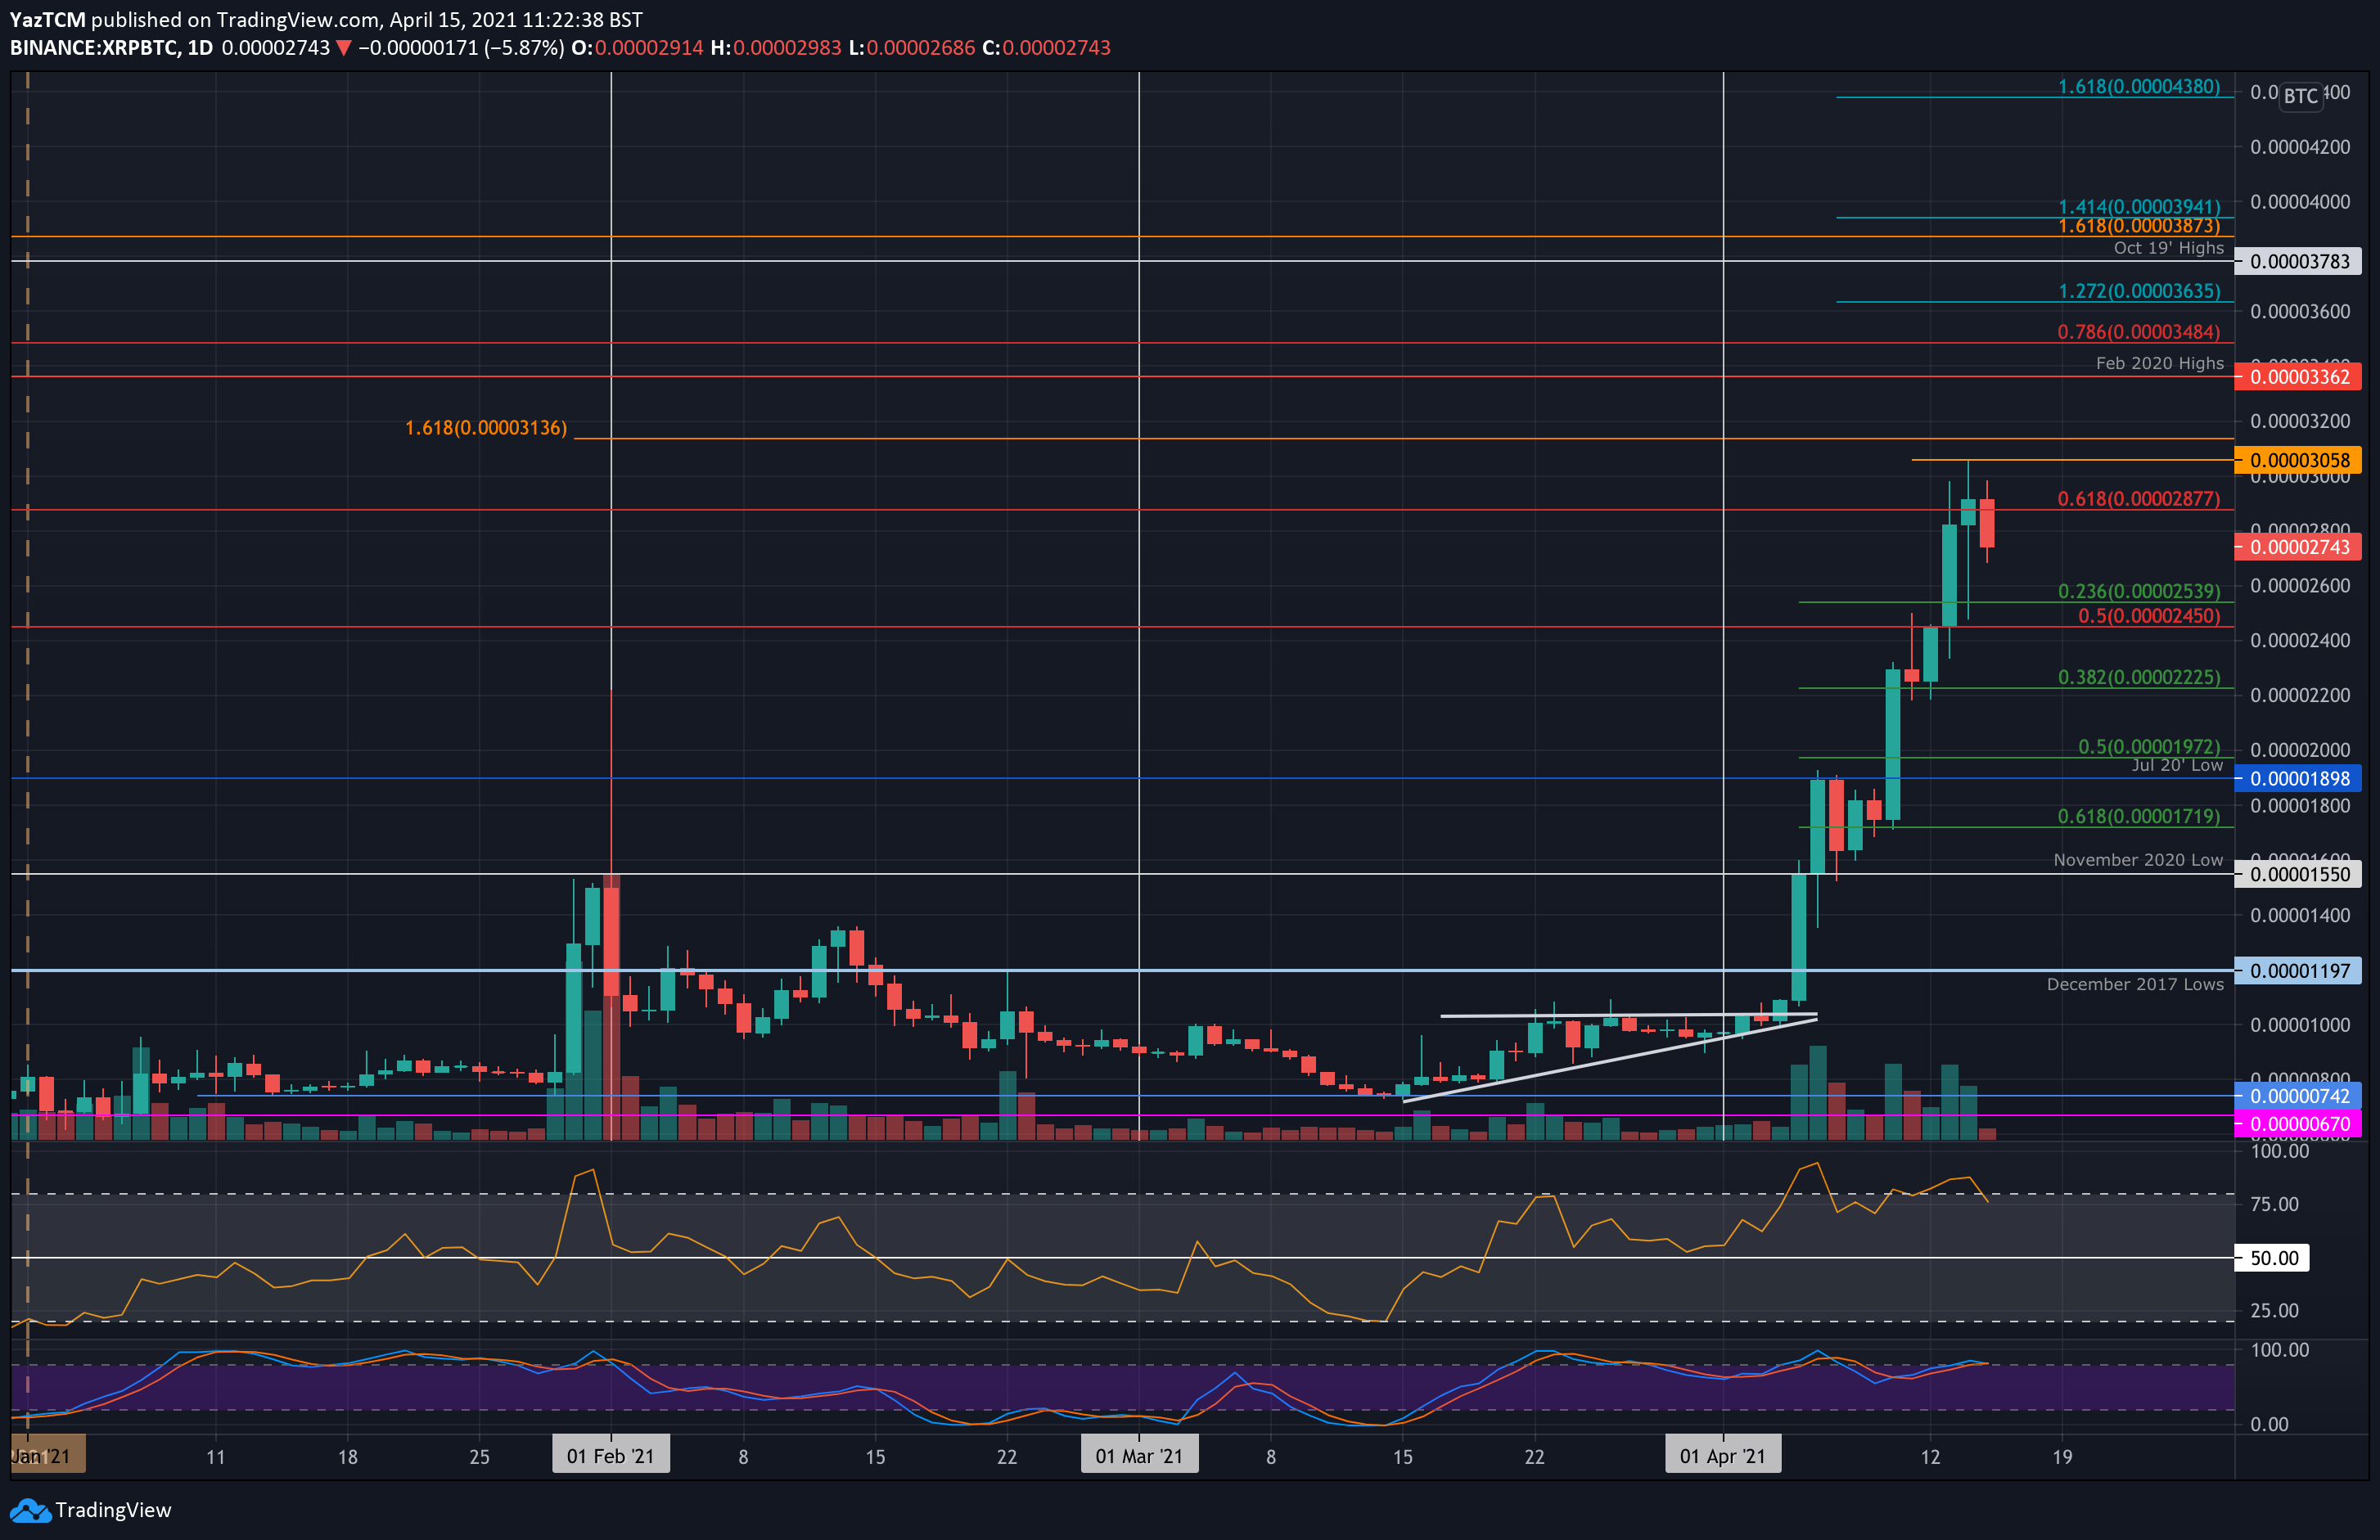
XRP-BTC Short Term Price Prediction
Looking ahead, the first support lies at 2540 SAT (.236 Fib). This is followed by 2450 SAT, 2225 SAT (.382 Fib), 2000 SAT (.5 Fib), and 1900 SAT (July 20 lows).
On the other side, the first resistance lies at 2877 SAT (bearish .618 Fib). This is followed by 3058 SAT (2021 Highs), 3200 SAT, 3363 SAT (Feb 2020 highs), and 3485 SAT (bearish .786 Fib).
Likewise, the RSI is extremely overbought and recently produced a hidden bearish divergence signal. The bullish momentum is now fading as the market provides some recovery space for the bulls before they begin another push higher.