XRP/USD – Bulls Struggle To Spike Past %excerpt%.6. Key Support Levels: %excerpt%.556, %excerpt%.52, %excerpt%.5.Key Resistance Levels: %excerpt%.588, %excerpt%.6, %excerpt%.65. XRP has been performing well over the second half of March after climbing by 45% from the monthly low of %excerpt%.4 to reach the current %excerpt%.58 level. The cryptocurrency has formed a rising wedge pattern as it battles to break the upper boundary. It has been spiking higher over the past week, briefly pushing above %excerpt%.6 four times during the period. However, it continues to struggle to break the wedge’s upper boundary and it would need to be penetrated to allow XRP to close a daily candle above %excerpt%.6 and head back toward the 2021 highs at around %excerpt%.69. XRP/USD Daily Chart. Source: https://www.tradingview.com/x/JdeYszFh/XRP-USD Short Term Price Prediction
Topics:
Yaz Sheikh considers the following as important: Ripple (XRP) Price, XRP Analysis, xrpbtc, xrpusd
This could be interesting, too:
Jordan Lyanchev writes Ripple’s (XRP) Surge to Triggers Over Million in Short Liquidations
Jordan Lyanchev writes Trump Confirms Work on Strategic Crypto Reserve: XRP, ADA, SOL Included
Dimitar Dzhondzhorov writes Is a Major Ripple v. SEC Lawsuit Development Expected This Week? Here’s Why
Mandy Williams writes Ripple Releases Institutional DeFi Roadmap for XRP Ledger in 2025
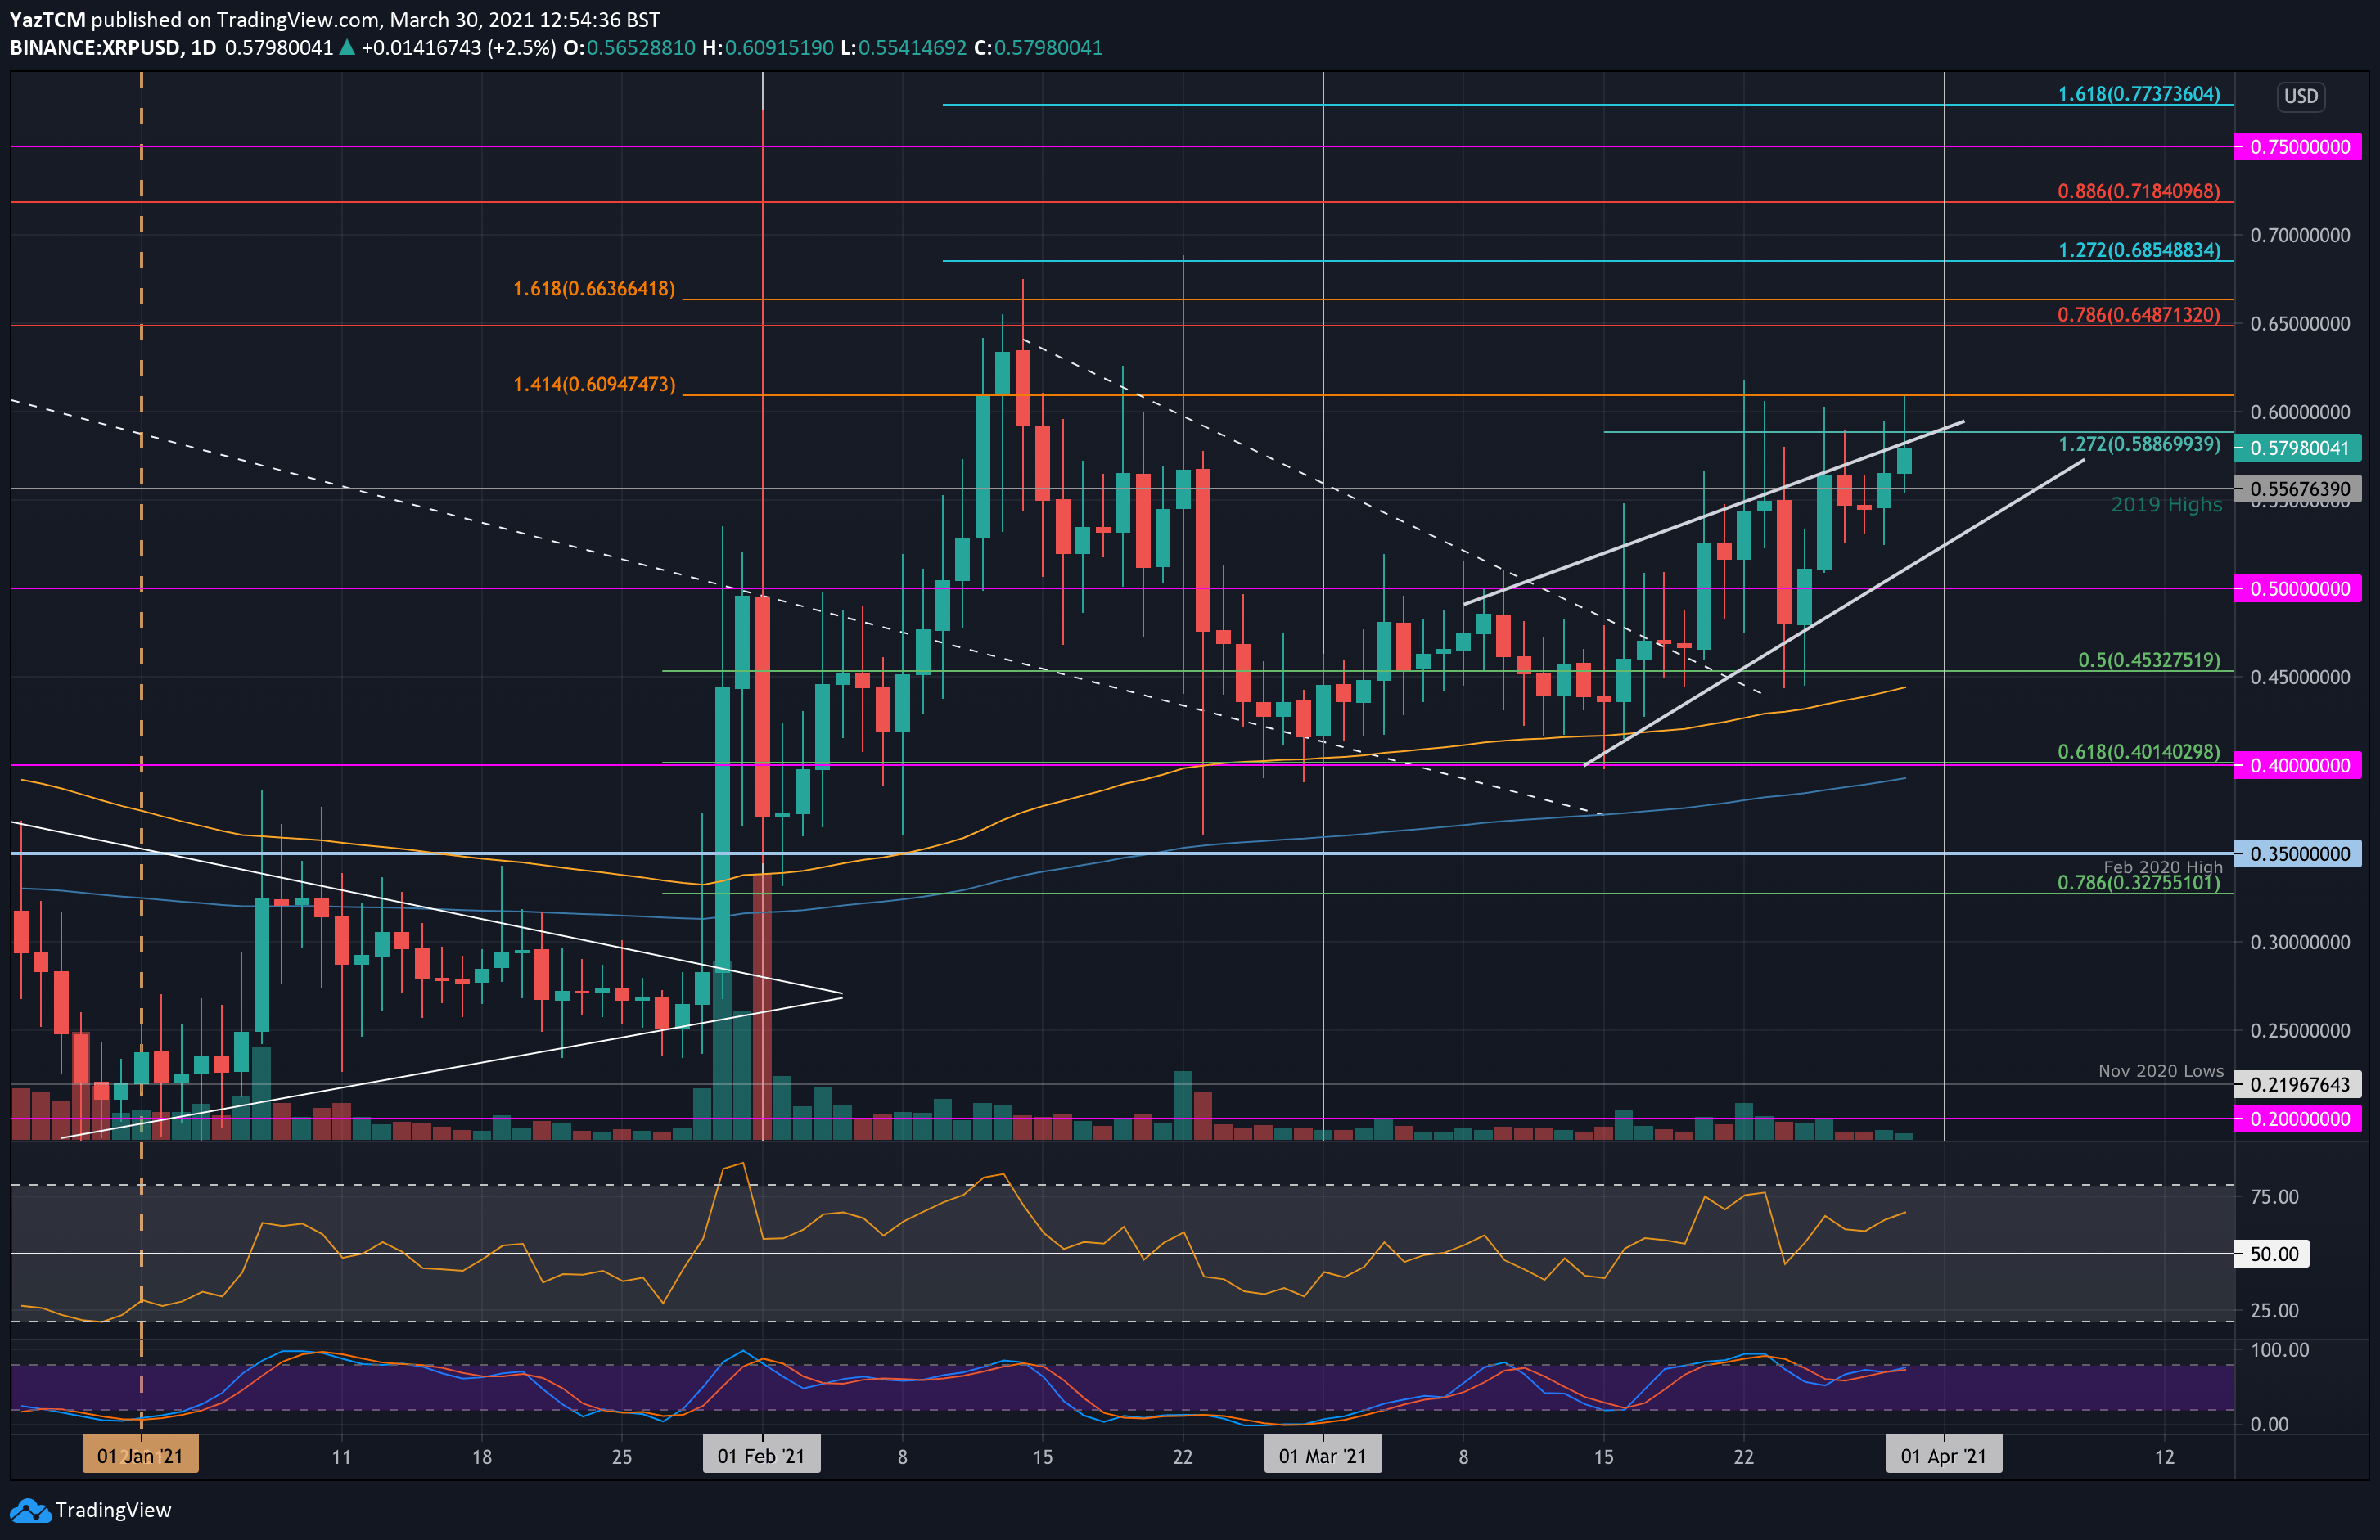
XRP/USD – Bulls Struggle To Spike Past $0.6.
Key Support Levels: $0.556, $0.52, $0.5.
Key Resistance Levels: $0.588, $0.6, $0.65.
XRP has been performing well over the second half of March after climbing by 45% from the monthly low of $0.4 to reach the current $0.58 level. The cryptocurrency has formed a rising wedge pattern as it battles to break the upper boundary.
It has been spiking higher over the past week, briefly pushing above $0.6 four times during the period. However, it continues to struggle to break the wedge’s upper boundary and it would need to be penetrated to allow XRP to close a daily candle above $0.6 and head back toward the 2021 highs at around $0.69.
XRP-USD Short Term Price Prediction
Looking ahead, the first level of resistance lies at the upper boundary of the wedge which is bolstered by a short-term 1.272 Fib Extension at $0.588. This is followed by $0.6, $0.65 (bearish .786 Fib Retracement), and $0.685 (longer termed 1.272 Fib Extension).
On the other side, the first support lies at $0.556 (2019 Highs). This is followed by support at the wedge’s lower boundary, around $0.52, $0.5, and $0.453 (.5 Fib).
The RSI has been in the bullish favor for the past fortnight as it sits above the midline. It is attempting to rise and will need to push higher to allow XRP to break toward the current wedge’s upside.
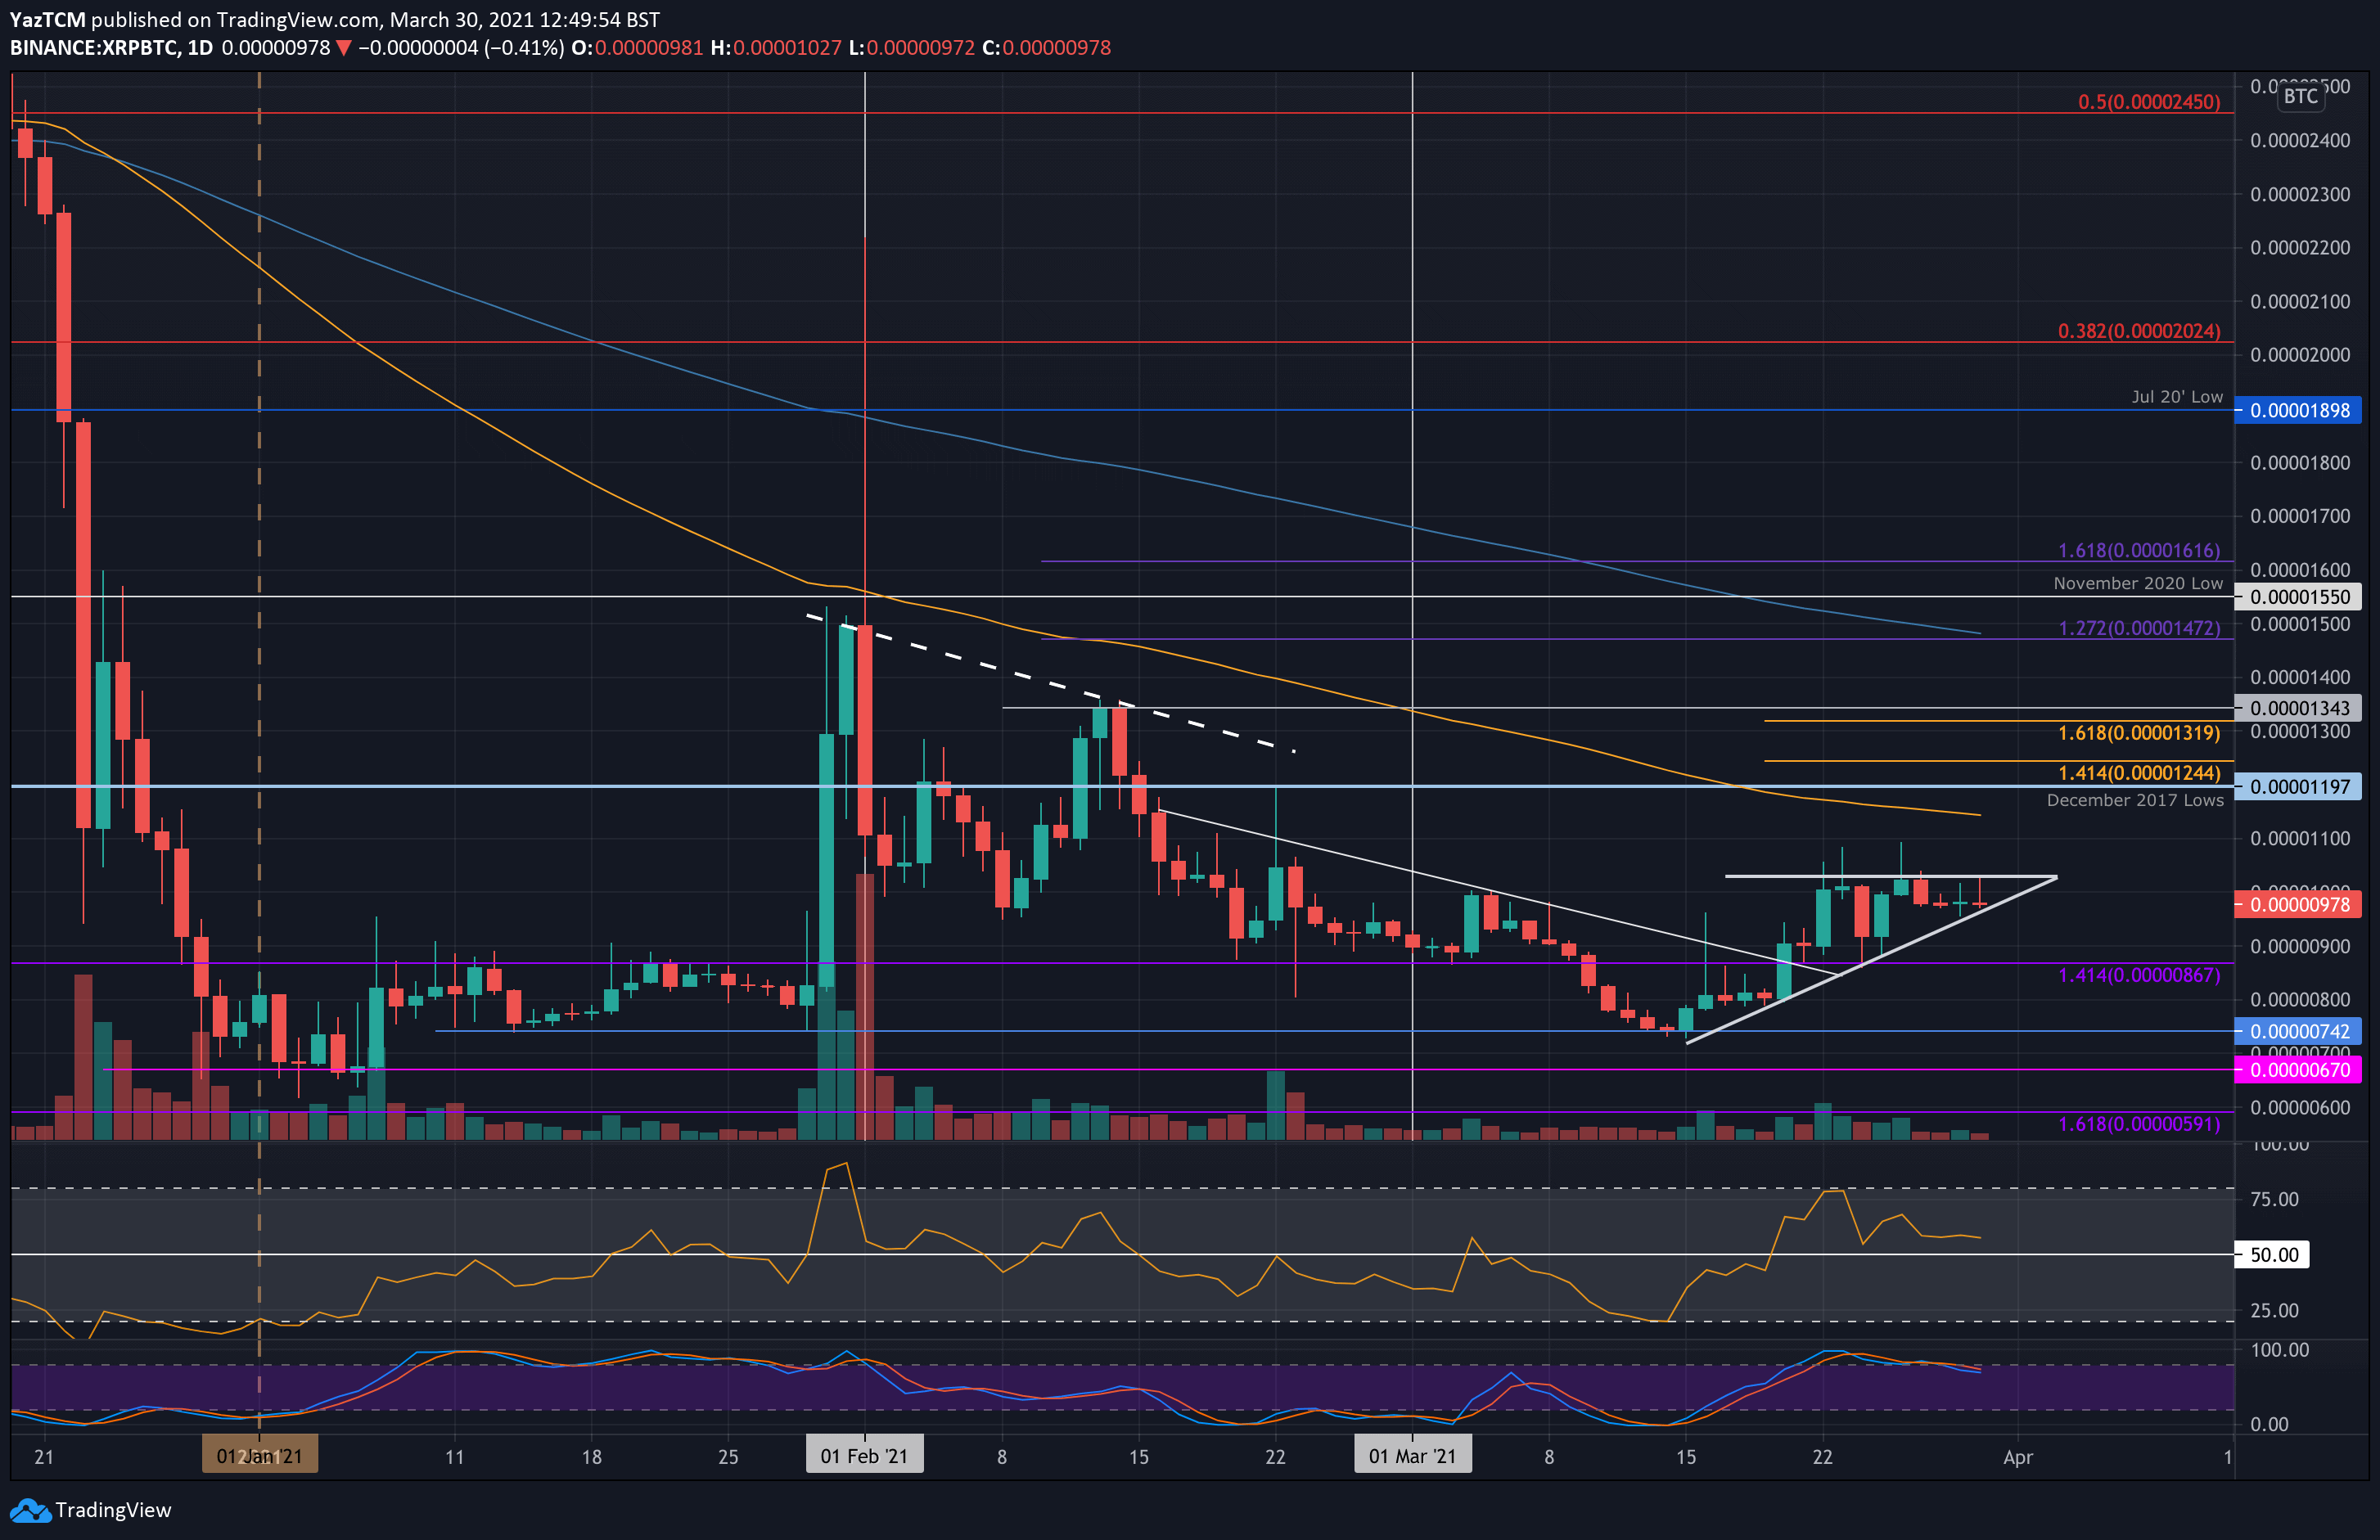
XRP/BTC – Market Forms Short Term Ascending Triangle.
Key Support Levels: 970 SAT, 900 SAT, 867 SAT.
Key Resistance Levels: 1100 SAT, 1050 SAT, 1200 SAT.
XRP had pushed above a descending trend line on March 20th, ending the previous downtrend and allowing it to break back above the January 2021 trading range above 900 SAT. From there, it moved higher but formed an ascending triangle pattern.
This triangle’s upper boundary is located around 1030 SAT and XRP has been fluctuating above and below 1000 SAT for the past nine days of trading. To turn bullish in the short term, XRP would need to penetrate the upper boundary of this short-term triangle pattern. It is quickly approaching the apex, and the market can expect a breakout in either direction within the next few days.
XRP-BTC Short Term Price Prediction
Moving forward, the first resistance lies at the triangle’s upper boundary. This is followed by 1100 SAT, 1150 SAT (100-days EMA0, 1200 SAT (December 2017 lows), and 1345 SAT.
On the other side, the first support lies at 970 SAT (the triangle’s lower boundary). This is followed by 900 SAT, 867 SAT (January’s upper trading range), 800 SAT, and 742 SAT (March support).
The RSI is heading lower as hidden bearish divergence is starting to show. This could be a signal of weakness and might cause XRP to break beneath the current triangle unless the bullish momentum can start to increase soon.