XRP/USD – XRP Holds Strong At Short Term .618 FibKey Support Levels: %excerpt%.25, %excerpt%.23, %excerpt%.22.Key Resistance Levels: %excerpt%.3, %excerpt%.32, %excerpt%.35.XRP has been relatively quiet in January after the disastrous move in December, which saw it collapse by over 75% from high to low. It managed to find support at %excerpt%.2 and started a very slow recovery, trading sideways in a symmetrical triangle pattern.Over the past three weeks, XRP has remained supported by a short term .618 Fib Retracement level at %excerpt%.263, which prevented a daily candle from breaking beneath it. Today, XRP dropped by 3.1%, which pushed it below the .618 Fib to the lower boundary of the triangle. A daily candle close would be required to confirm that the support has broken.This current triangle will need to be resolved to dictate the next
Topics:
Yaz Sheikh considers the following as important: Ripple (XRP) Price, XRP Analysis, xrpbtc, xrpusd
This could be interesting, too:
Dimitar Dzhondzhorov writes Is a Major Ripple v. SEC Lawsuit Development Expected This Week? Here’s Why
Mandy Williams writes Ripple Releases Institutional DeFi Roadmap for XRP Ledger in 2025
Dimitar Dzhondzhorov writes Ripple Whales Go on a Selling Spree: Is XRP Headed for a Further Correction?
Jordan Lyanchev writes ChatGPT and DeepSeek Analyze Ripple’s (XRP) Price Potential for 2025
XRP/USD – XRP Holds Strong At Short Term .618 Fib
Key Support Levels: $0.25, $0.23, $0.22.
Key Resistance Levels: $0.3, $0.32, $0.35.
XRP has been relatively quiet in January after the disastrous move in December, which saw it collapse by over 75% from high to low. It managed to find support at $0.2 and started a very slow recovery, trading sideways in a symmetrical triangle pattern.
Over the past three weeks, XRP has remained supported by a short term .618 Fib Retracement level at $0.263, which prevented a daily candle from breaking beneath it. Today, XRP dropped by 3.1%, which pushed it below the .618 Fib to the lower boundary of the triangle. A daily candle close would be required to confirm that the support has broken.
This current triangle will need to be resolved to dictate the next direction for the market.

XRP-USD Short Term Price Prediction
Looking ahead, the first level of support lies at the lower boundary of the triangle. This is followed by $0.25, $0.23 (.786 Fib), and $0.22 (Nov 2020 lows). Added support is found at $0.2.
On the other side, the first level of resistance lies at the upper border of the triangle. This is followed by $0.3, $0.32 (200-days EMA), $0.35 (Feb 2020 Highs), and $0.358 (bearish .382 Fib Retracement).
The daily RSI shows that the momentum is in the bearish possession as it slowly grinds lower. Optimistically, the Stochastic RSI is in oversold territory and is primed for a rebound, which could help a bullish breakout of the triangle.
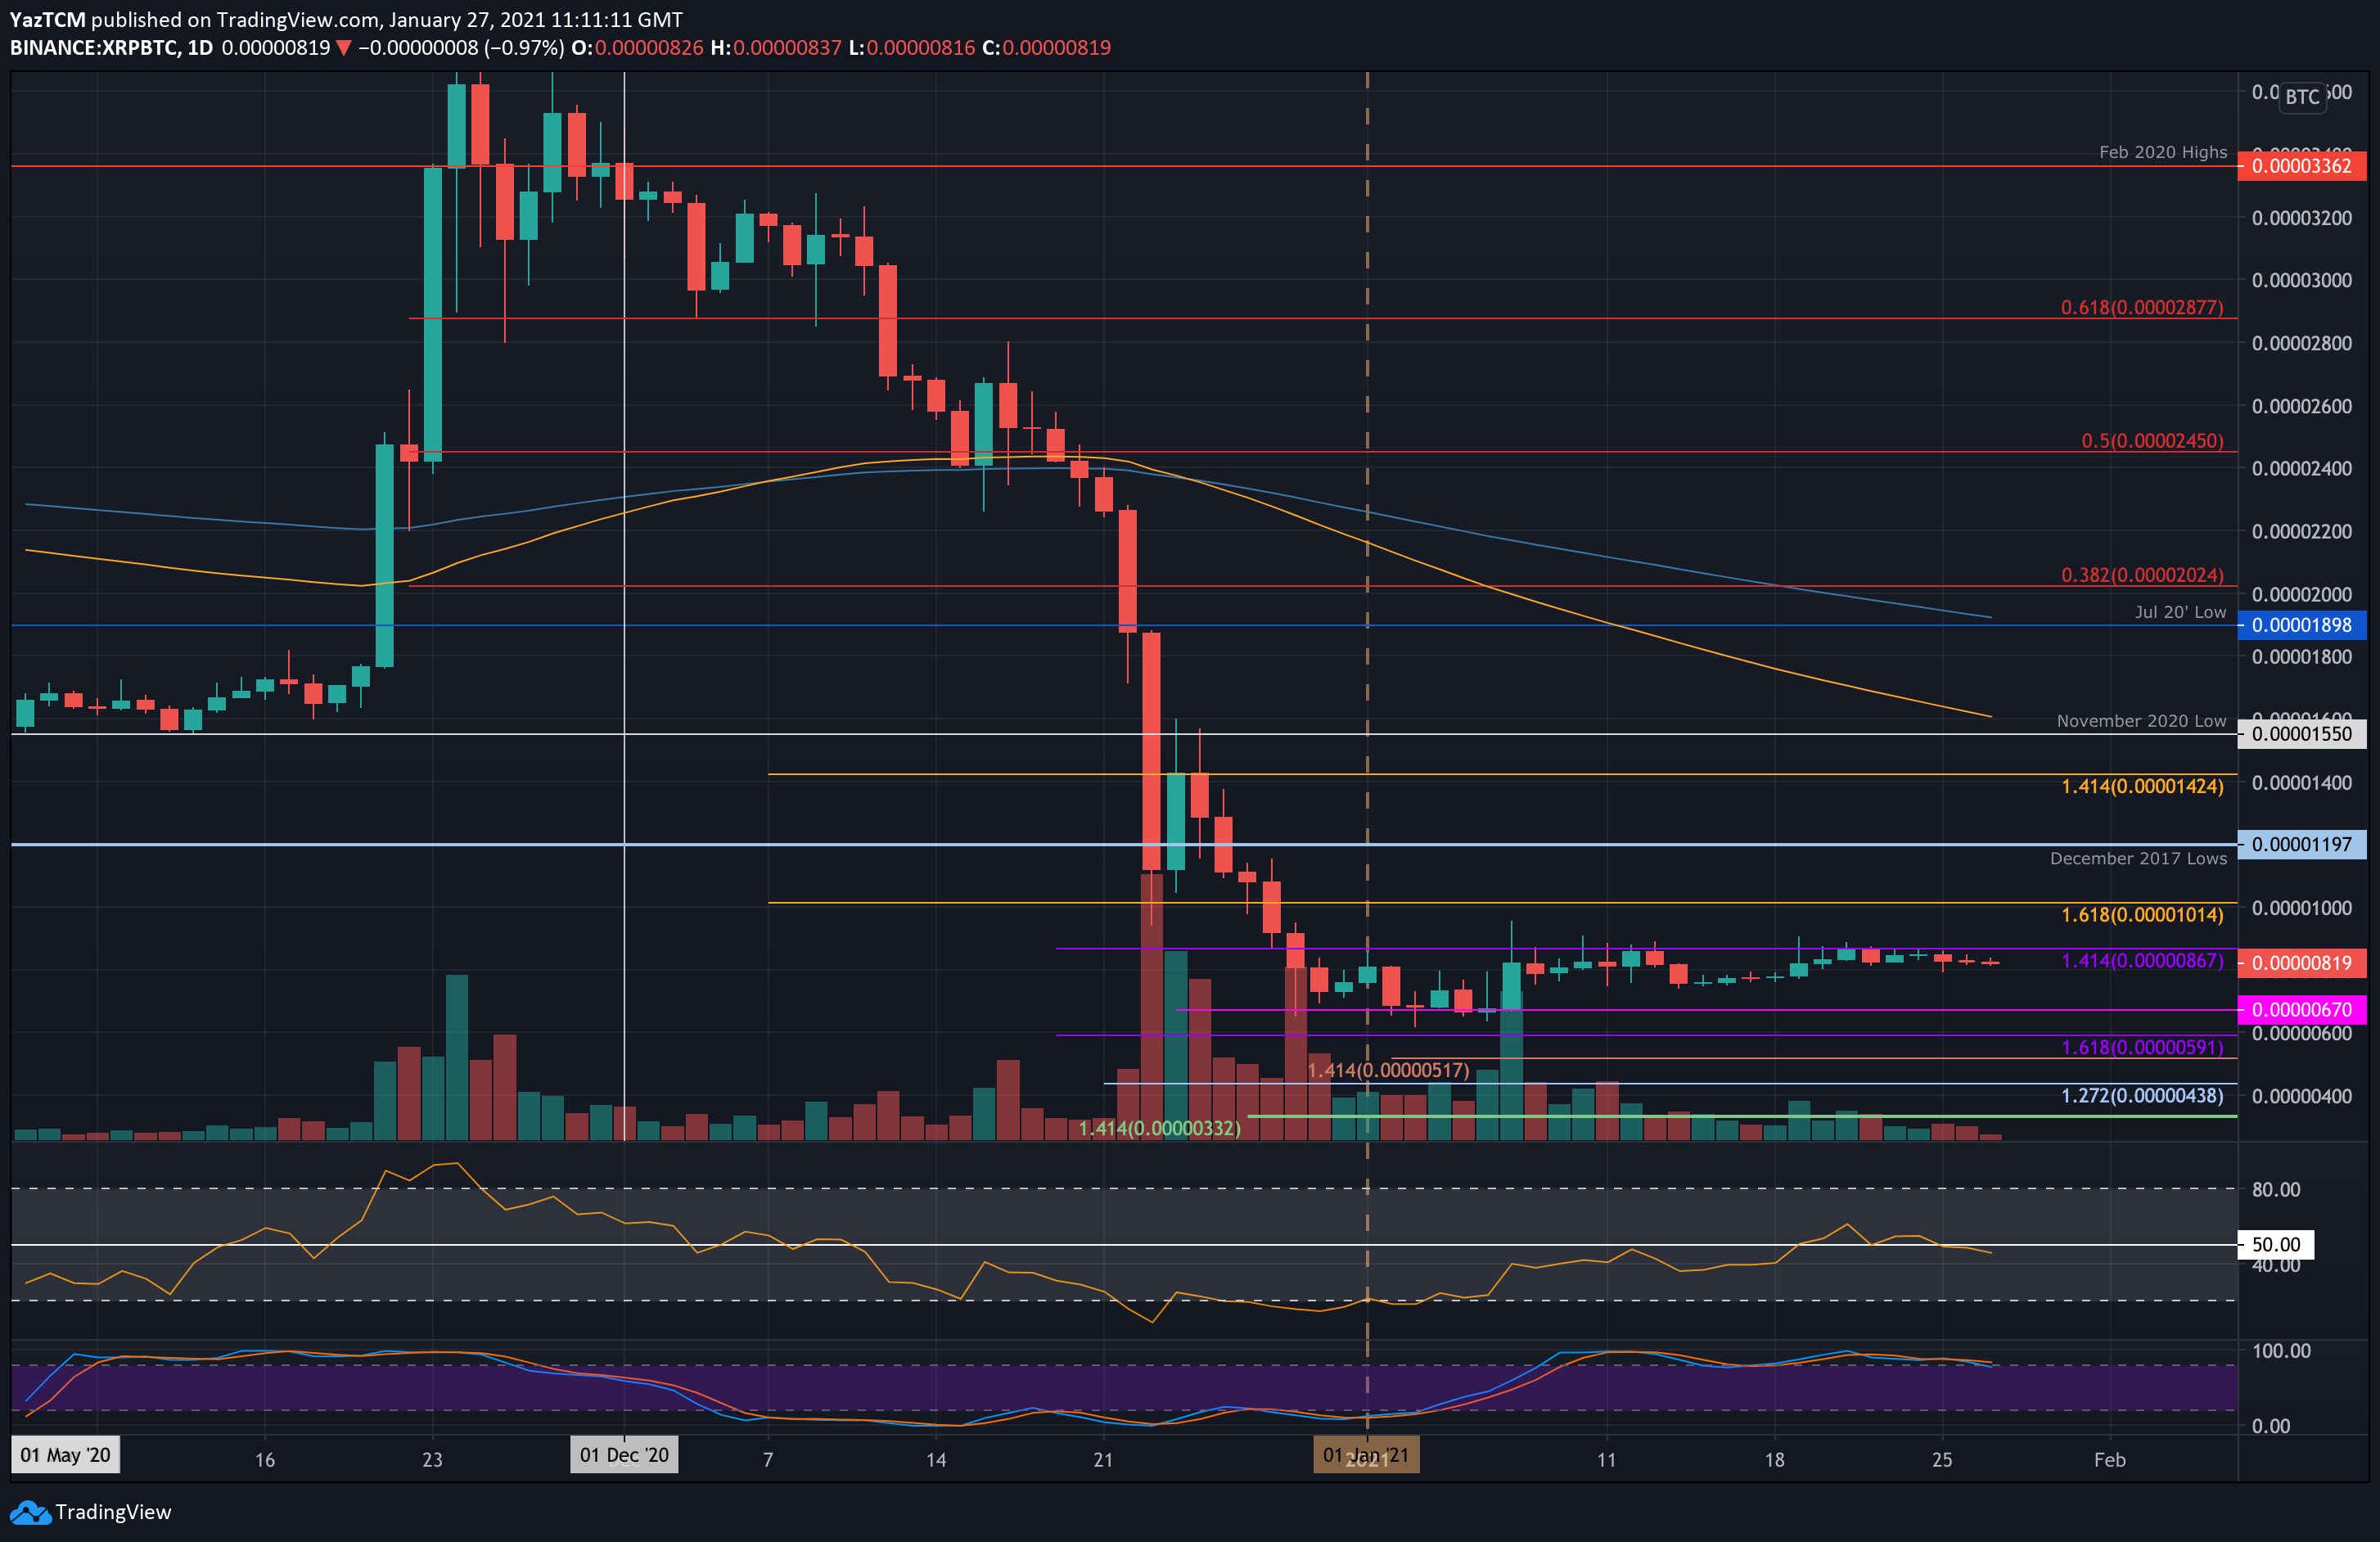
XRP/BTC – Quiet Market With Slow, Rangebound Trading
Key Support Levels: 800 SAT, 670 SAT, 590 SAT.
Key Resistance Levels: 870 SAT, 900 SAT, 1015 SATT.
XRP has been trading sideways after the 70% price drop seen in December. It has established strong support around 670 SAT and strong resistance around 870 SAT. The coin has attempted to break 870 SAT on numerous occasions last week but failed to close a daily candle above it on each attempt.
One of these two levels will need to be penetrated to dictate the next direction for XRP.
XRP-BTC Short Term Price Prediction
Moving forward, the first level of resistance lies at 870 SAT. This is followed by 900 SAT, 1015 SAT, 1200 SAT (December 2017 lows), and 1500 SAT (November 2020 lows).
On the other side, the first level of support lies at 800 SAT. This is followed by 670 SAT, 590 SAT, 520 SAT, 500 SAT, and 440 SAT.
The RSI is trading at the midline, indicating the indecision within the market. For a bullish breakout, the RSI must start to rise from the midline to indicate bullish momentum is picking up.