XRP/USD – XRP Holds .382 Fib Support Key Support Levels: .10, .00, %excerpt%.928.Key Resistance Levels: .25, .36, .40. XRP has dropped a total of 18% since reaching .36 (1.618 Fib Extension) over the weekend. Despite this retracement, the coin is still up 11% over the week after surging from beneath .00. The cryptocurrency is currently trading inside a wide ascending price channel and is currently testing the support at the lower angle. It is further bolstered by a .382 Fib Retracement. A break beneath the price channel could see XRP heading back to . XRP/USD Daily Chart. Source: TradingView.XRP-USD Short Term Price Prediction Looking ahead, if the bears break .10 (.382 Fib), the first support lies at .00. This is followed by %excerpt%.928 (.618 Fib & 20-day MA),
Topics:
Yaz Sheikh considers the following as important: Ripple (XRP) Price, XRP Analysis, xrpbtc, xrpusd
This could be interesting, too:
Jordan Lyanchev writes Ripple’s (XRP) Surge to Triggers Over Million in Short Liquidations
Jordan Lyanchev writes Trump Confirms Work on Strategic Crypto Reserve: XRP, ADA, SOL Included
Dimitar Dzhondzhorov writes Is a Major Ripple v. SEC Lawsuit Development Expected This Week? Here’s Why
Mandy Williams writes Ripple Releases Institutional DeFi Roadmap for XRP Ledger in 2025
XRP/USD – XRP Holds .382 Fib Support
Key Support Levels: $1.10, $1.00, $0.928.
Key Resistance Levels: $1.25, $1.36, $1.40.
XRP has dropped a total of 18% since reaching $1.36 (1.618 Fib Extension) over the weekend. Despite this retracement, the coin is still up 11% over the week after surging from beneath $1.00.
The cryptocurrency is currently trading inside a wide ascending price channel and is currently testing the support at the lower angle. It is further bolstered by a .382 Fib Retracement.
A break beneath the price channel could see XRP heading back to $1.
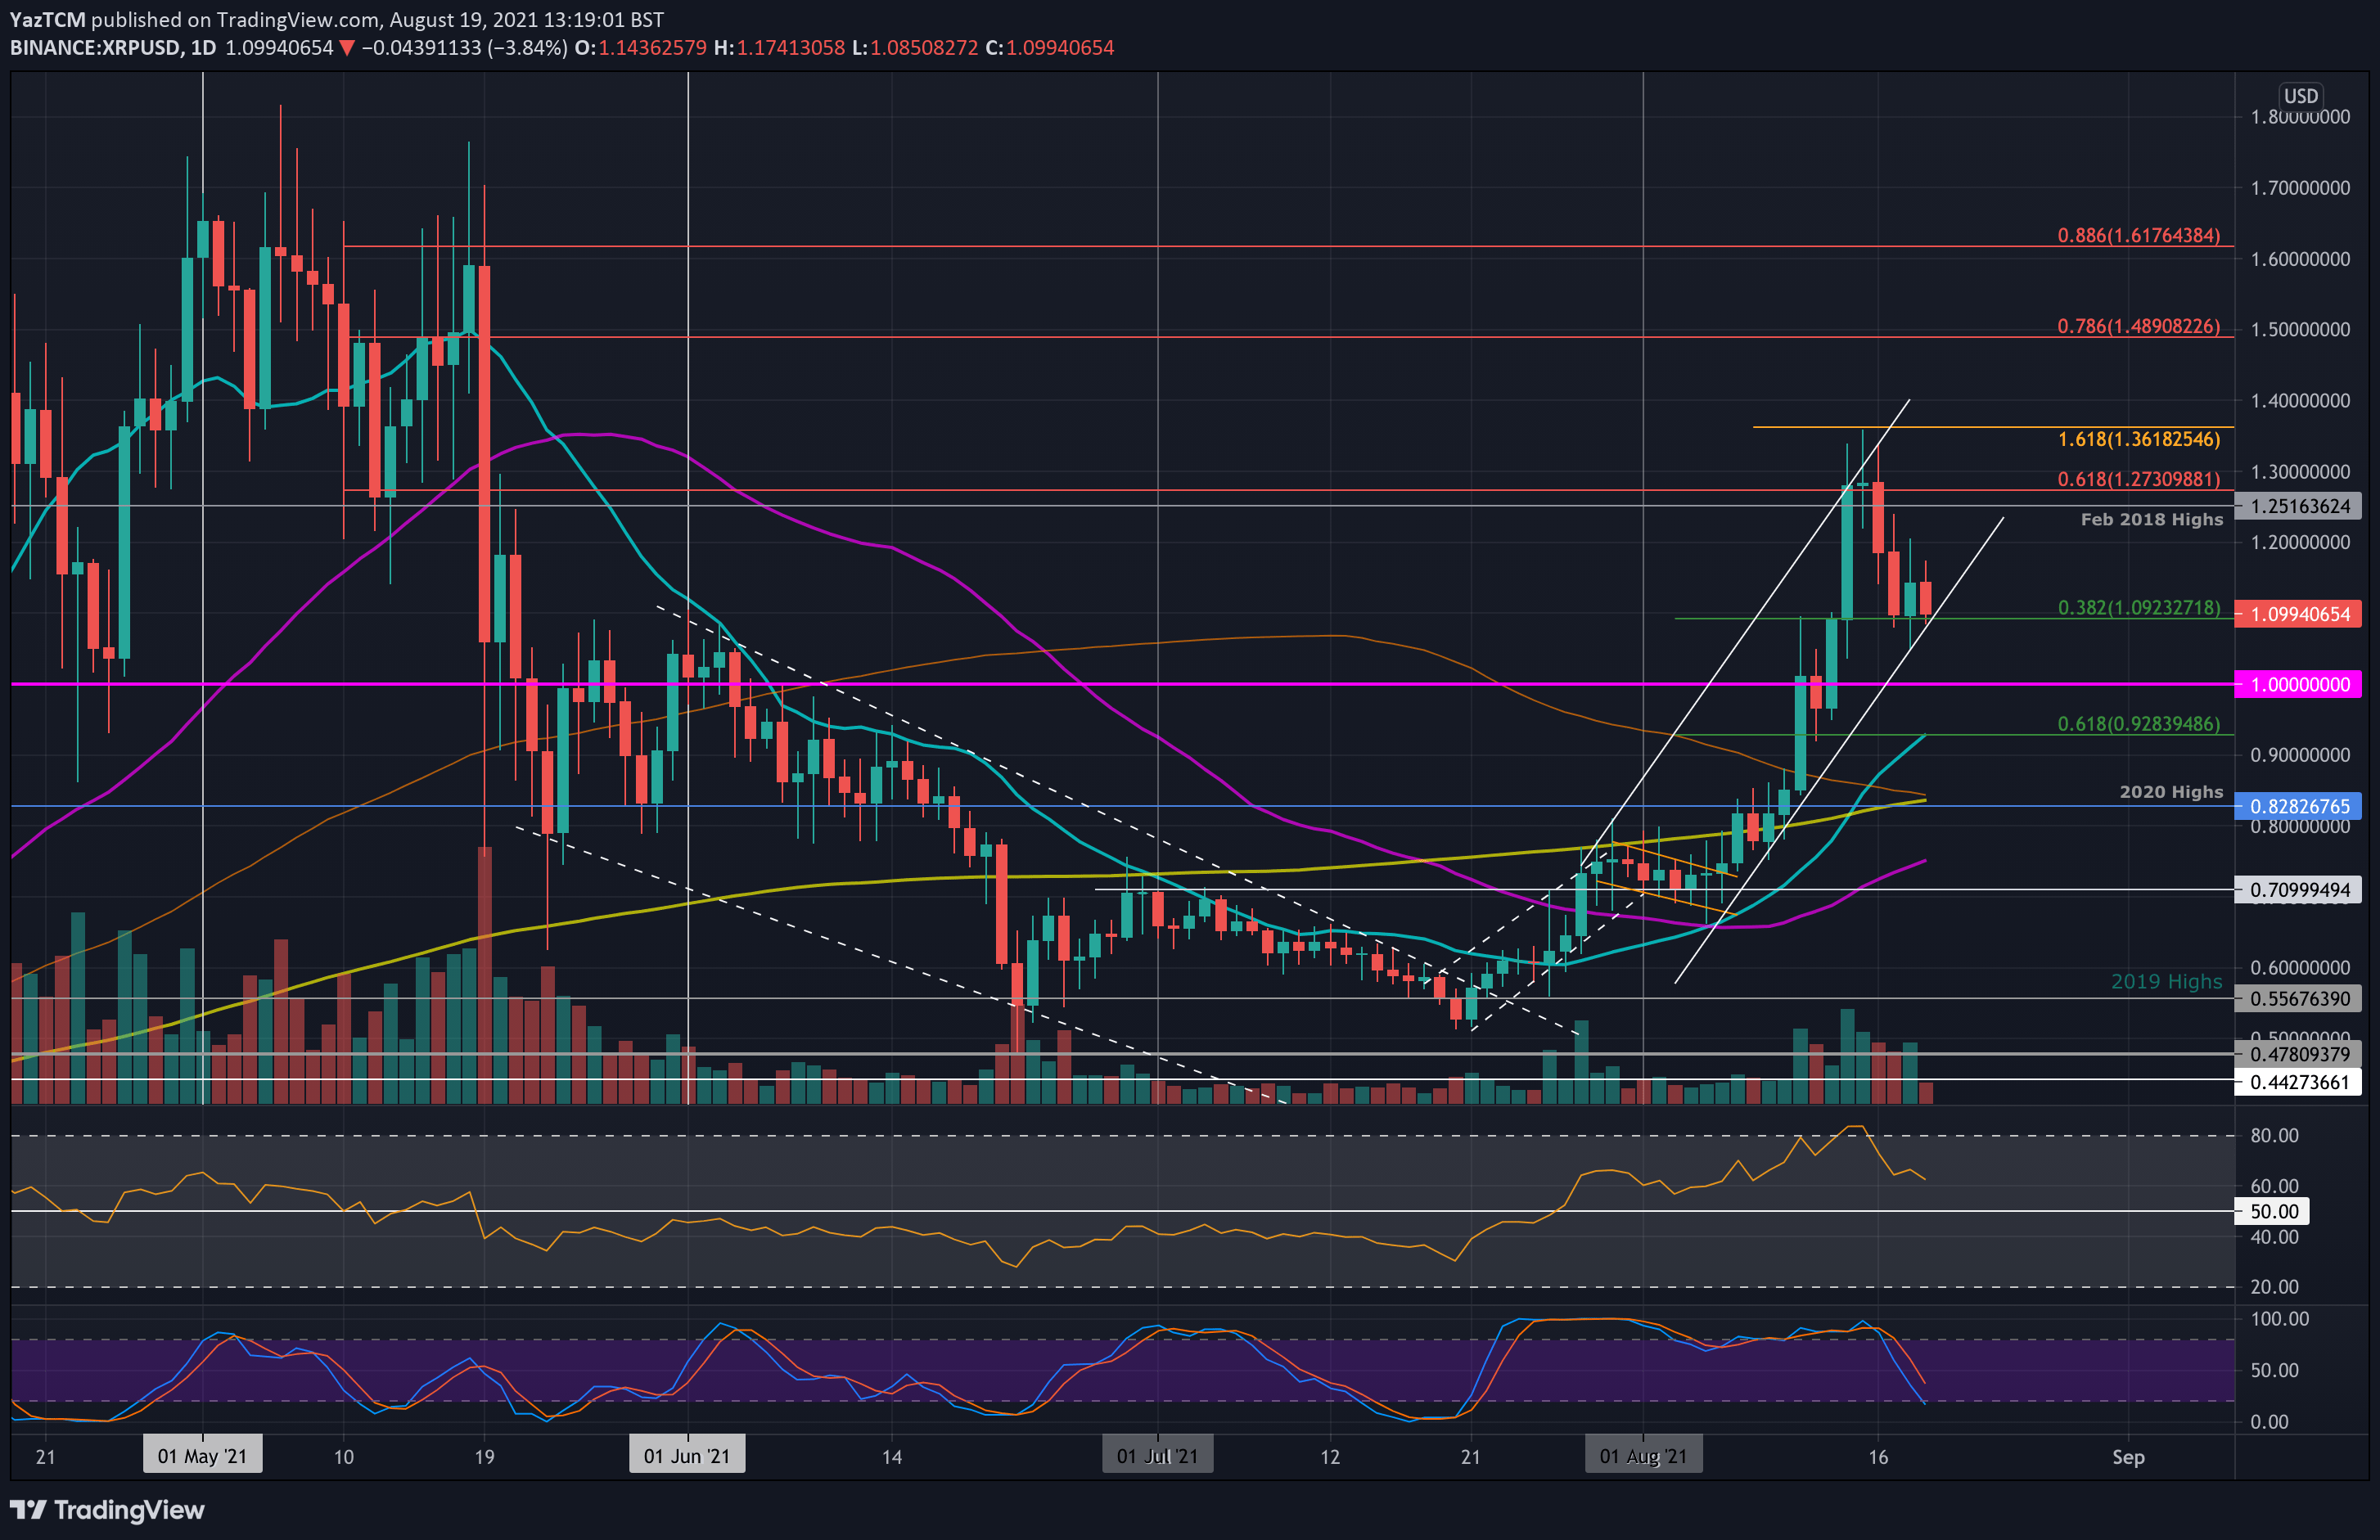
XRP-USD Short Term Price Prediction
Looking ahead, if the bears break $1.10 (.382 Fib), the first support lies at $1.00. This is followed by $0.928 (.618 Fib & 20-day MA), $0.8282 (2020 high & 200-day MA), and $0.75 (50-day MA).
On the other side, the first resistance lies at $1.25 (Feb 2018 highs). This is followed by $1.36 (1.618 Fib Extension), $1.40, and $1.50 (bearish .786 Fib).
The daily RSI has dropped from extremely overbought conditions, indicating the bullish momentum is fading. However, it is still above the midline, so the bears are yet to gain control of the market momentum.
XRP/BTC – XRP Retraces From 1.618 Fib Extension
Key Support Levels: 2380 SAT, 2200 SAT, 2100 SAT.
Key Resistance Levels: 2600 SAT, 2670 SAT, 2730 SAT.
XRP has also retraced against BTC after hitting resistance at 2730 SAT (1.618 Fib Extension) over the weekend. On Tuesday, XRP fell beneath 2600 SAT and continued lower on Wednesday until support was found at 2780 SAT (.382 Fib).
It has since bounced from this support as it attempts to climb back above 2600 SAT.

XRP-BTC Short Term Price Prediction
Looking ahead, the first support below lies at 2380 SAT (.382 Fib). This is followed by 2200 SAT (.5 Fib & 100-day MA), 2100 SAT (.618 Fib & 20-day MA), and 2000 SAT.
On the other side, the first resistance lies at 2600 SAT. This is followed by 2670 SAT (bearish .5 Fib), 2730 SAT (1.618 Fib Extension), 2915 SAT (bearish .618 Fib), and 3000 SAT.
The daily RSI is also falling here, indicating the previous bullish momentum is showing signs of fading.