XRP/USD – Bulls Finally Push Above Symmetrical Triangle Pattern Key Support Levels: .50, .30, .25.Key Resistance Levels: .74, .82, .98. XRP had been trading inside a symmetrical triangle pattern since mid-April. The coin attempted to break toward the upside of this pattern at the start of May but failed to close a daily candle above the upper angle on each attempt. Over the past fortnight, XRP dropped into the support at .25, provided by the Feb 2018 highs. It held this support and rebounded from there this week to hit resistance at .50. Today, XRP pushed higher above .50, reaching as high as .73, allowing it to break above the triangle. Although it has dropped slightly from today’s highs, the buyers are battling to remain above the triangle. We must
Topics:
Yaz Sheikh considers the following as important: Ripple (XRP) Price, XRP Analysis, xrpbtc, xrpusd
This could be interesting, too:
Jordan Lyanchev writes Ripple’s (XRP) Surge to Triggers Over Million in Short Liquidations
Jordan Lyanchev writes Trump Confirms Work on Strategic Crypto Reserve: XRP, ADA, SOL Included
Dimitar Dzhondzhorov writes Is a Major Ripple v. SEC Lawsuit Development Expected This Week? Here’s Why
Mandy Williams writes Ripple Releases Institutional DeFi Roadmap for XRP Ledger in 2025
XRP/USD – Bulls Finally Push Above Symmetrical Triangle Pattern
Key Support Levels: $1.50, $1.30, $1.25.
Key Resistance Levels: $1.74, $1.82, $1.98.
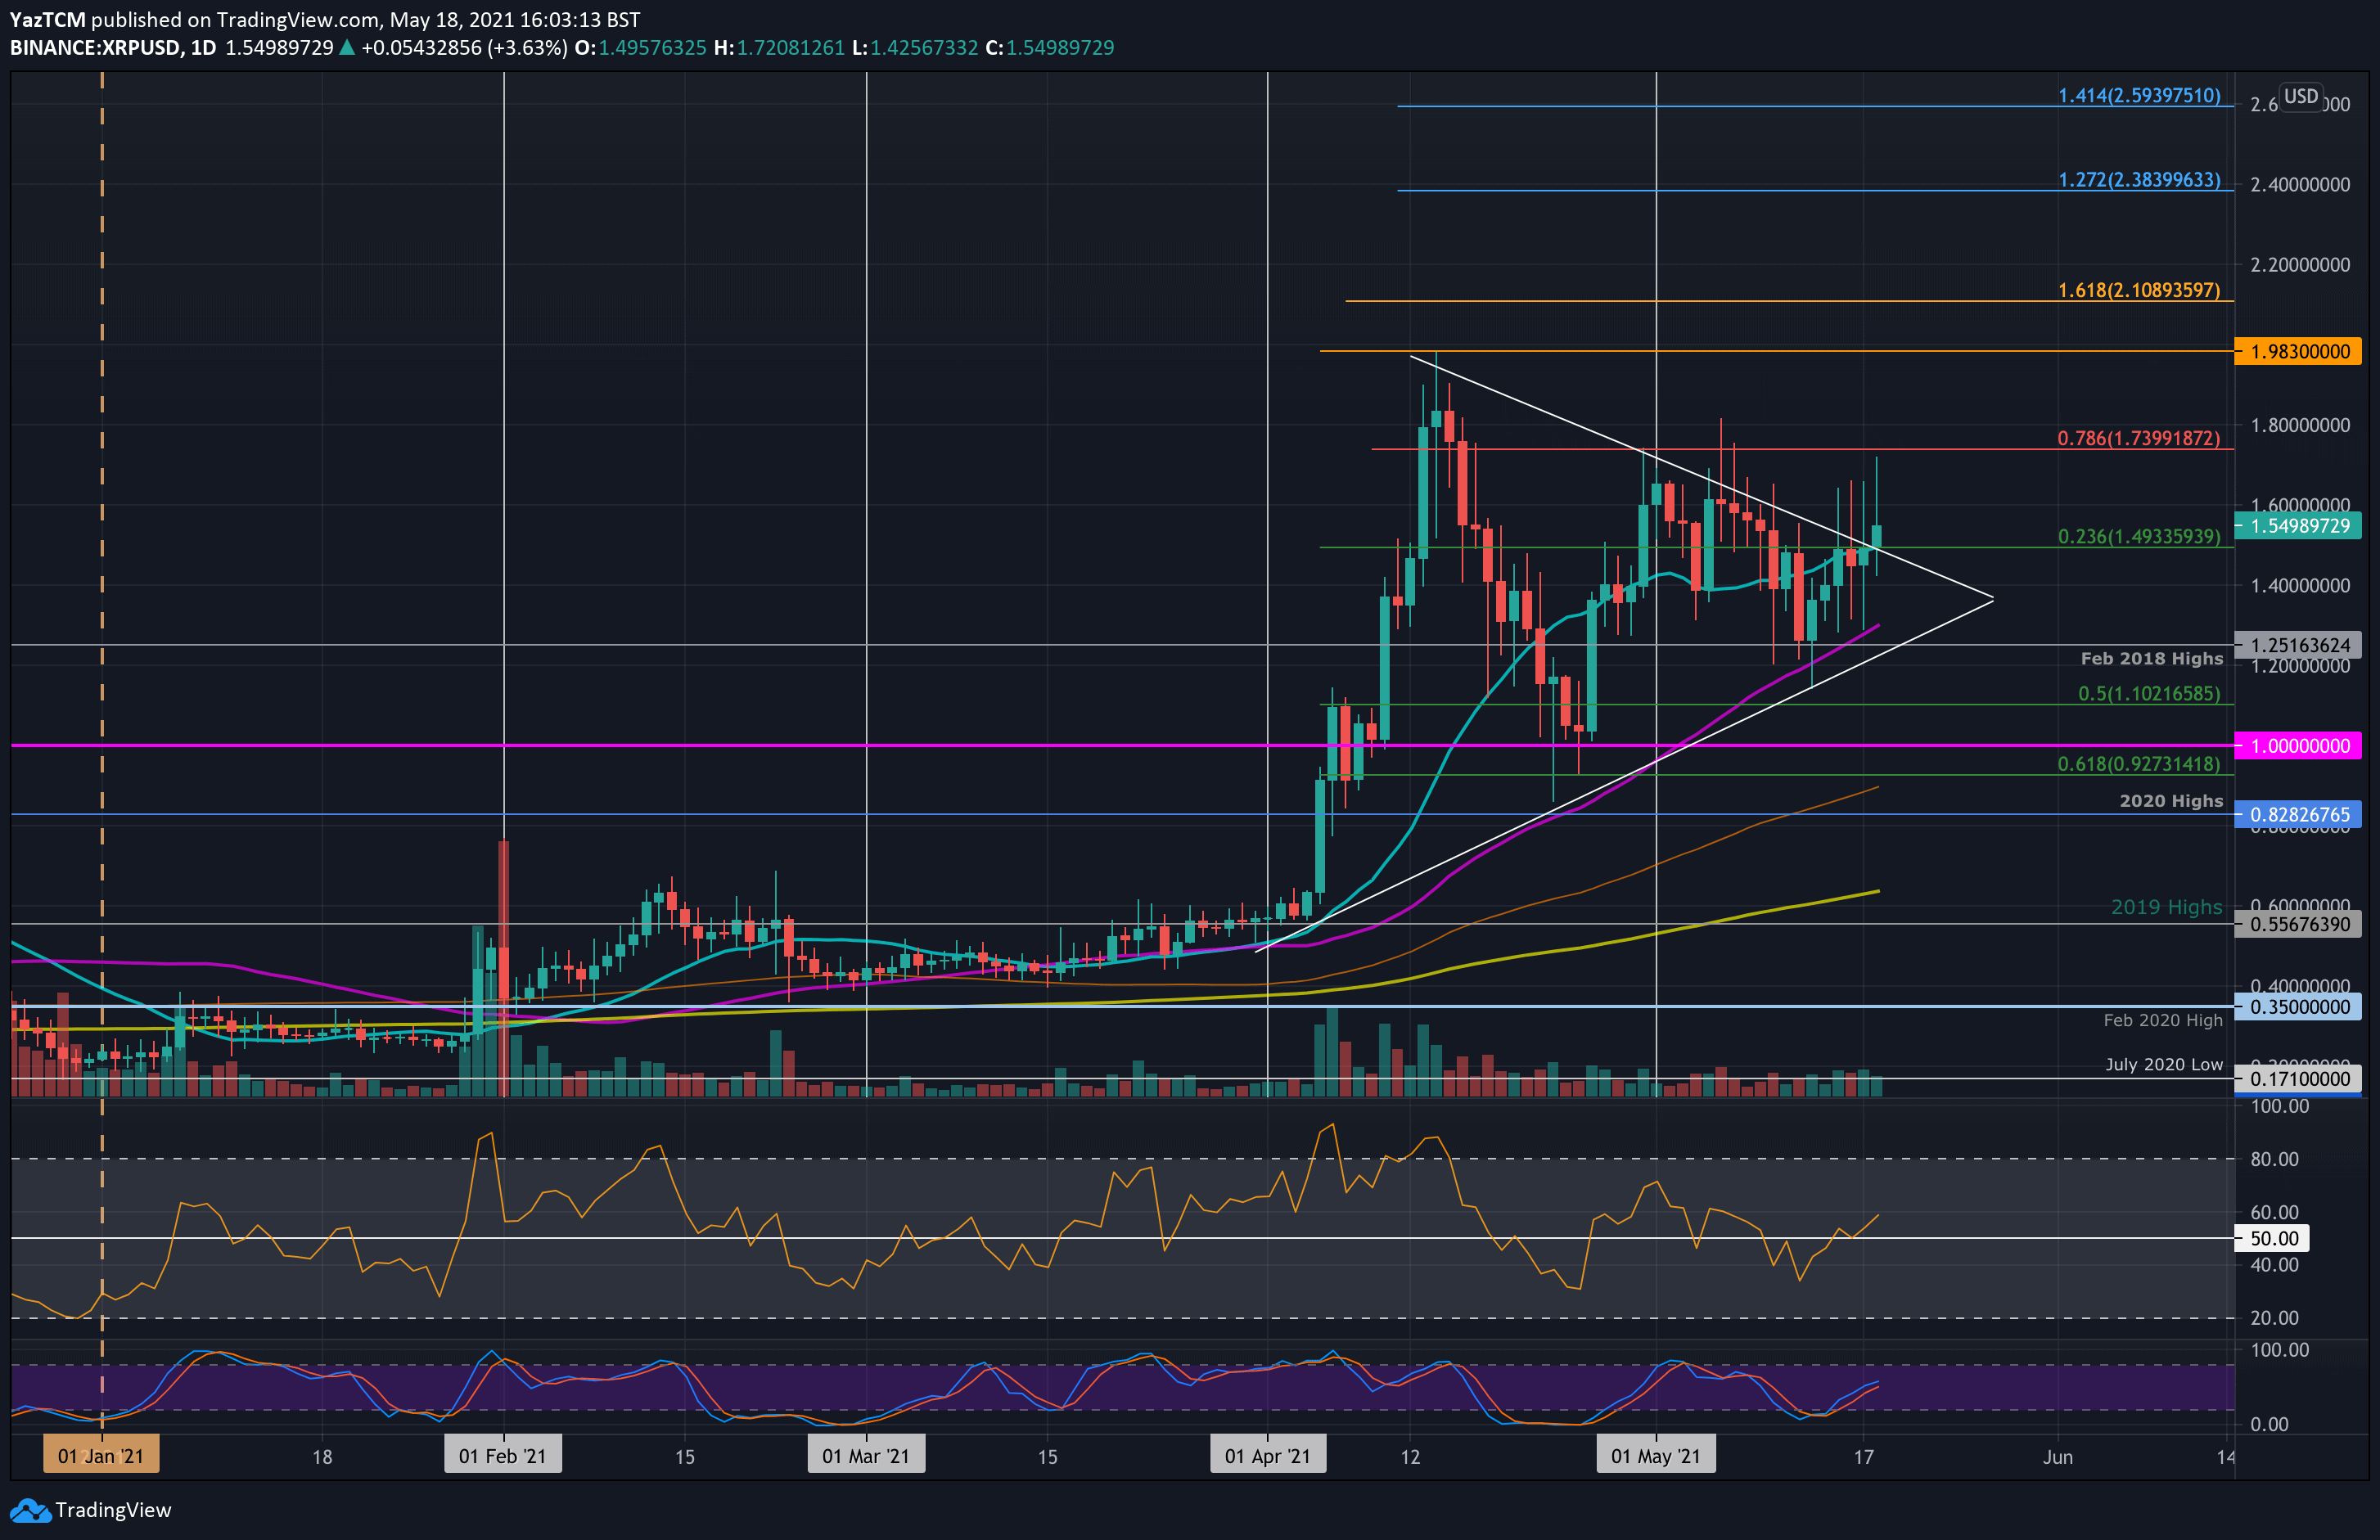
XRP had been trading inside a symmetrical triangle pattern since mid-April. The coin attempted to break toward the upside of this pattern at the start of May but failed to close a daily candle above the upper angle on each attempt.
Over the past fortnight, XRP dropped into the support at $1.25, provided by the Feb 2018 highs. It held this support and rebounded from there this week to hit resistance at $1.50.
Today, XRP pushed higher above $1.50, reaching as high as $1.73, allowing it to break above the triangle. Although it has dropped slightly from today’s highs, the buyers are battling to remain above the triangle. We must wait for today’s candle to close above the triangle to confirm the breakout.
XRP-USD Short Term Price Prediction
Looking ahead, the first strong resistance lies at $1.74 (bearish .786 Fib). This is followed by $1.82 (May highs), $1.98 (April Highs), and $2.10 (1.618 Fib Extension). Added resistance lies at $2.20, $2.38, and $2.60.
On the other side, the first support lies at $1.50 (.236 Fib & 20-day MA). This is followed by $1.30 (50-day MA), $1.25 (Feb 2018 highs), and $1.10 (.5 Fib).
The RSI recently broke back above the midline as the bulls take control of the market momentum. It will need to continue to rise for XRP to head back above the May highs.
XRP/BTC – Bulls Break Ascending Triangle Pattern
Key Support Levels: 3362 SAT, 3200 SAT, 3060 SAT.
Key Resistance Levels: 3783 SAT, 4105 SAT, 4275 SAT.
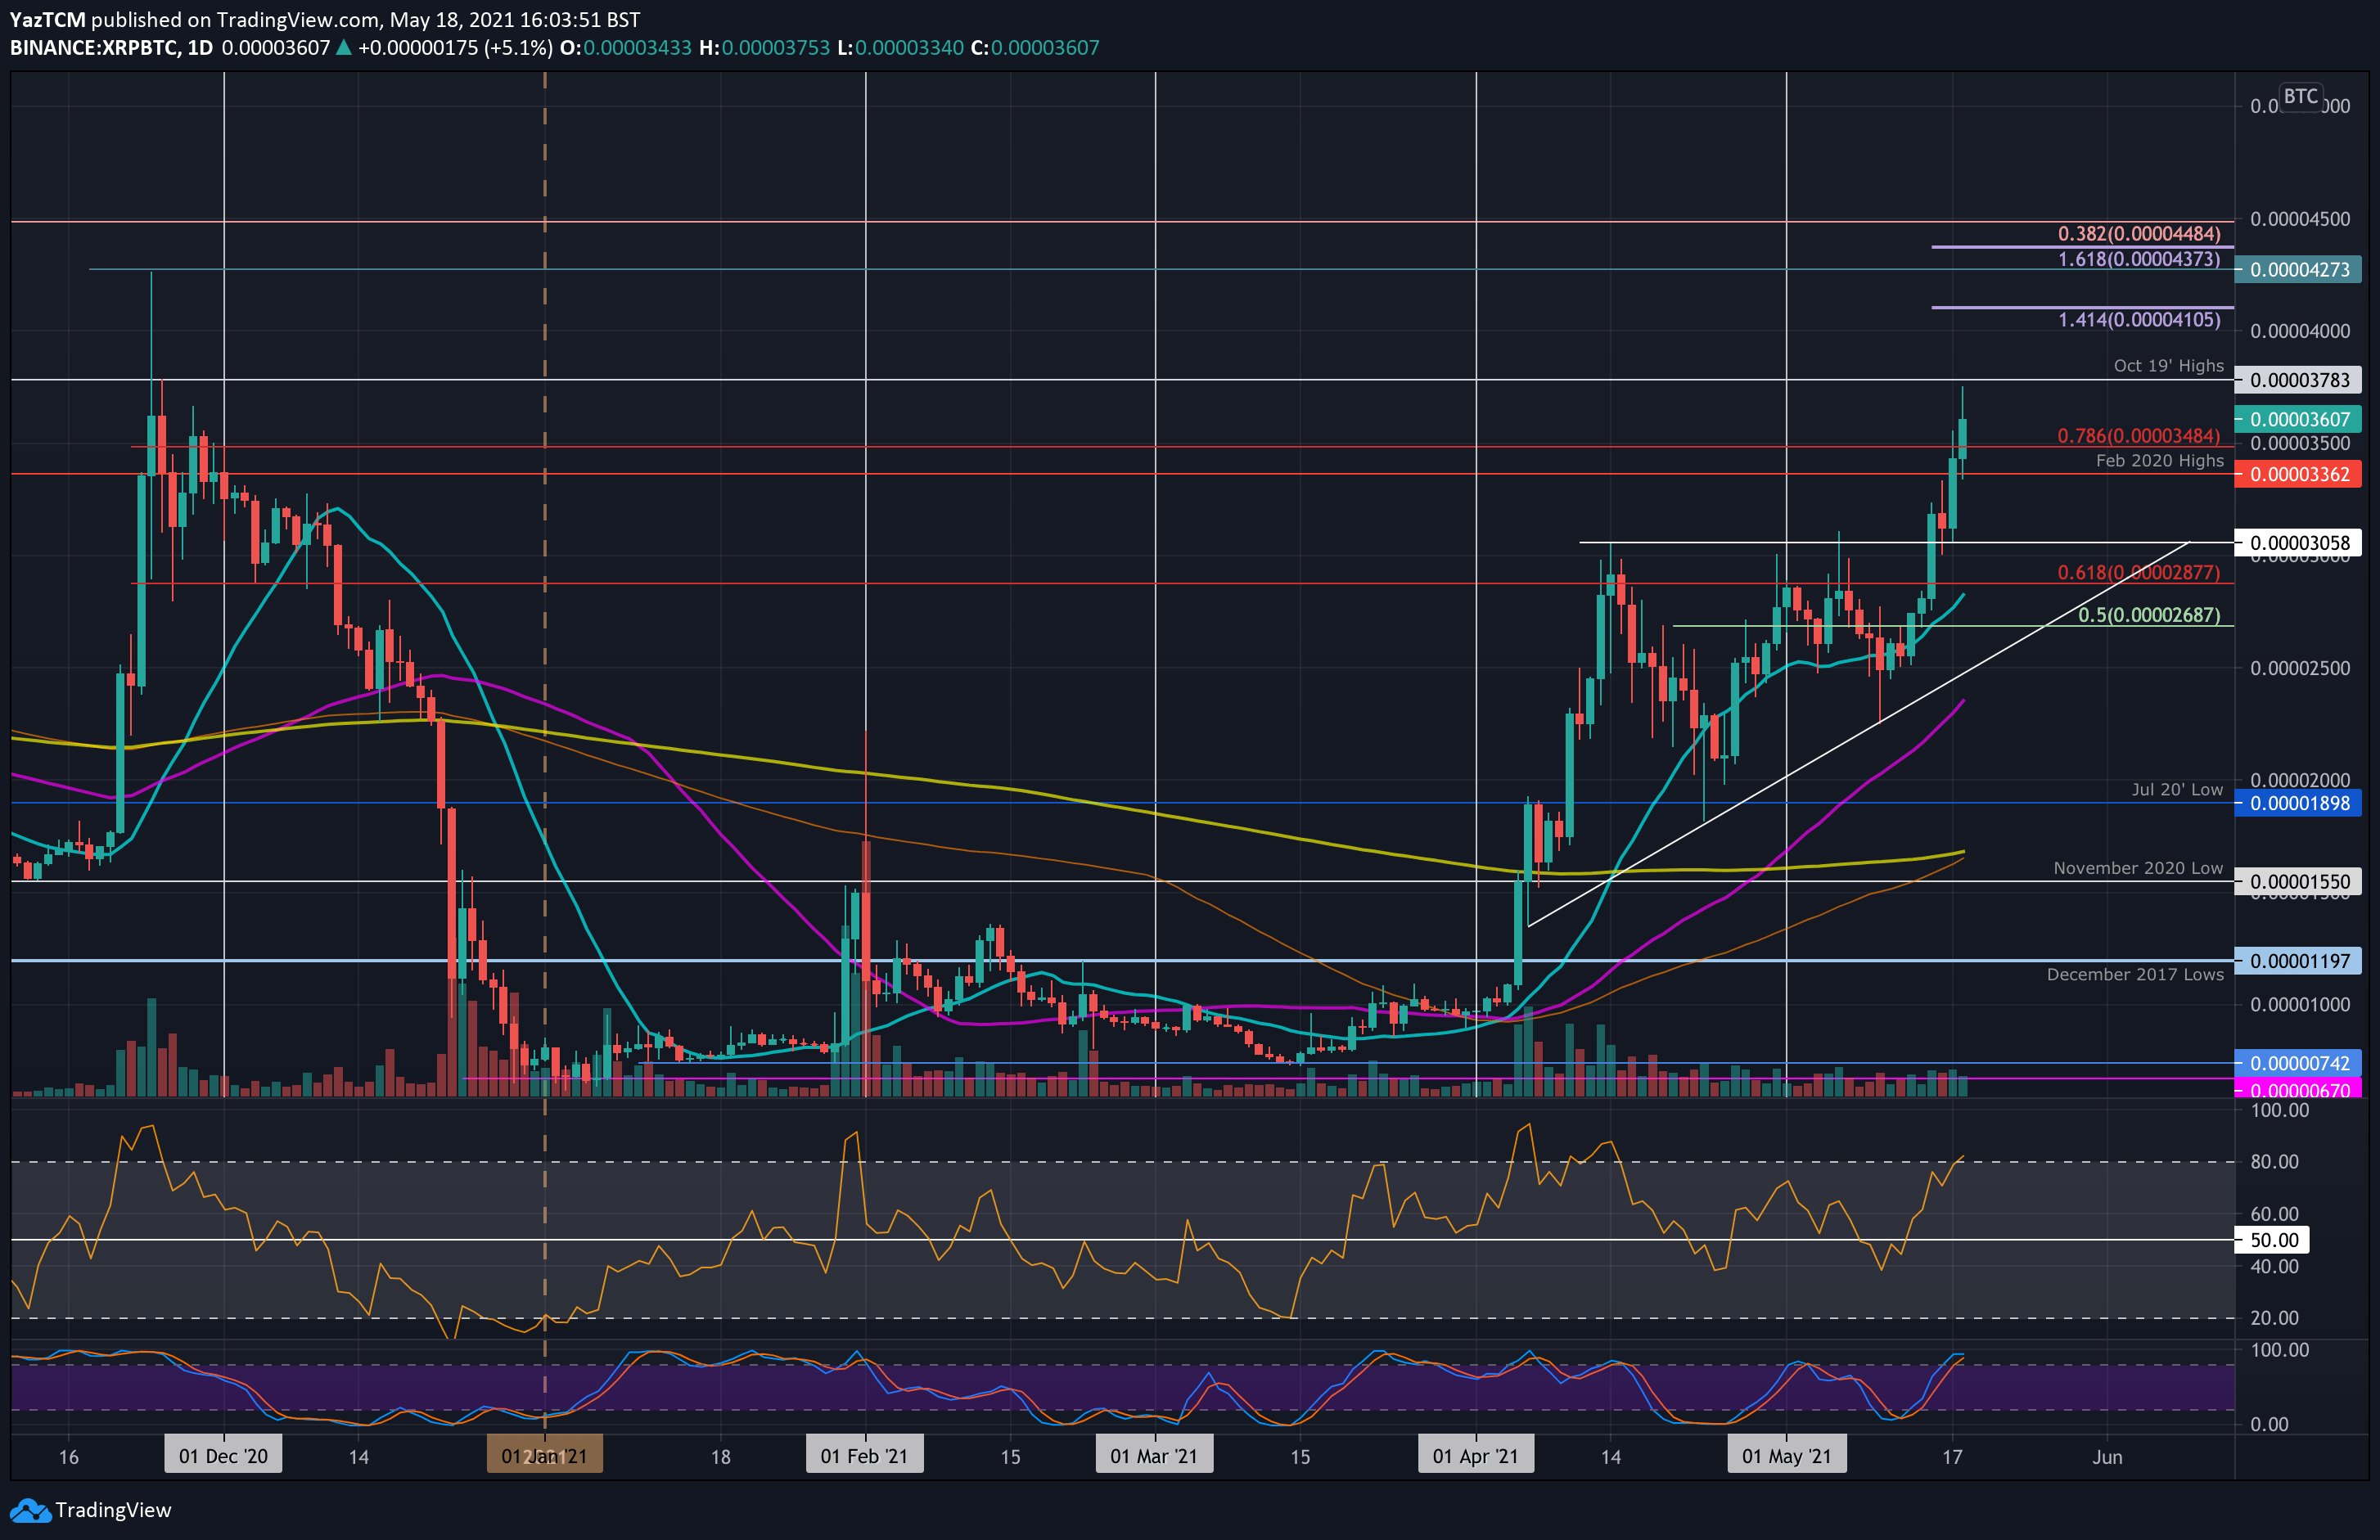
XRP also managed to break an ascending triangle pattern against bitcoin this week as it smashed above 3058 SAT (April highs).
Since breaking out, XRP continued to climb beyond the Feb 2020 highs at 2262 SAT, and a bearish .786 Fib at 3484 SAT and reached as high as the October 2019 highs around 3780 SAT.
XRP-BTC Short Term Price Prediction
Looking ahead, If the bulls can break 3783 SAT (Oct 2019 highs), the first resistance is at 4105 SAT (1.414 Fib Extension). This is followed by 4273 SAT (Nov 2020 highs), 4500 SAT (long term bearish .382 Fib), and 5000 SAT.
On the other side, the first support lies at 3362 SAT (Feb 2020 highs). This is followed by 3200 SAT, 3060 SAT (April highs), and 2870 SAT (20-day MA).
The RSI is approaching overbought conditions but still has room to continue higher before the market becomes extremely overbought. However, the Stochastic RSI is lined up for a bearish crossover signal that might lead to a retracement.