XRP/USD – Bulls Continue Battle To Break Falling Trend Line.Key Support Levels: %excerpt%.453, %excerpt%.42, %excerpt%.4.Key Resistance Levels: %excerpt%.5, %excerpt%.556, %excerpt%.6.XRP has been trading inside a falling wedge pattern for the past month as it struggles to break the upper boundary of the formation. It had rebounded from the lower boundary of the wedge at the start of March but failed to surpass %excerpt%.5, the upper boundary, over the past fortnight.XRP fell beneath support at %excerpt%.453 (.5 Fib) as it dropped to %excerpt%.4 (.618 Fib) at the start of this week. It rebounded from there on Monday as it started to push higher, but it is still struggling with the falling trend line (wedge’s upper boundary). Yesterday, XRP spiked as high as %excerpt%.55 but still closed the daily candle inside the wedge.XRP/USD Daily Chart. Source:
Topics:
Yaz Sheikh considers the following as important: Ripple (XRP) Price, XRP Analysis, xrpbtc, xrpusd
This could be interesting, too:
Jordan Lyanchev writes Ripple’s (XRP) Surge to Triggers Over Million in Short Liquidations
Jordan Lyanchev writes Trump Confirms Work on Strategic Crypto Reserve: XRP, ADA, SOL Included
Dimitar Dzhondzhorov writes Is a Major Ripple v. SEC Lawsuit Development Expected This Week? Here’s Why
Mandy Williams writes Ripple Releases Institutional DeFi Roadmap for XRP Ledger in 2025
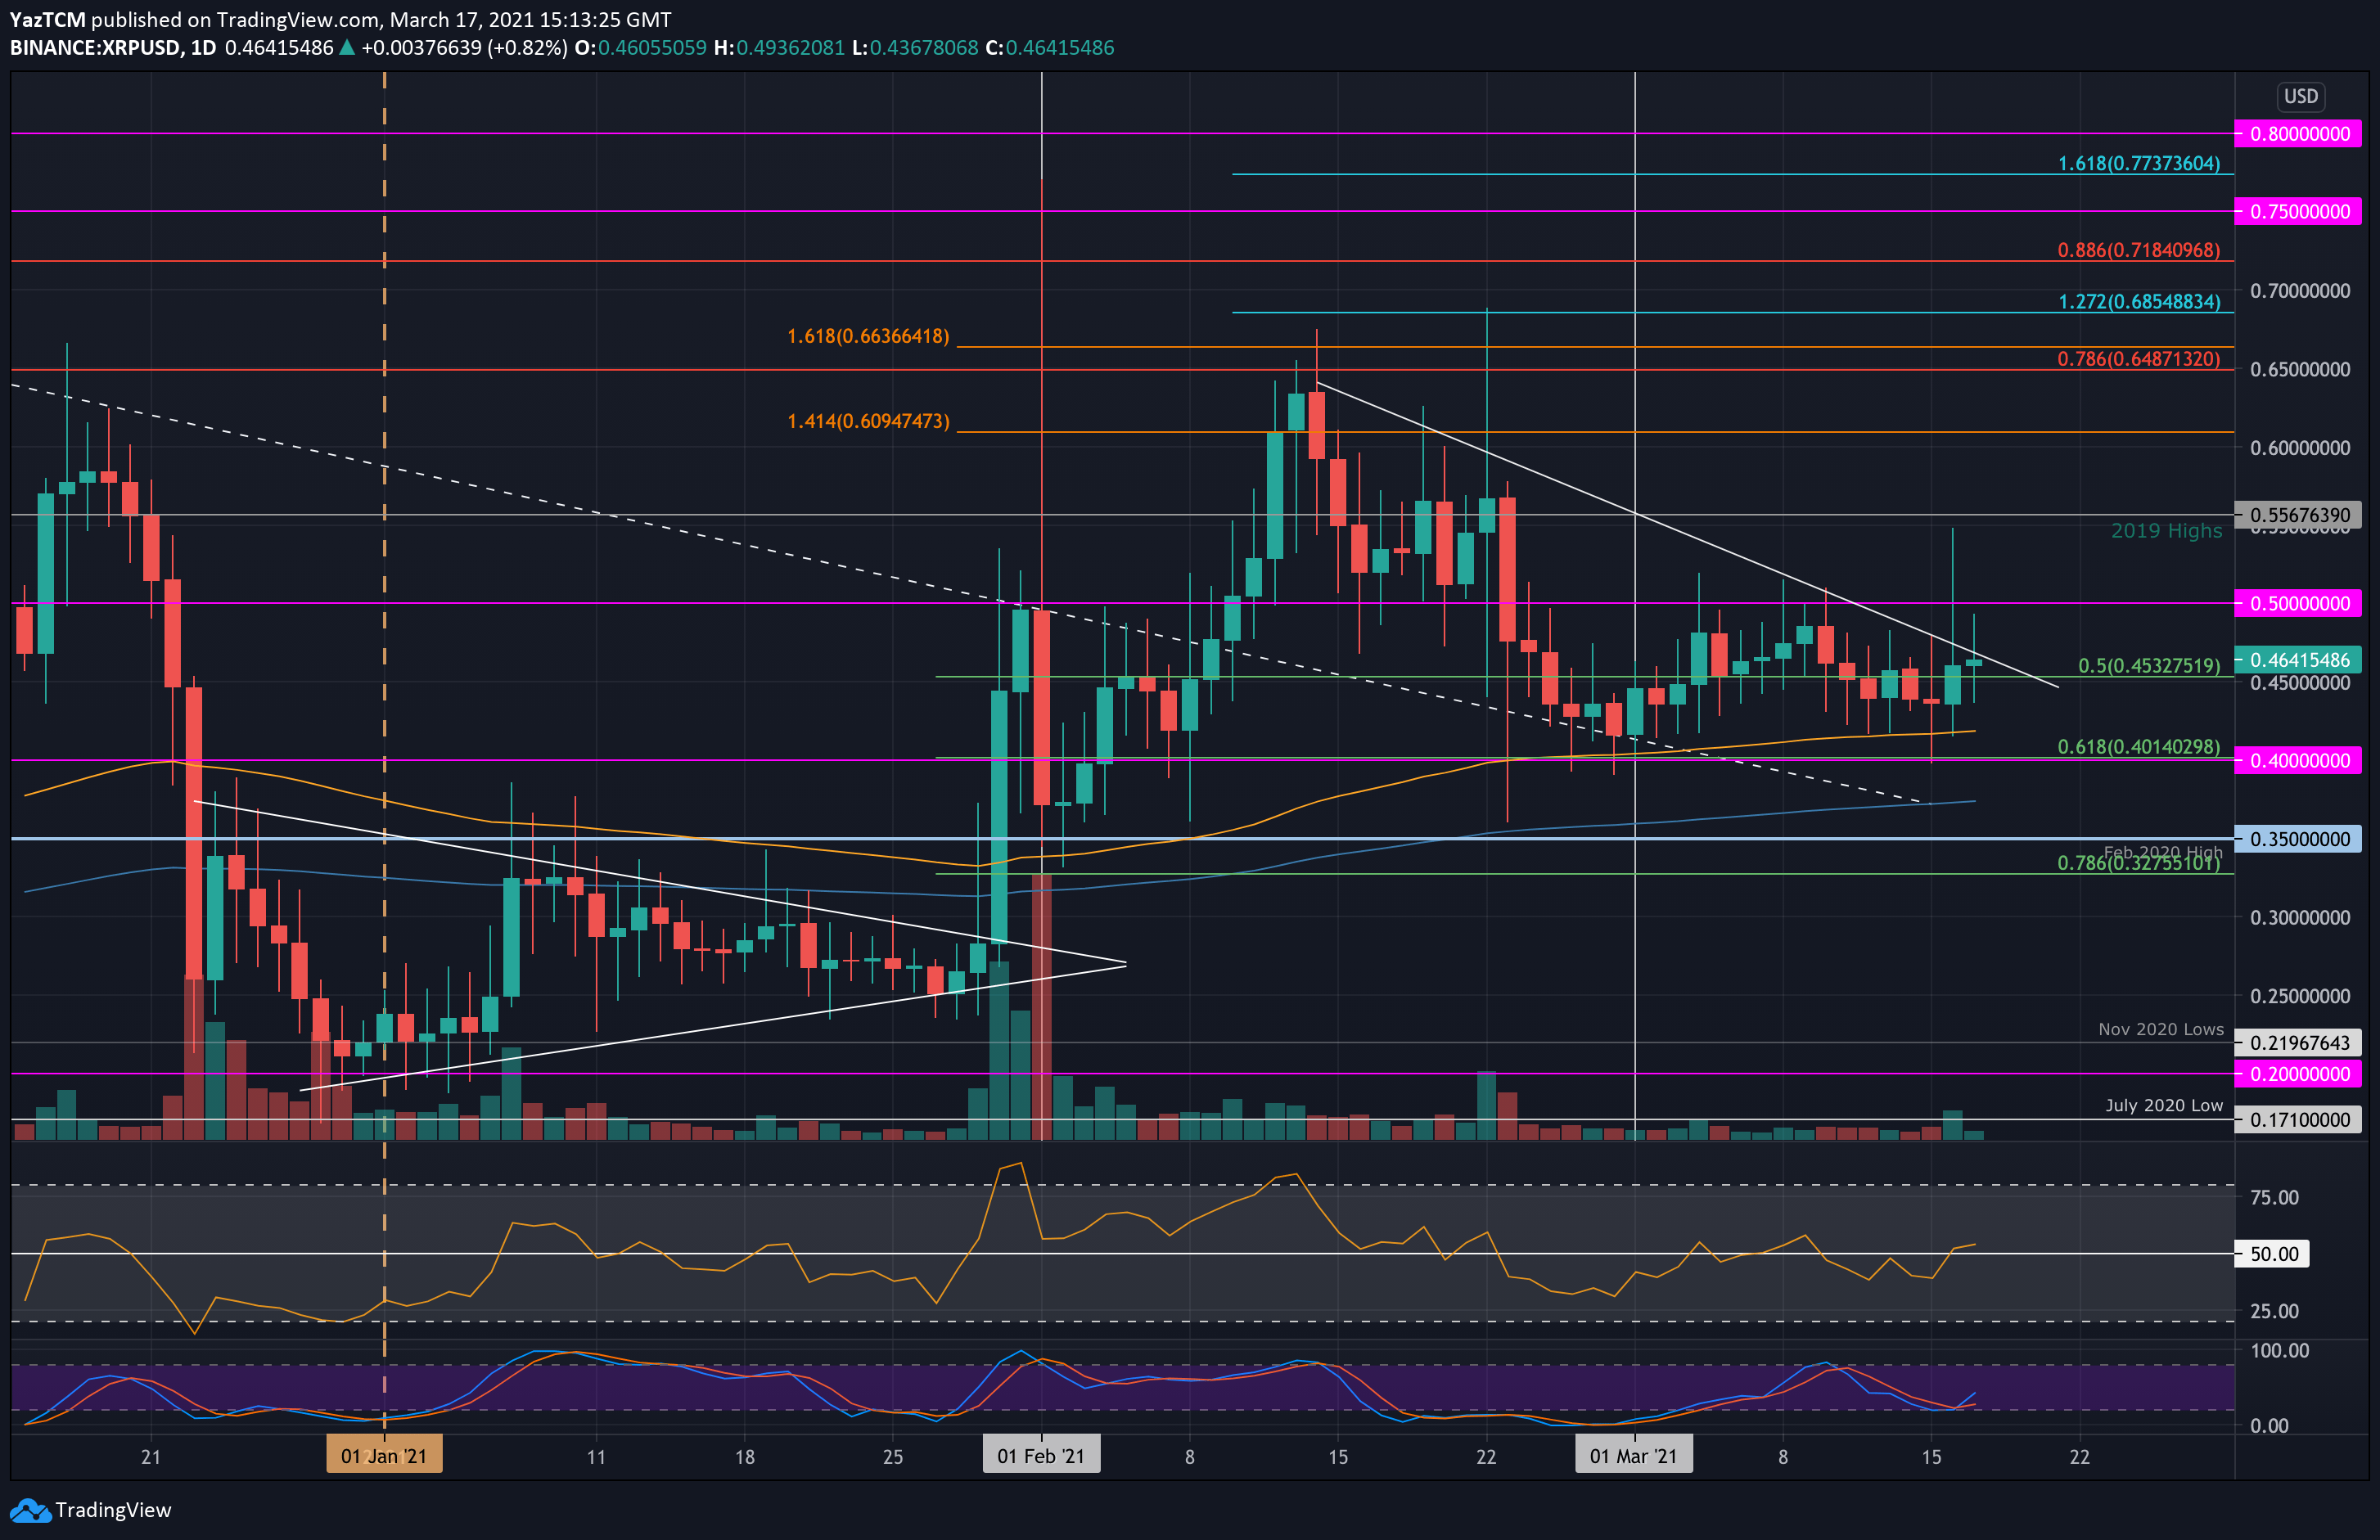
XRP/USD – Bulls Continue Battle To Break Falling Trend Line.
Key Support Levels: $0.453, $0.42, $0.4.
Key Resistance Levels: $0.5, $0.556, $0.6.
XRP has been trading inside a falling wedge pattern for the past month as it struggles to break the upper boundary of the formation. It had rebounded from the lower boundary of the wedge at the start of March but failed to surpass $0.5, the upper boundary, over the past fortnight.
XRP fell beneath support at $0.453 (.5 Fib) as it dropped to $0.4 (.618 Fib) at the start of this week. It rebounded from there on Monday as it started to push higher, but it is still struggling with the falling trend line (wedge’s upper boundary). Yesterday, XRP spiked as high as $0.55 but still closed the daily candle inside the wedge.
XRP-USD Short Term Price Prediction
Looking ahead, the first level of resistance lies at the upper boundary of the wedge. Above this, resistance lies at $0.5, $0.556 (2019 Highs), and $0.6. Additional resistance lies at $0.648 (bearish .786 Fib) and $0.685 (1.272 Fib Extension – blue).
On the other side, the first support lies at $0.453 (.5 Fib). This is followed by $0.42 (100-day EMA), $0.4 (.618 Fib), and $0.375 (200-days EMA).
The RSI recently broke back above the midline, indicating that the bulls are attempting to take control of the market momentum. If the RSI can rise higher from 50, the increased bullish momentum should help XRP break above the wedge and push past $0.5.
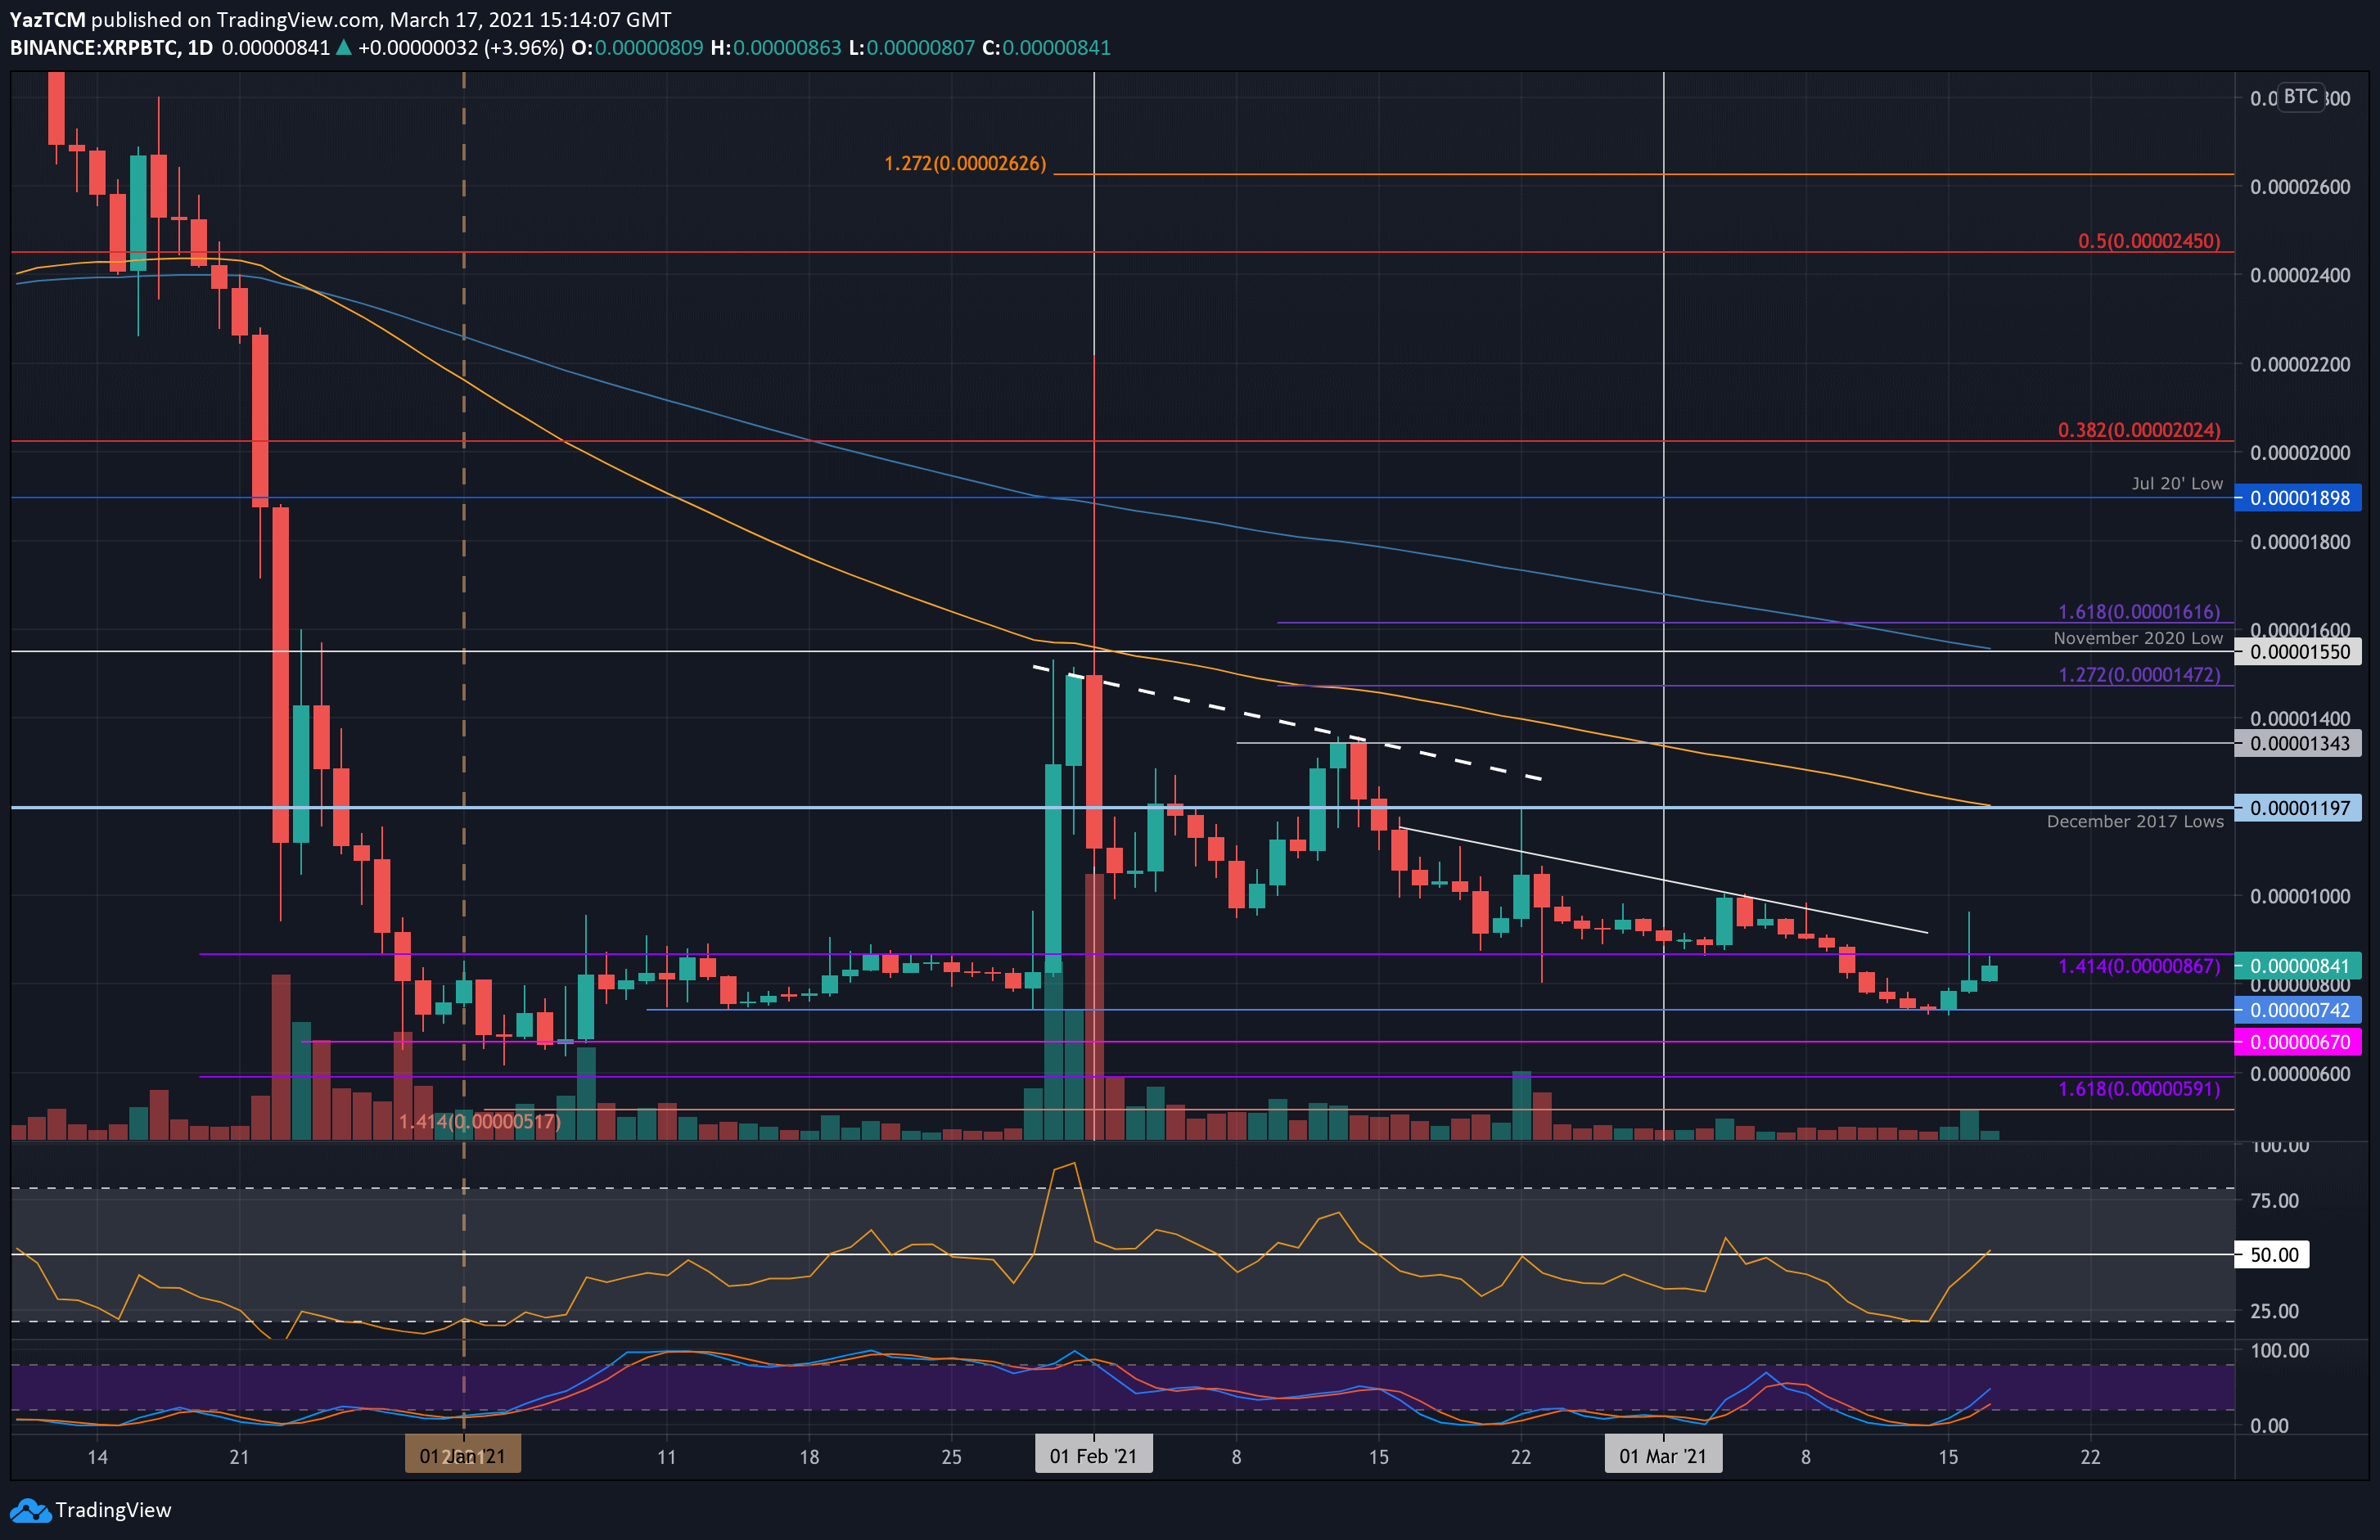
XRP/BTC – Market Trades Inside January Trading range
Key Support Levels: 800 SAT, 740 SAT, 670 SAT.
Key Resistance Levels: 867 SAT, 1000 SAT, 1200 SAT.
XRP is struggling against Bitcoin in March. The coin has dropped from resistance at 1000 SAT and has fallen back into the trading range that was seen during January, between 867 SAT and 670 SAT.
After falling back into this range, XRP continued to drop until support was found at 740 SAT, where it rebounded at the start of this week. It is now attempting to break the upper boundary of the range as it battles to get above 867 SAT.
XRP-BTC Short Term Price Prediction
Moving forward, the first level of resistance lies at 867 SAT. This is followed by 1000 SAT, 1200 SAT (100-day EMA & December 2017 lows), and 1345 SAT.
On the other side, the first support lies at 800 SAT. This is followed by 740 SAT, 670 SAT, and 600 SAT.
Likewise, the RSI has made its way back toward the midline as the bearish momentum fades. If it can break higher from 50, the bullish momentum will increase and is likely to push XRP back toward 1000 SAT. Additionally, the Stochastic RSI also produced a bullish crossover signal earlier this week.