XRP/USD – XRP Bulls Holding .618 Fib SupportKey Support Levels: %excerpt%.263, %excerpt%.25, %excerpt%.23.Key Resistance Levels: %excerpt%.3, %excerpt%.32, %excerpt%.35.XRP might be down 11% over the past week after falling from resistance at the 200-days EMA, but the cryptocurrency is still trading within a consolidation pattern known as a symmetrical triangle.Over the past four days, XRP has managed to remain supported by the .618 Fib Retracement at around %excerpt%.263 and has recently rebounded from here. The cryptocurrency still has a long way to recover from the disastrous December performance and only a break above %excerpt%.35 (100-days EMA) would indicate the bulls are ready to start the recovery process.XRP/USD Daily Chart. Source: TradingViewXRP-USD Short Term Price PredictionLooking ahead, the first level of resistance lies at %excerpt%.3
Topics:
Yaz Sheikh considers the following as important: Ripple (XRP) Price, XRP Analysis, xrpbtc, xrpusd
This could be interesting, too:
Jordan Lyanchev writes Ripple’s (XRP) Surge to Triggers Over Million in Short Liquidations
Jordan Lyanchev writes Trump Confirms Work on Strategic Crypto Reserve: XRP, ADA, SOL Included
Dimitar Dzhondzhorov writes Is a Major Ripple v. SEC Lawsuit Development Expected This Week? Here’s Why
Mandy Williams writes Ripple Releases Institutional DeFi Roadmap for XRP Ledger in 2025
XRP/USD – XRP Bulls Holding .618 Fib Support
Key Support Levels: $0.263, $0.25, $0.23.
Key Resistance Levels: $0.3, $0.32, $0.35.
XRP might be down 11% over the past week after falling from resistance at the 200-days EMA, but the cryptocurrency is still trading within a consolidation pattern known as a symmetrical triangle.
Over the past four days, XRP has managed to remain supported by the .618 Fib Retracement at around $0.263 and has recently rebounded from here. The cryptocurrency still has a long way to recover from the disastrous December performance and only a break above $0.35 (100-days EMA) would indicate the bulls are ready to start the recovery process.
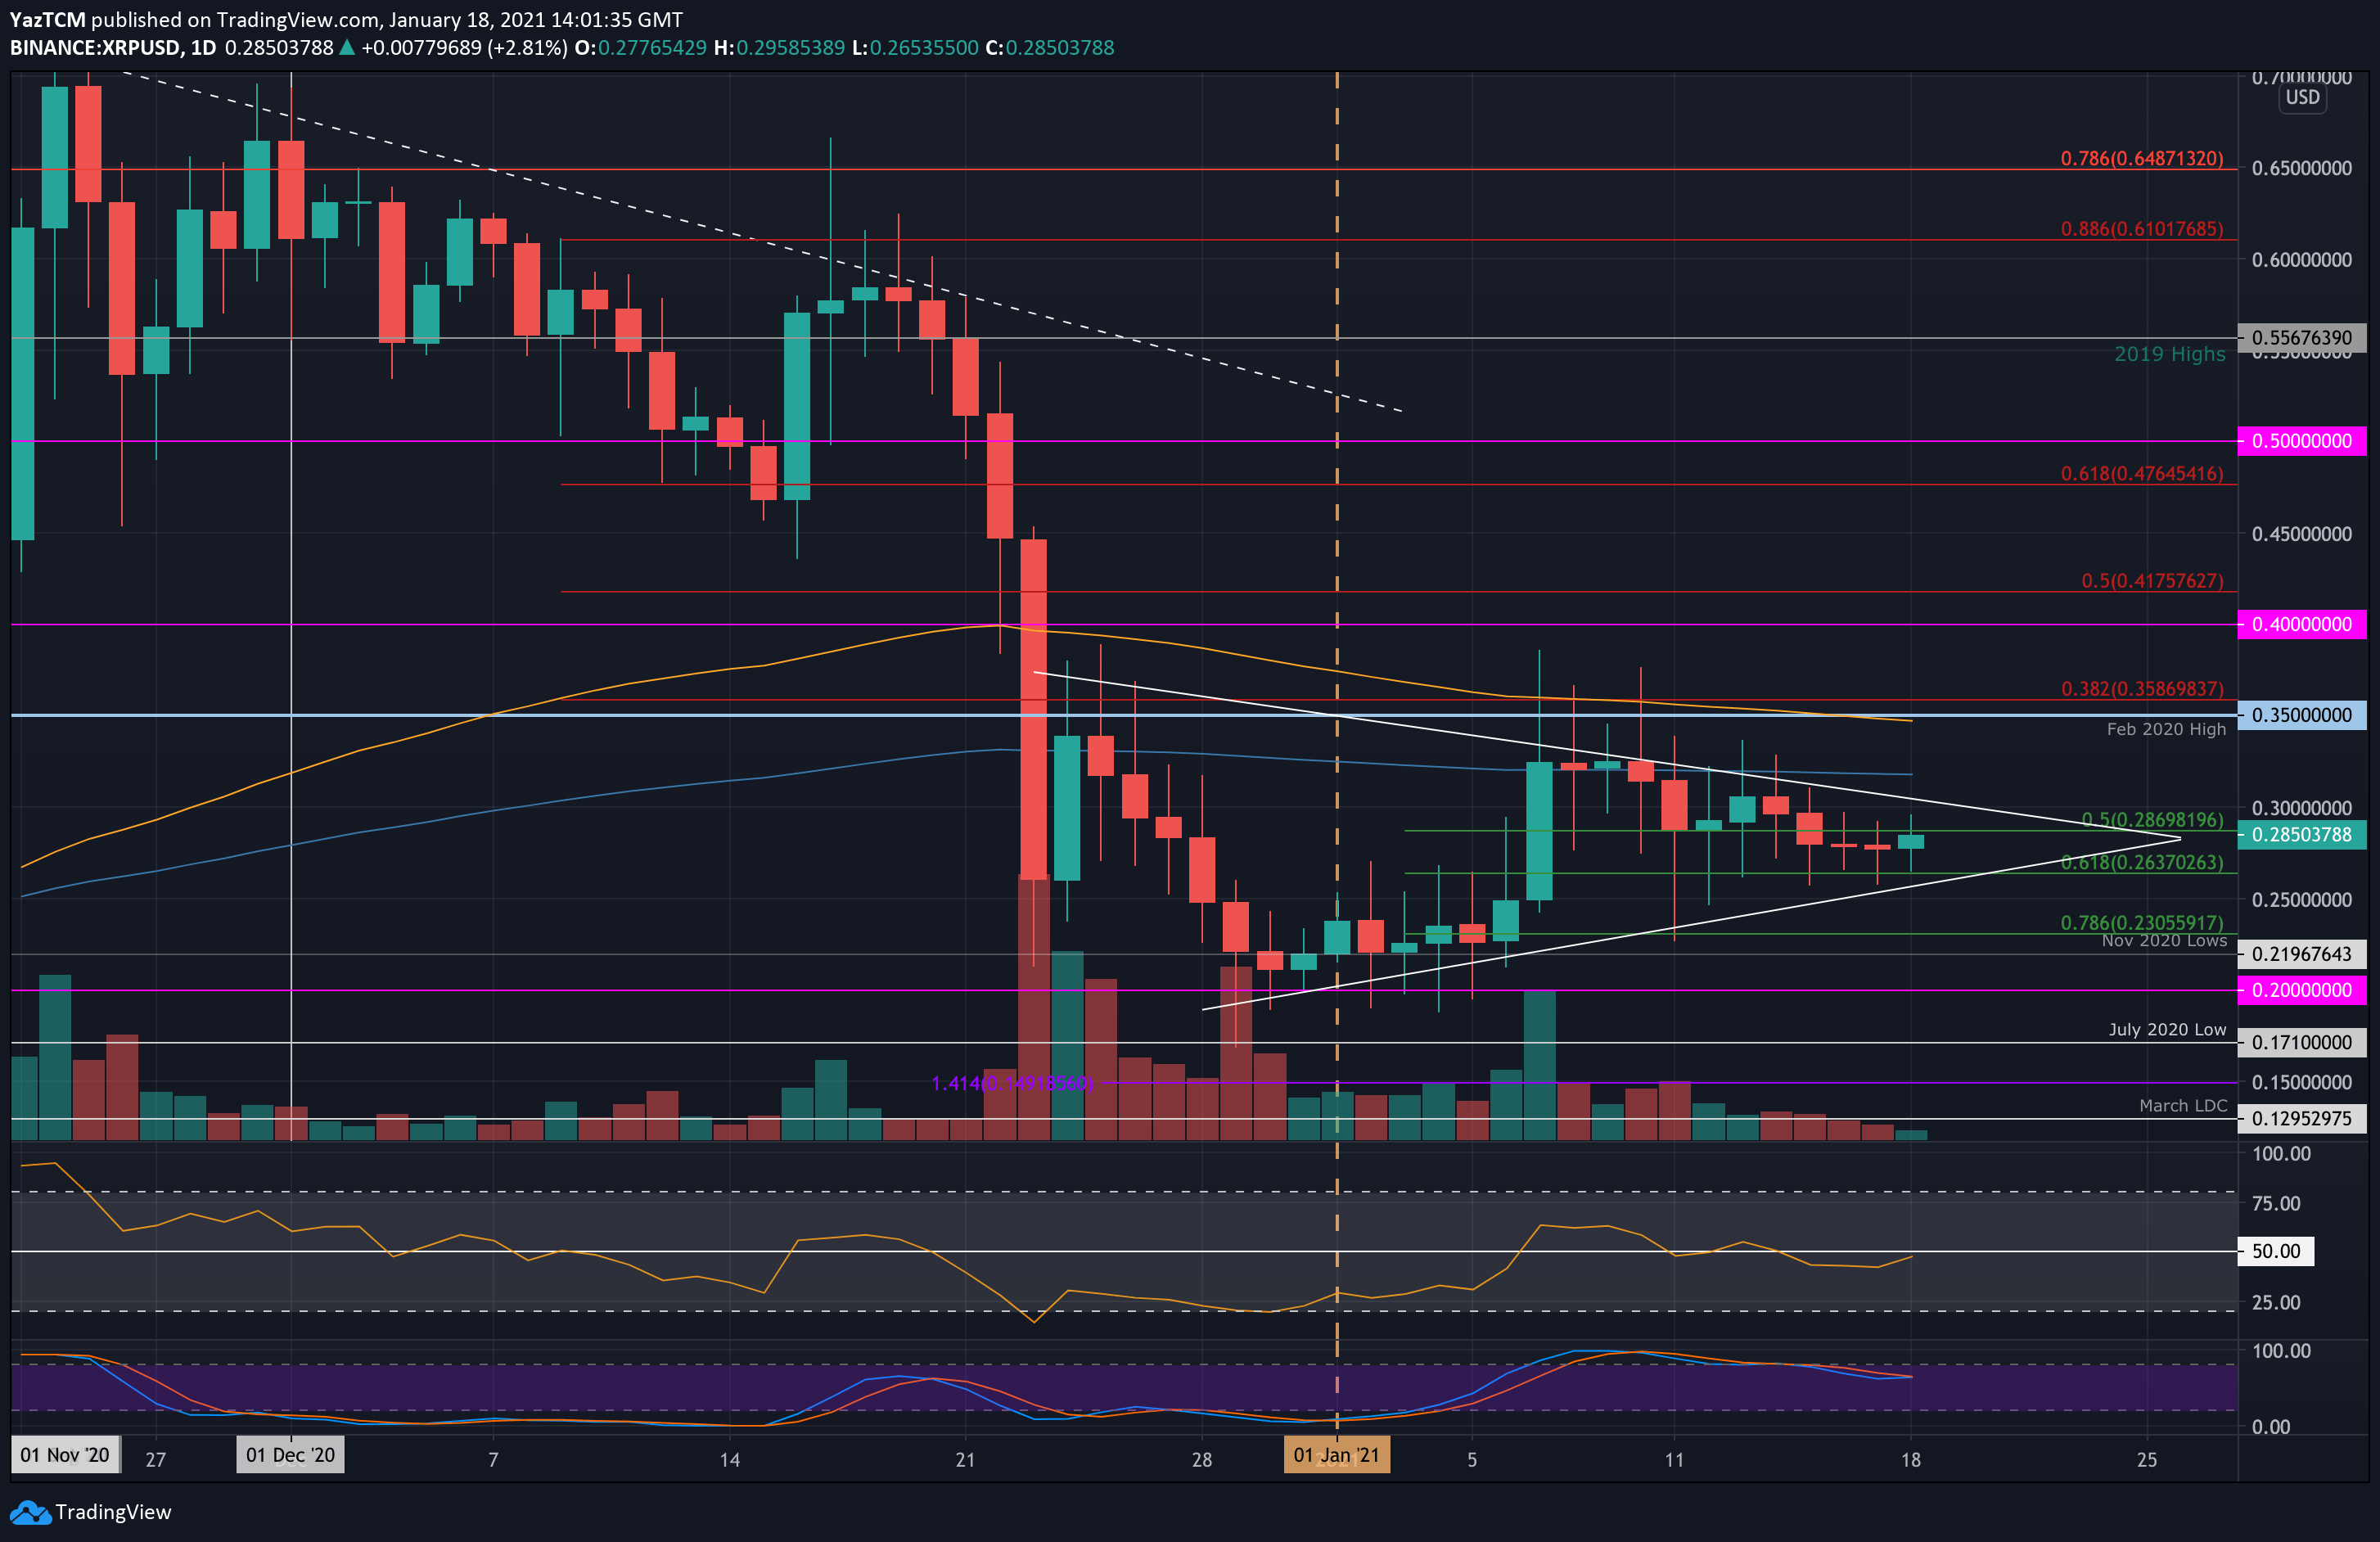
XRP-USD Short Term Price Prediction
Looking ahead, the first level of resistance lies at $0.3 (upper boundary of the triangle). This is followed by $0.32 (200-days EMA), $0.35 (Feb 2020 high & 100-days EMA), and $0.358 (bearish .382 Fib).
On the other side, the first level of support lies at $0.263 (.618 Fib & lower boundary of the triangle). This is followed by $0.25, $0.23 (.786 Fib), and $0.22 (Nov 2020 lows).
The RSI is attempting to break back above the midline, indicating the bulls are trying to gain control of the momentum.
XRP/BTC – Market Indecisive During January 2021.
Key Support Levels: 670 SAT SAT, 590 SAT, 500 SAT.
Key Resistance Levels: 900 SAT, 1015 SAT, 1200 SAT.
Against Bitcoin, XRP has been extremely indecisive during January 2021 as it has been trapped within a range between 900 SAT and 670 SAT for the entire period.
The market will need to penetrate beyond one of these borders to dictate the next direction for XRP.
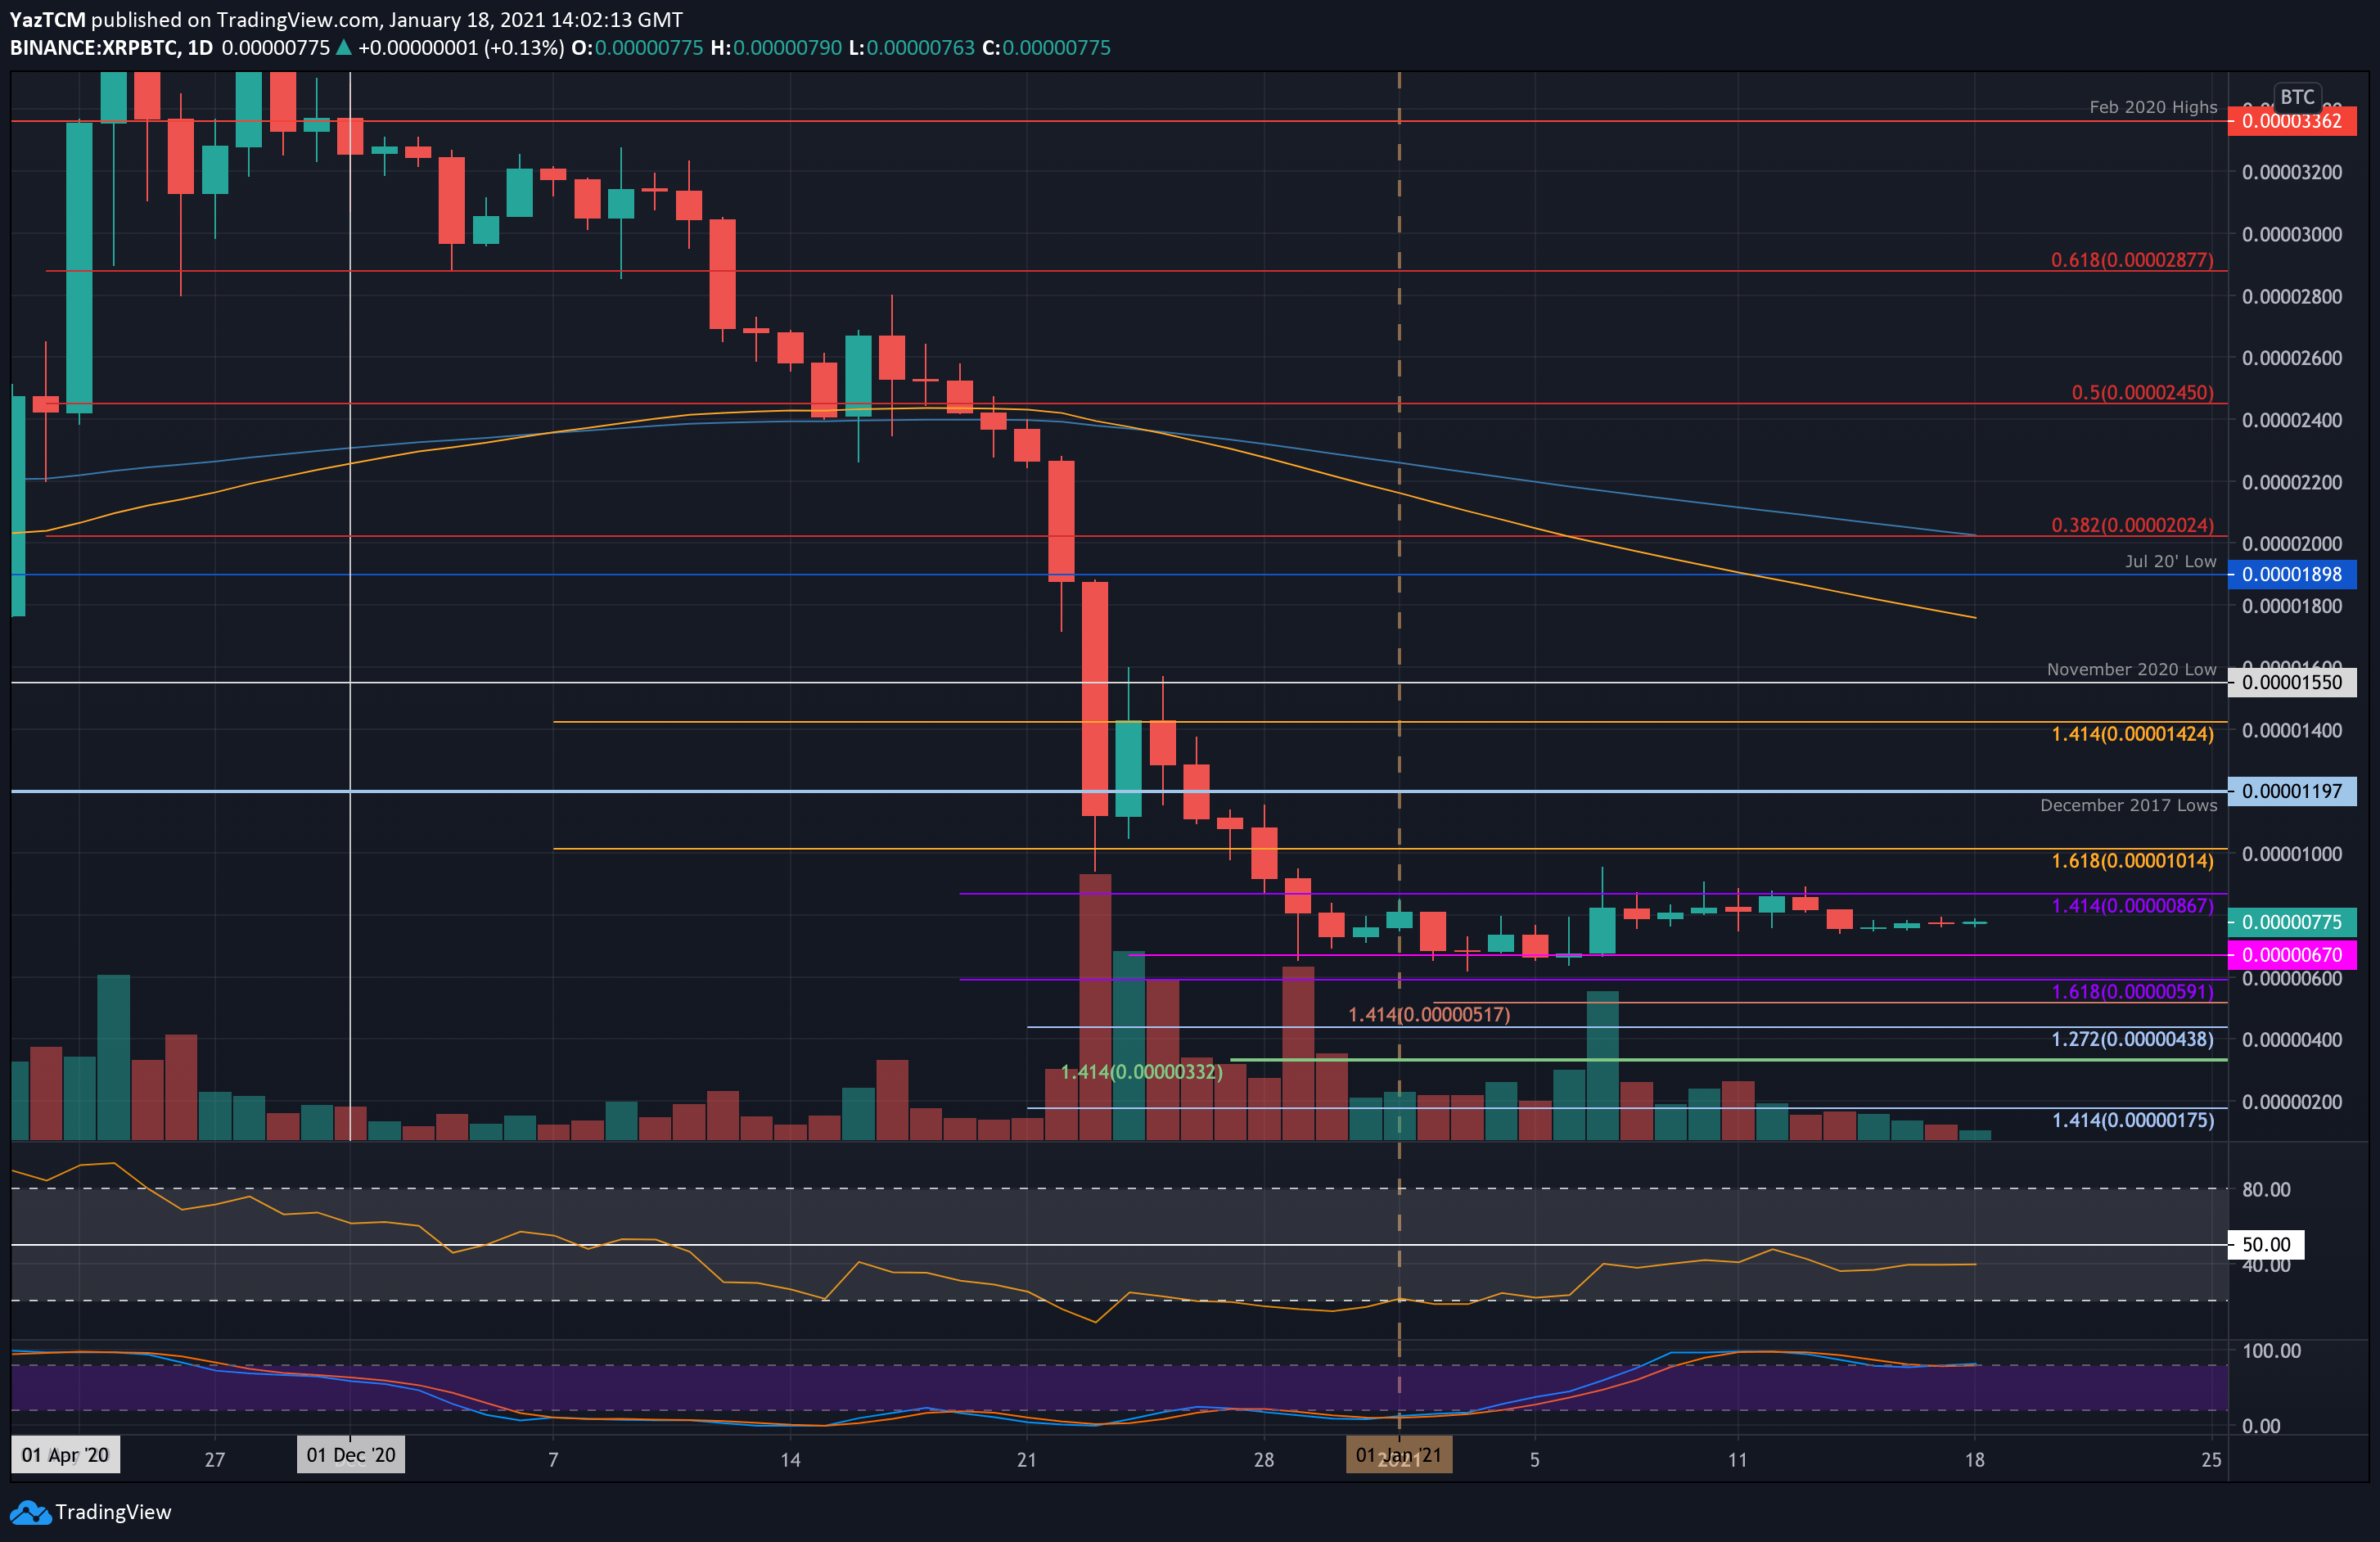
XRP-BTC Short Term Price Prediction
Moving forward, the first level of resistance lies at 900 SAT. This is followed by 1015 SAT, 1200 SAT (December 2017 lows), and 1500 SAT (November 2020 lows).
On the other side, the first level of support lies at 670 SAT. This is followed by 590 SAT, 520 SAT, 500 SAT, and 440 SAT.
The RSI still remains beneath the midline, indicating that the bears weakly control the momentum. For a push above the range, the RSI must break beyond the midline so the buyers can take control of the momentum.