XRP/USD – XRP Trading At Highs Seen Only At 2017 Bubble Top Key Support Levels: .35, .25, .13. Key Resistance Levels: .51, .61, .70. XRP has been on an absolute rampage over the past week as it managed to surge by a huge 150% over the period. The cryptocurrency finally broke the milestone level on Tuesday and exploded since then, as it currently trades above .4. Earlier today, the buyers continued to drive XRP higher as they reached .51 (1.618 Fib Extension). This is the highest level XRP was trading at since January 2018. Moreover, XRP was trading above .5 for less than 30 days between December 29, 2017, and January 23, 2018. XRP/USD Daily Chart. Source: TradingViewXRP-USD Short Term Price Prediction Looking ahead, the first resistance lies at current
Topics:
Yaz Sheikh considers the following as important: Ripple (XRP) Price, XRP Analysis, xrpbtc, xrpusd
This could be interesting, too:
Jordan Lyanchev writes Ripple’s (XRP) Surge to Triggers Over Million in Short Liquidations
Jordan Lyanchev writes Trump Confirms Work on Strategic Crypto Reserve: XRP, ADA, SOL Included
Dimitar Dzhondzhorov writes Is a Major Ripple v. SEC Lawsuit Development Expected This Week? Here’s Why
Mandy Williams writes Ripple Releases Institutional DeFi Roadmap for XRP Ledger in 2025
XRP/USD – XRP Trading At Highs Seen Only At 2017 Bubble Top
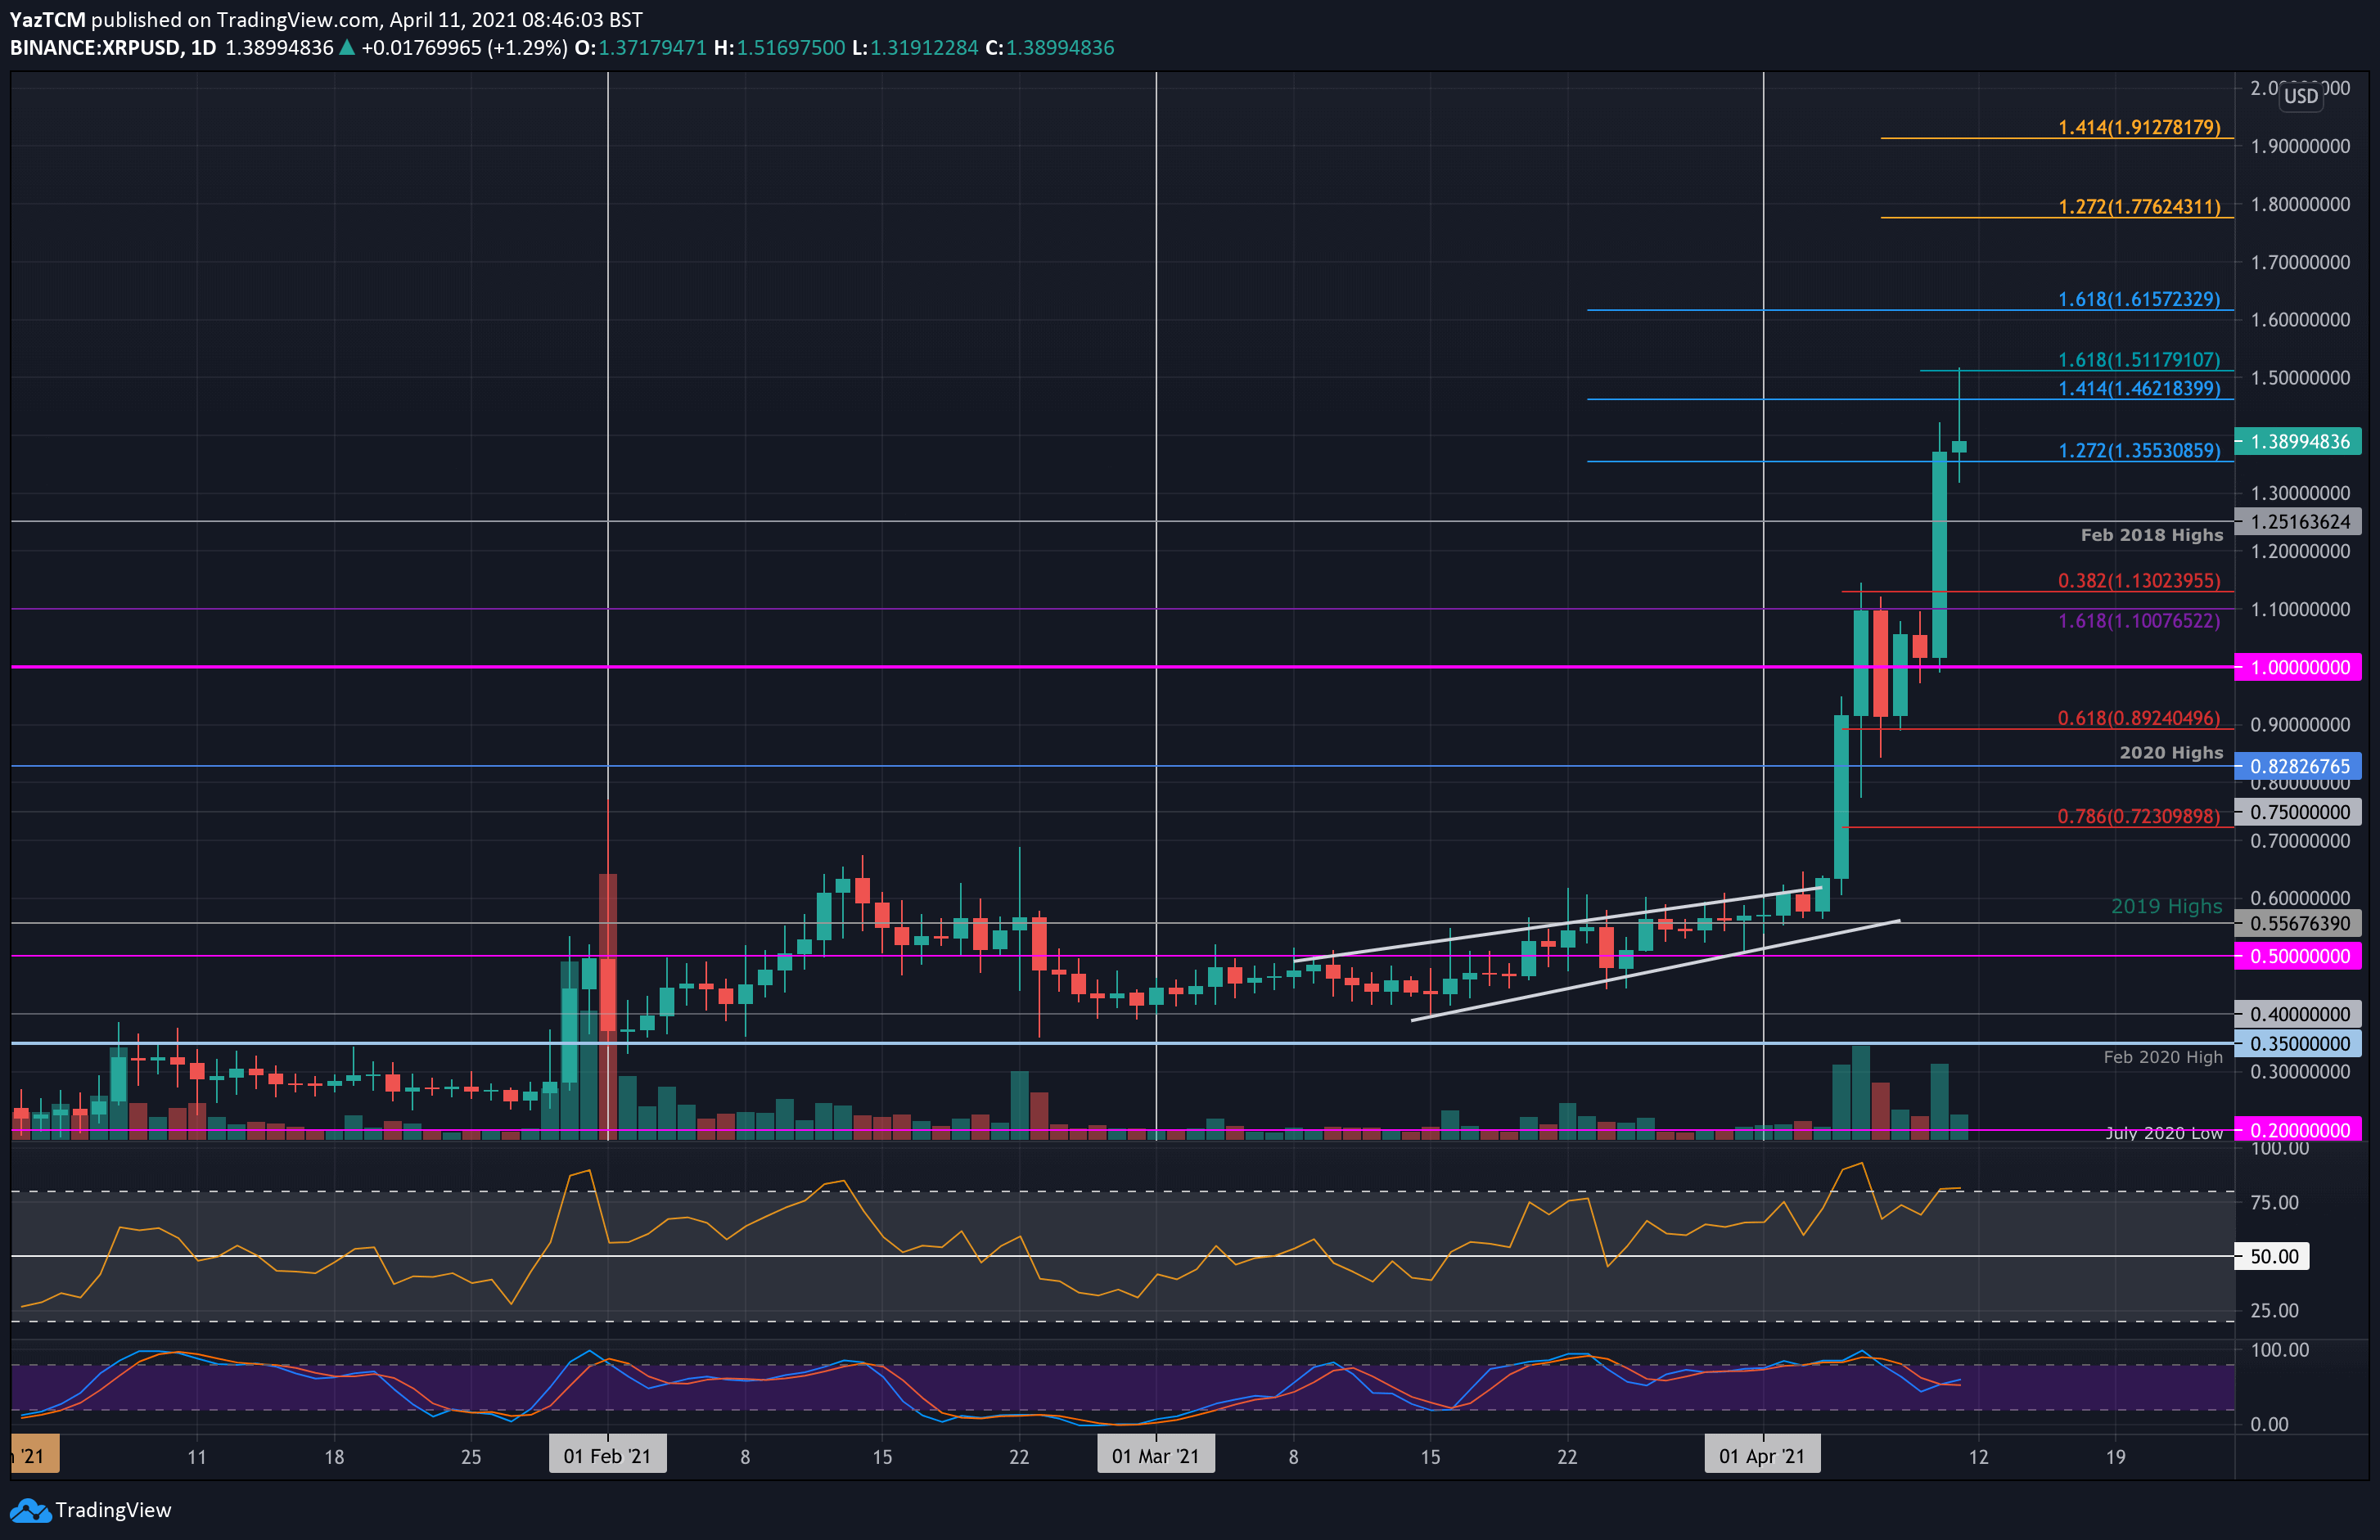
Key Support Levels: $1.35, $1.25, $1.13.
Key Resistance Levels: $1.51, $1.61, $1.70.
XRP has been on an absolute rampage over the past week as it managed to surge by a huge 150% over the period. The cryptocurrency finally broke the $1 milestone level on Tuesday and exploded since then, as it currently trades above $1.4.
Earlier today, the buyers continued to drive XRP higher as they reached $1.51 (1.618 Fib Extension). This is the highest level XRP was trading at since January 2018. Moreover, XRP was trading above $1.5 for less than 30 days between December 29, 2017, and January 23, 2018.
XRP-USD Short Term Price Prediction
Looking ahead, the first resistance lies at current level of $1.45 – $1.51 (short term 1.618 Fib Extension and January 2018 resistance). This is followed by $1.61 (1.618 Fib Extension and previous resistance), $1.70, $1.77 (1.272 Fib Extension – orange), $1.91 (1.414 Fib Extension – orange), and $2.00.
On the other side, the first support lies at $1.35. This is followed by $1.25 (Feb 2018 highs), $1.13 (.382 Fib), $1.10, and $1.00.
The RSI is in overbought conditions, and there are hints of bearish divergence showing in the market. Nevertheless, the bulls are in complete control of the market momentum at this moment in time.
XRP/BTC: Still Far Away From January 2018 ATH
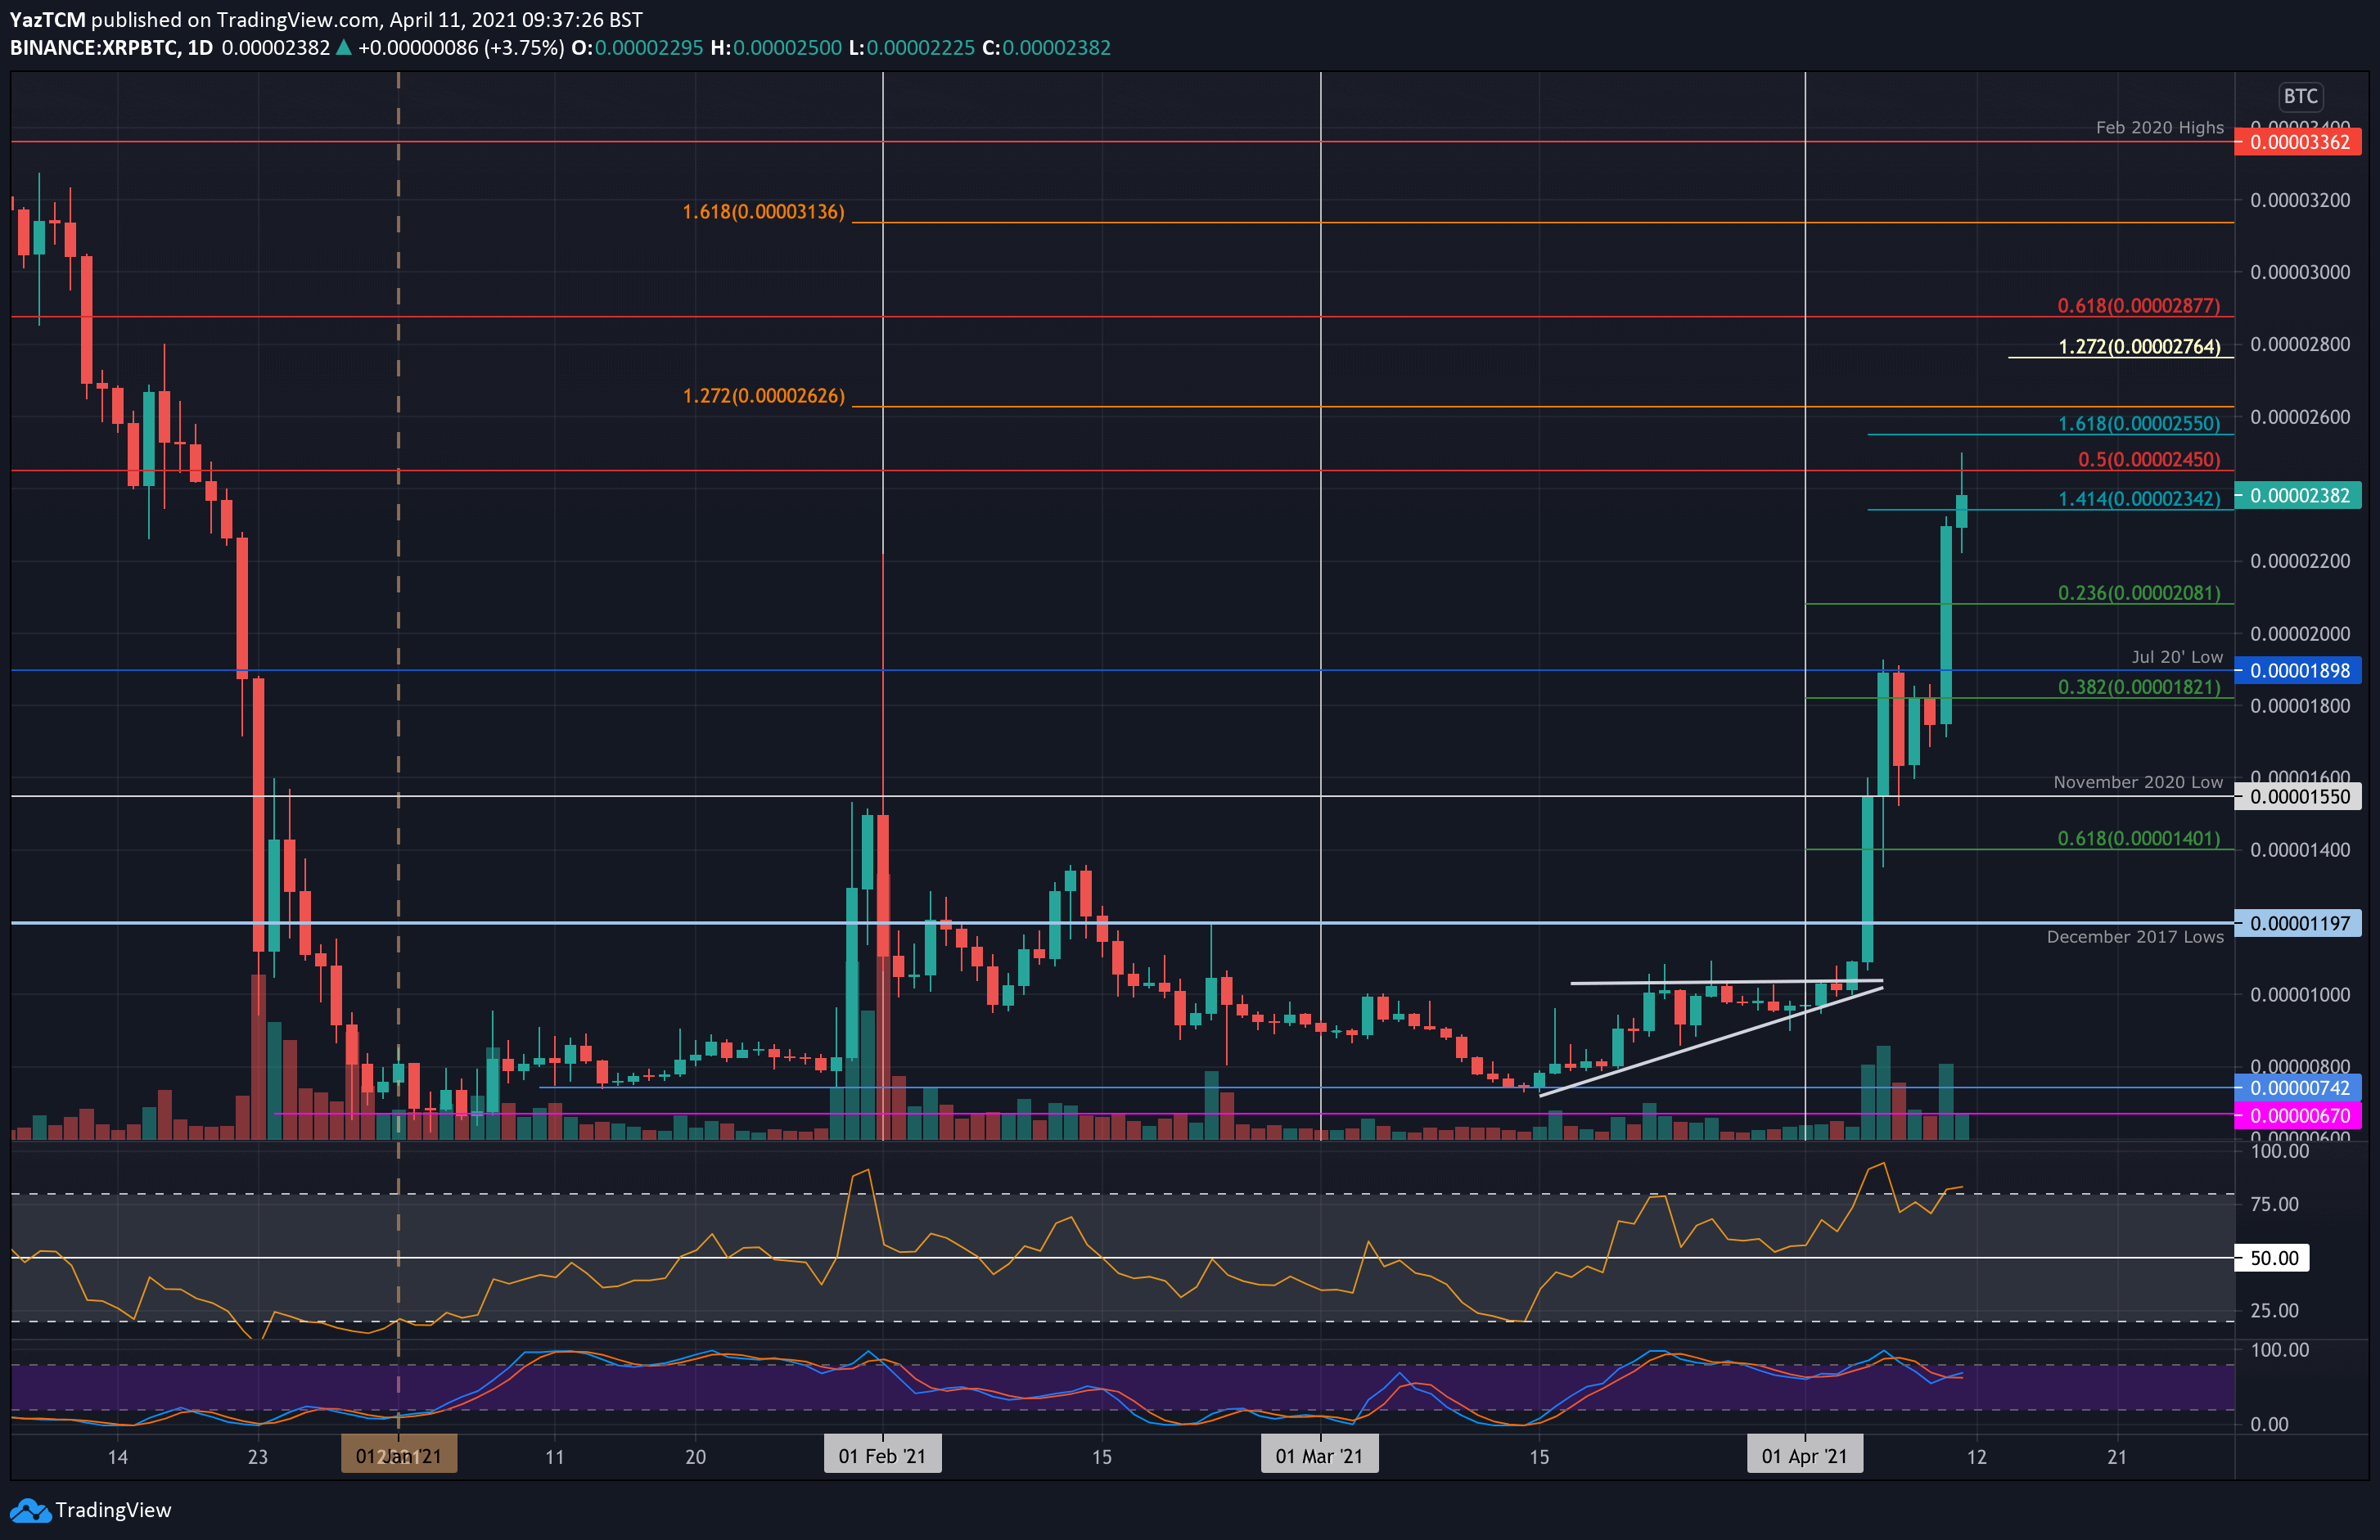
Key Support Levels: 2200 SAT, 2080 SAT, 2000 SAT.
Key Resistance Levels: 2450 SAT, 2550 SAT, 2625 SAT.
XRP is also performing very well against Bitcoin but has still not overcome the December 2020 highs at 3340 SAT just yet, not mentioning the parabolic run and the ATH against Bitcoin which was recorded in January 2018. The cryptocurrency pushed above 1550 SAT (November 2020 lows) on Tuesday as it reached the resistance at 1900 SAT (July 2020 lows).
The bulls could not overcome the 1900 SAT resistance until yesterday when XRP surged higher to break beyond 2000 SAT and reach as high as 2340 SAT (1.414 Fib Extension). Today, the bulls pushed further beyond this resistance to reach as high as 2500 SAT. It has since dropped slightly as it now trades at 2380 SAT.
XRP-BTC Short Term Price Prediction
Looking ahead, the first resistance lies at 2450 SAT (bearish .5 Fib). This is followed by 2550 SAT (1.618 Fib Extension), 2625 SAT, 2765 SAT (short term 1.272 Fib Extension), and 2877 SAT (bearish .618 Fib).
On the other side, the first support lies at 2200 SAT. This is followed by 2080 SAT (.236 Fib), 2000 SAt, 1900 SAT (July 2020 low), and 1820 SAT (.382 Fib).
Likewise, the RSI is in extremely overbought territory and is showing hints of bearish divergence as price makes a higher high, but the RSI fails to do so. This suggests the buyers might be a little overextended, and a retracement might be imminent after such a parabolic move.