XRP/USD – XRP Breaks August Highs Key Support Levels: .36, .25, .20.Key Resistance Levels: .40, .50, .54. XRP has finally broken the August high at .36 today after spiking as high as .40. The coin reached .36 (1.618 Fib Extension) during mid-August and started to trend lower from there inside a symmetrical triangle. The triangle was finally broken at the start of September as XRP started to surge inside an ascending price channel. XRP found support at .25 (Feb 2018 high) over the weekend and rebounded from there yesterday to break .30. It continued higher today to break the August high. XRP/USD Daily Chart. Source: TradingView.XRP-USD Short Term Price Prediction Looking ahead, the first resistance lies at .40. This is followed by .50 (bearish .786
Topics:
Yaz Sheikh considers the following as important: Ripple (XRP) Price, XRP Analysis, xrpbtc, xrpusd
This could be interesting, too:
Jordan Lyanchev writes Ripple’s (XRP) Surge to Triggers Over Million in Short Liquidations
Jordan Lyanchev writes Trump Confirms Work on Strategic Crypto Reserve: XRP, ADA, SOL Included
Dimitar Dzhondzhorov writes Is a Major Ripple v. SEC Lawsuit Development Expected This Week? Here’s Why
Mandy Williams writes Ripple Releases Institutional DeFi Roadmap for XRP Ledger in 2025
XRP/USD – XRP Breaks August Highs
Key Support Levels: $1.36, $1.25, $1.20.
Key Resistance Levels: $1.40, $1.50, $1.54.
XRP has finally broken the August high at $1.36 today after spiking as high as $1.40. The coin reached $1.36 (1.618 Fib Extension) during mid-August and started to trend lower from there inside a symmetrical triangle.
The triangle was finally broken at the start of September as XRP started to surge inside an ascending price channel. XRP found support at $1.25 (Feb 2018 high) over the weekend and rebounded from there yesterday to break $1.30. It continued higher today to break the August high.
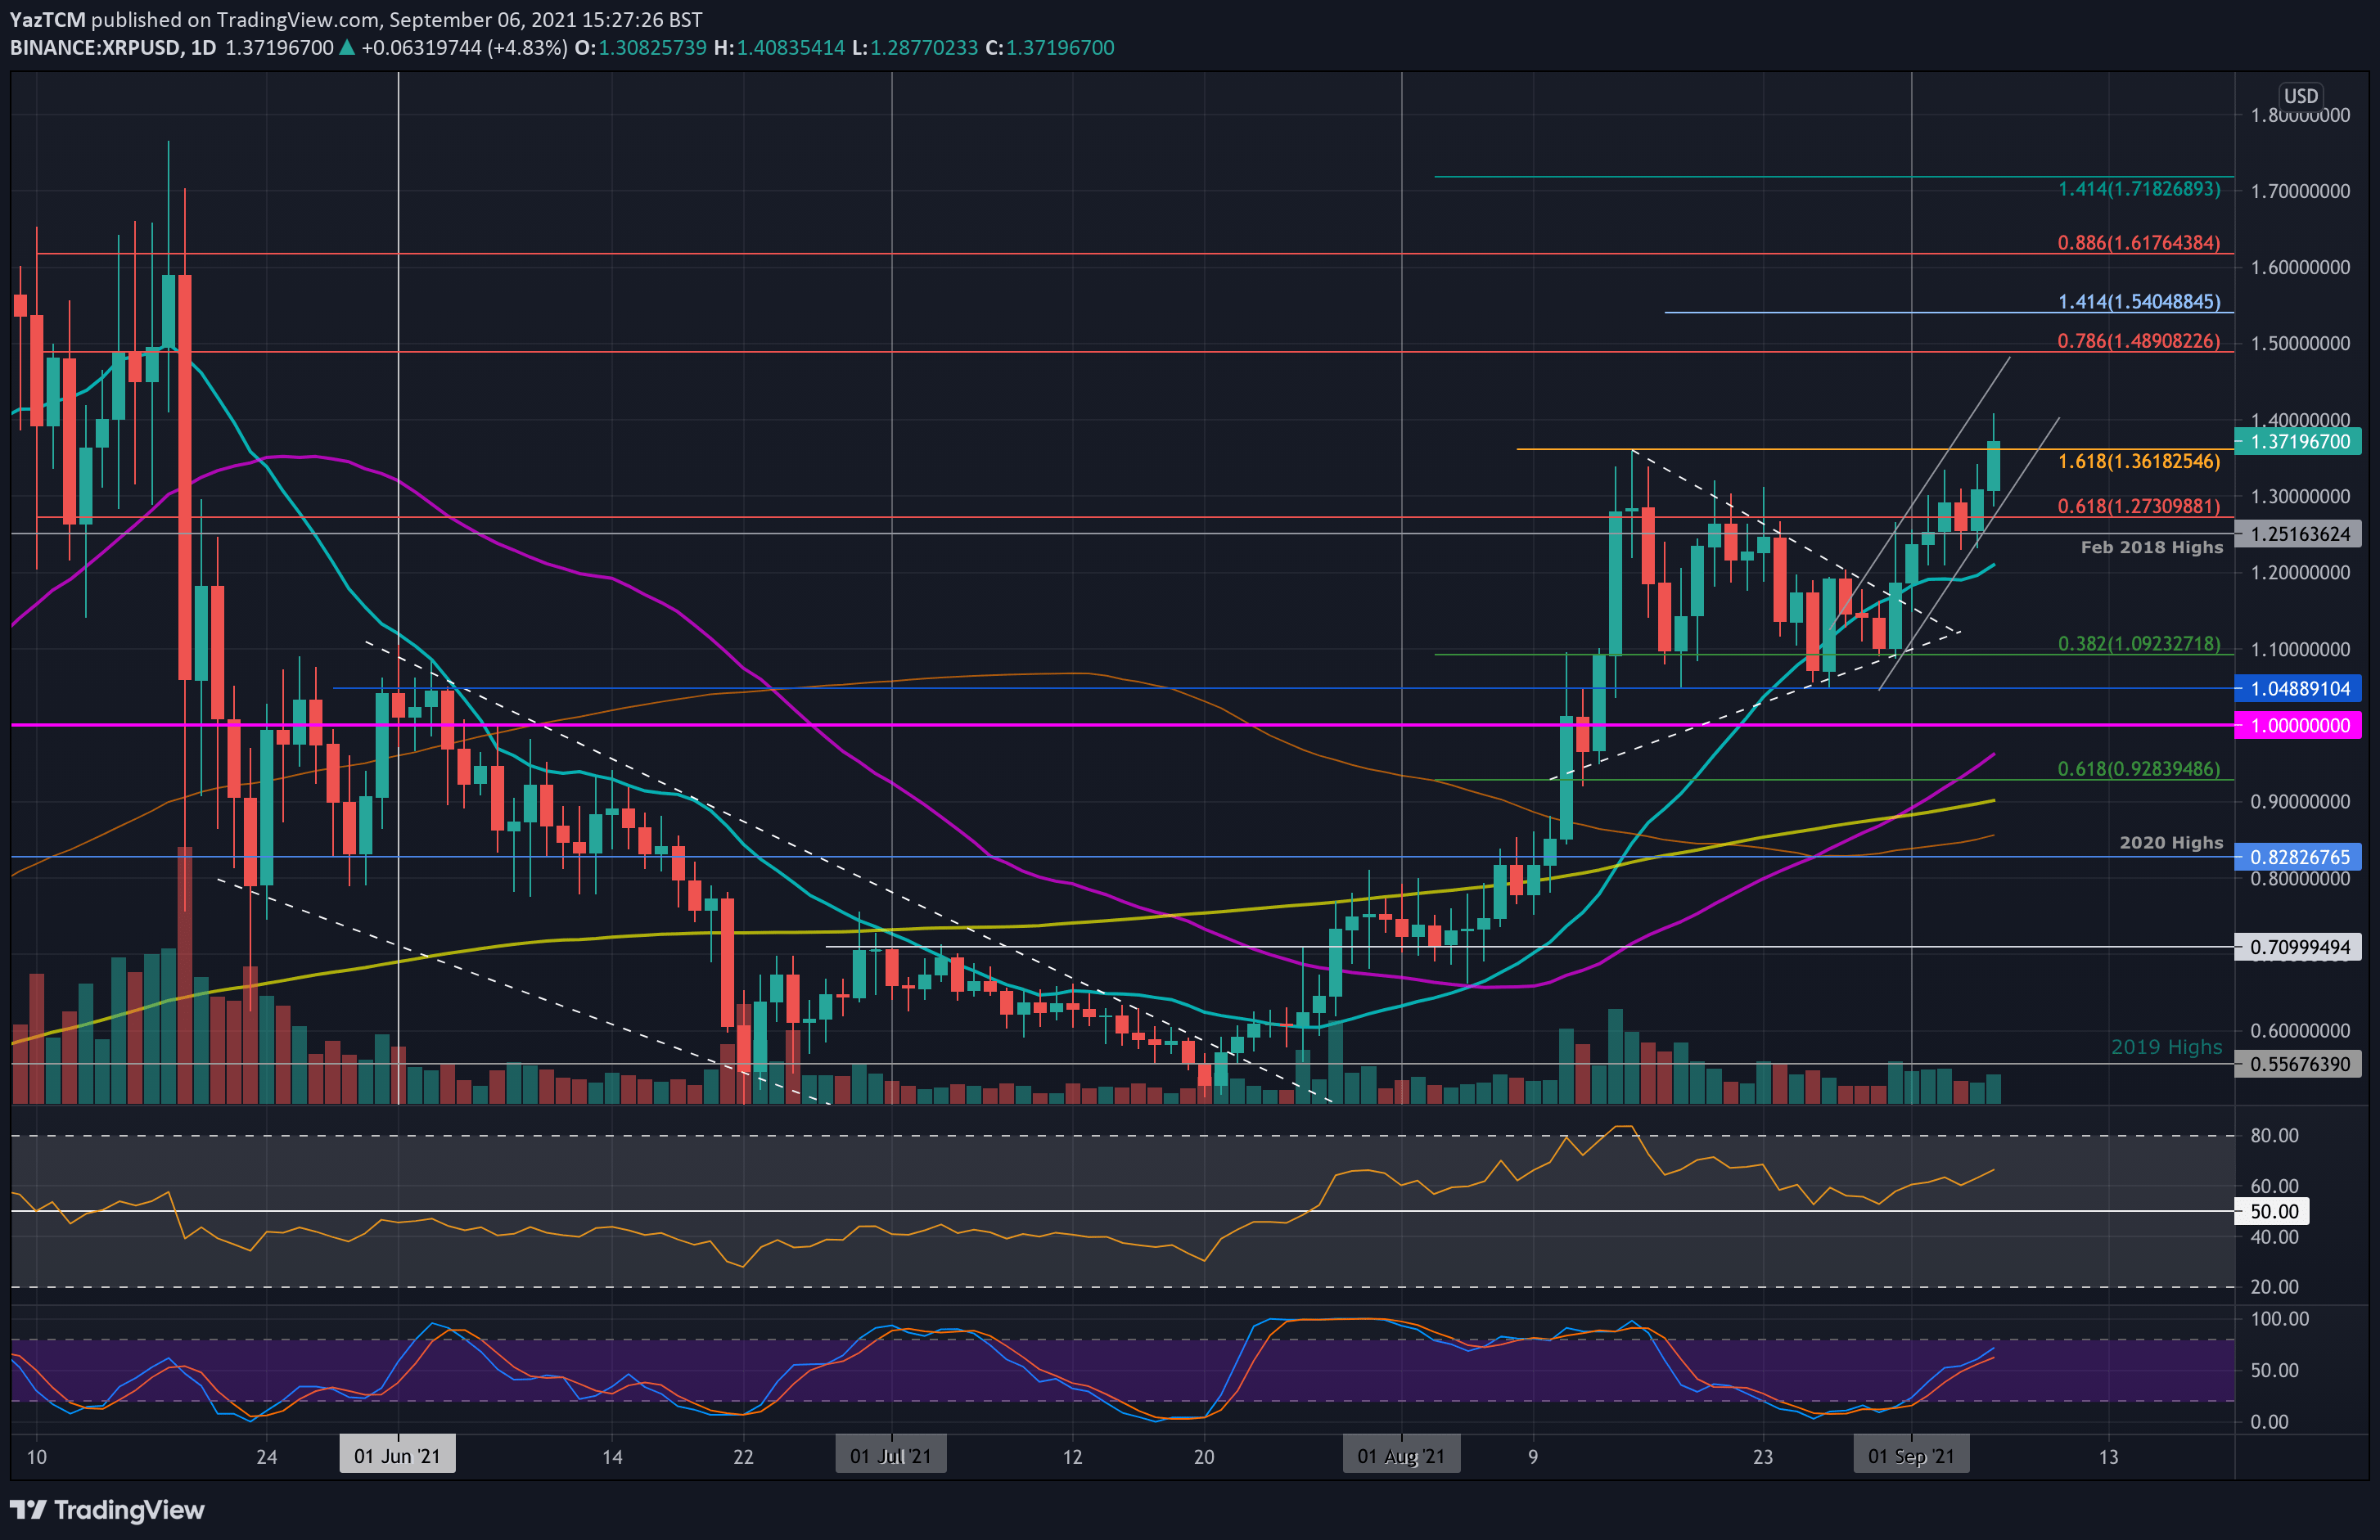
XRP-USD Short Term Price Prediction
Looking ahead, the first resistance lies at $1.40. This is followed by $1.50 (bearish .786 Fib), $1.54 (1.414 Fib Extension), $1.62 (bearish .886 Fib), and $1.72 (1.414 Fib Extension).
On the other side, the first support lies at $1.36. This is followed by $1.25, $1.20 (20-day MA), $1.10 (.382 Fib), and $1.00.
The RSI is starting to head higher again, indicating increasing bullish momentum.
XRP/BTC – XRP Breaks September 2600 SAT Resistance
Key Support Levels: 2600 SAT, 2455 SAT, 2400 SAT.
Key Resistance Levels: 2670 SAT, 2730 SAT, 2915 SAT.
Against BTC, XRP broke the September resistance at 2600 SAT today as it reached as high as 2670 SAT. The coin moved above a descending wedge formation at the end of August and it surged higher to reclaim ground above the 20-day MA.
In the first week of September, XRP struggled to break 2600 SAT. Today’s price hike finally pushed XRP above the resistance as it makes a new high for the month.
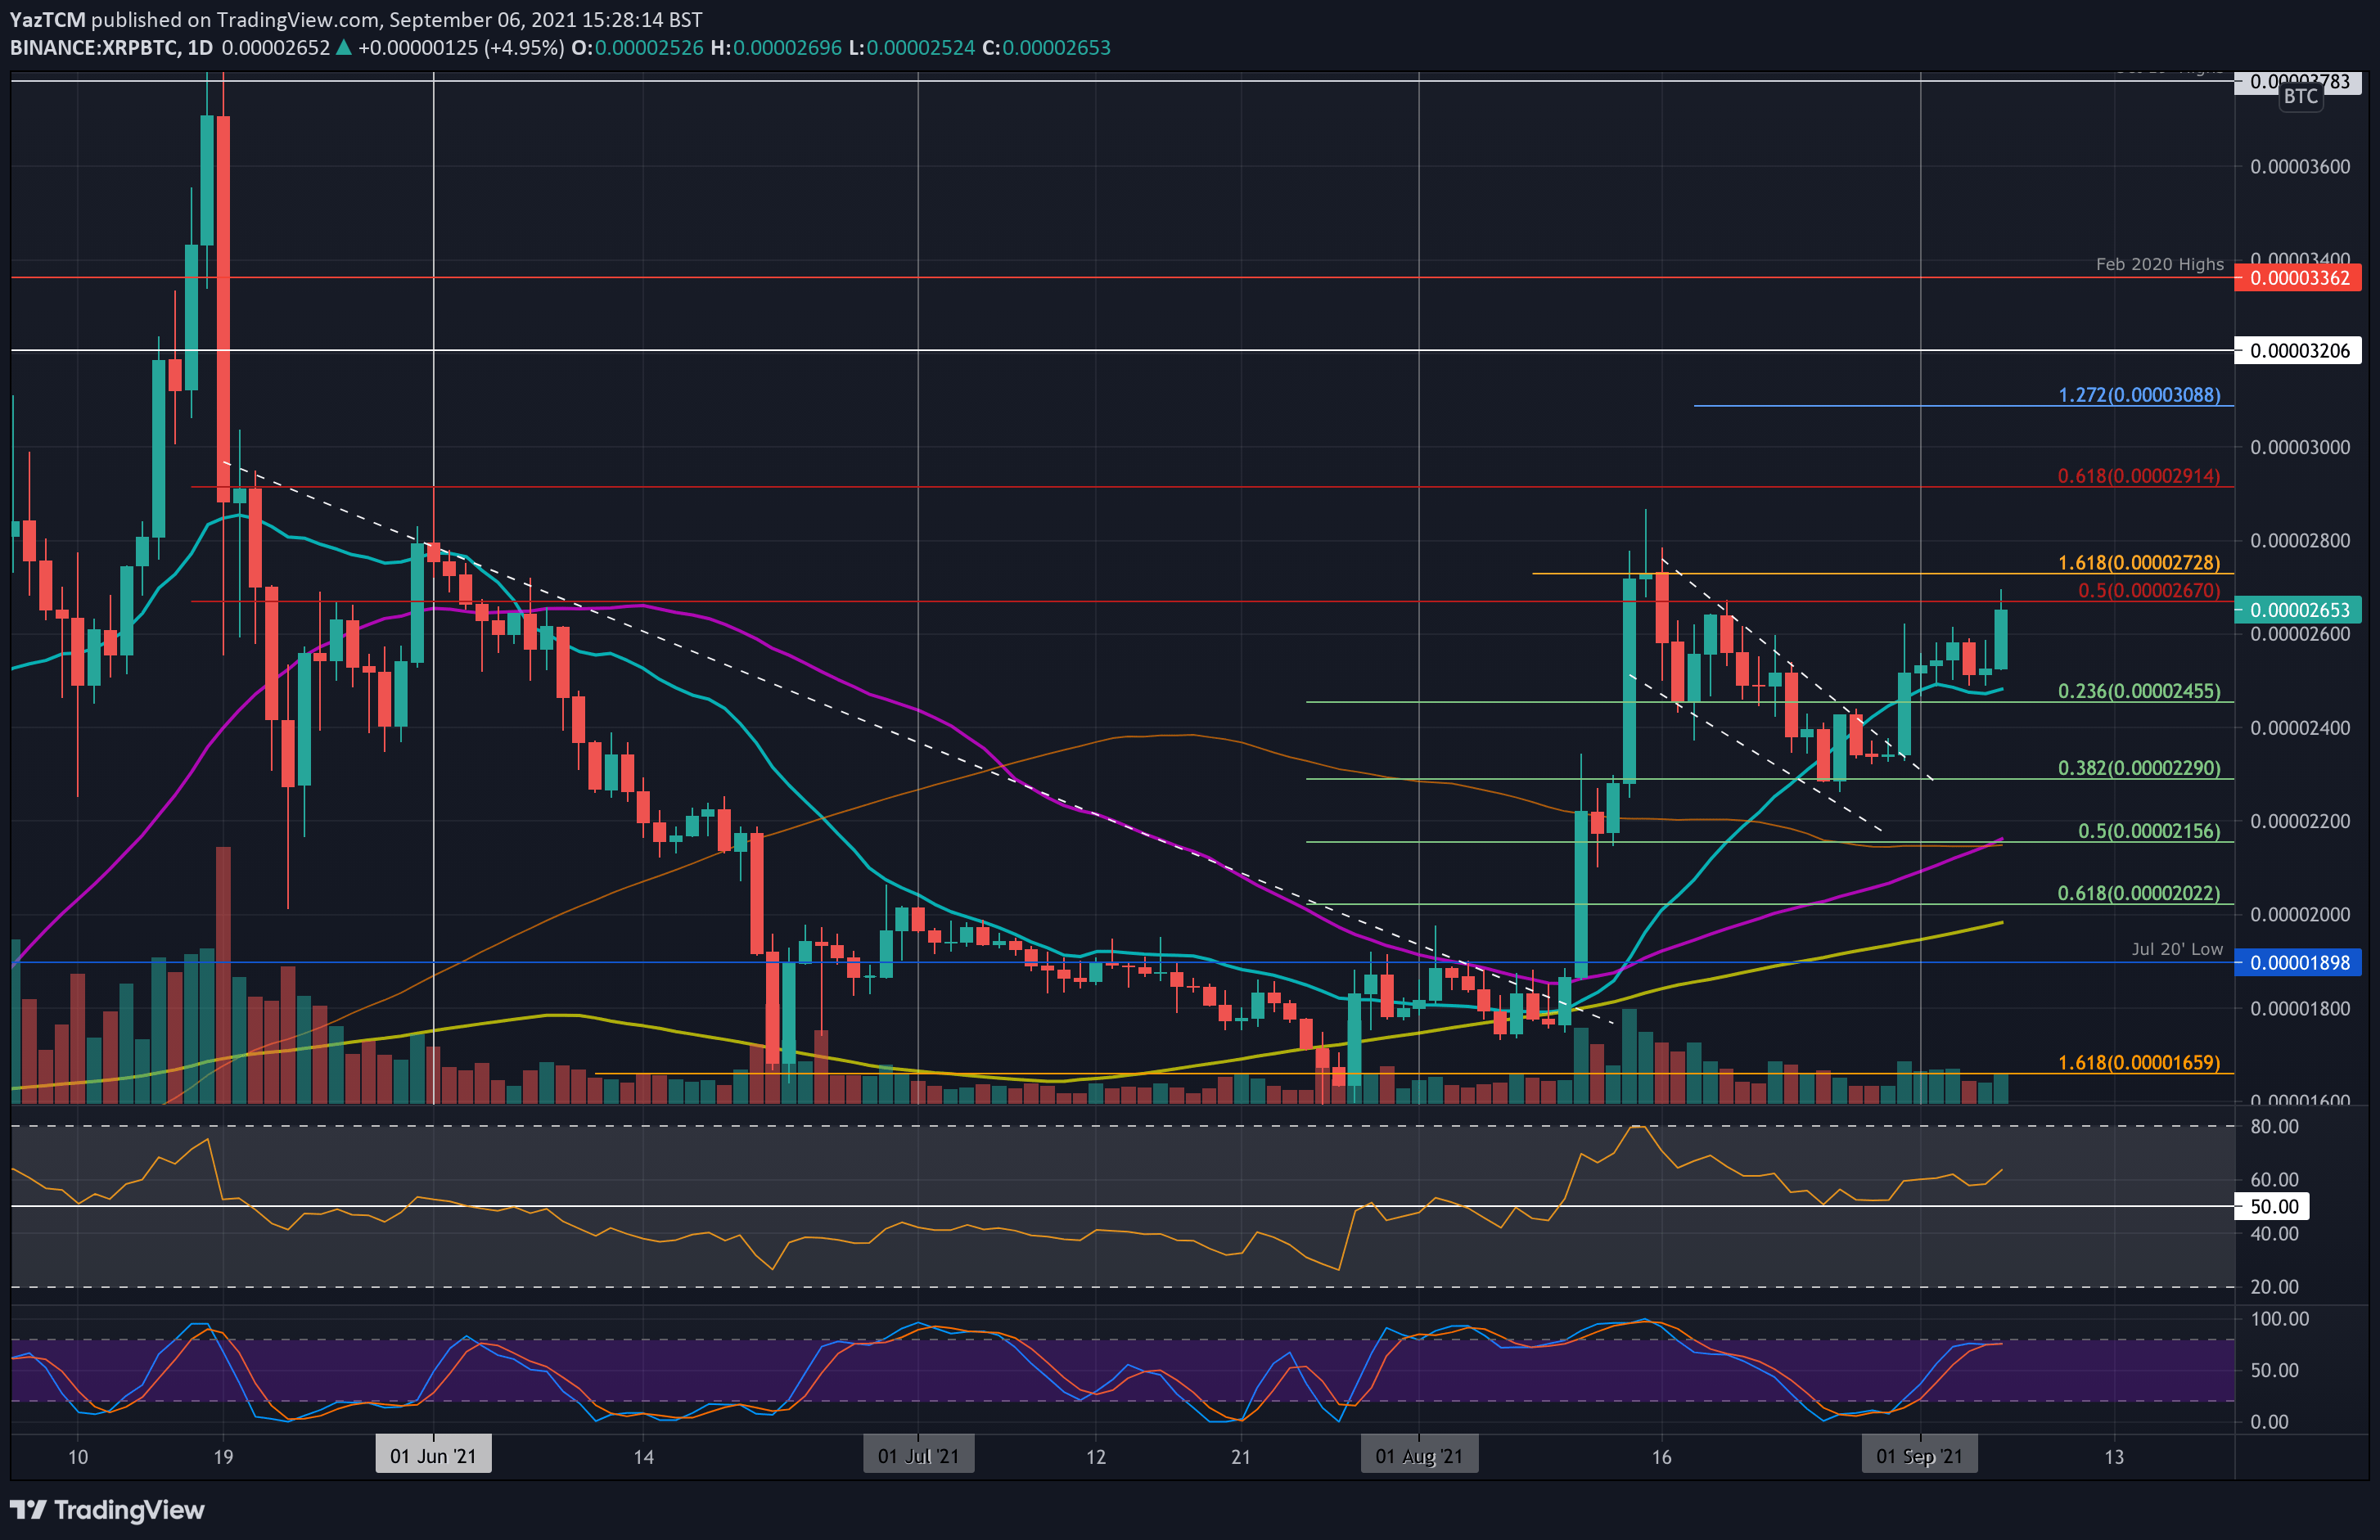
XRP-BTC Short Term Price Prediction
Looking ahead, the first resistance lies at 2670 SAT (bearish .786 Fib). This is followed by 2730 SAT (1.618 Fib Extension), 2915 SAT (bearish .618 Fib), and 3000 SAT.
On the other side, the first support lies at 2600 SAT. This is followed by 2455 SAT (.236 Fib & 20-day MA), 2400 SAT, 2290 SAT (.382 Fib), and 2155 SAT (.5 Fib & 100-day MA).
Again, the RSI is rising, which also indicates increasing momentum.