XRP/USD – XRP Remains Inside June Falling Price Channel. Key Support Levels: %excerpt%.6, %excerpt%.556, %excerpt%.5.Key Resistance Levels: %excerpt%.7, %excerpt%.72, %excerpt%.781. XRP is down 5% this week as it struggles to break the 20-day MA near %excerpt%.7. It is also trading inside a falling price channel that was established at the beginning of June. Each time XRP attempted to break the price channel, the upper boundary rejected it. The volume remains low for XRP, and an increase in the volume would be required to allow XRP to break the combined resistance at %excerpt%.7. It would need to break the falling price channel and push back above before turning bullish again. Nevertheless, the breakout of the channel should come within the next couple of days. Otherwise, XRP would break the short-term rising trend line and
Topics:
Yaz Sheikh considers the following as important: Ripple (XRP) Price, XRP Analysis, xrpbtc, xrpusd
This could be interesting, too:
Jordan Lyanchev writes Ripple’s (XRP) Surge to Triggers Over Million in Short Liquidations
Jordan Lyanchev writes Trump Confirms Work on Strategic Crypto Reserve: XRP, ADA, SOL Included
Dimitar Dzhondzhorov writes Is a Major Ripple v. SEC Lawsuit Development Expected This Week? Here’s Why
Mandy Williams writes Ripple Releases Institutional DeFi Roadmap for XRP Ledger in 2025
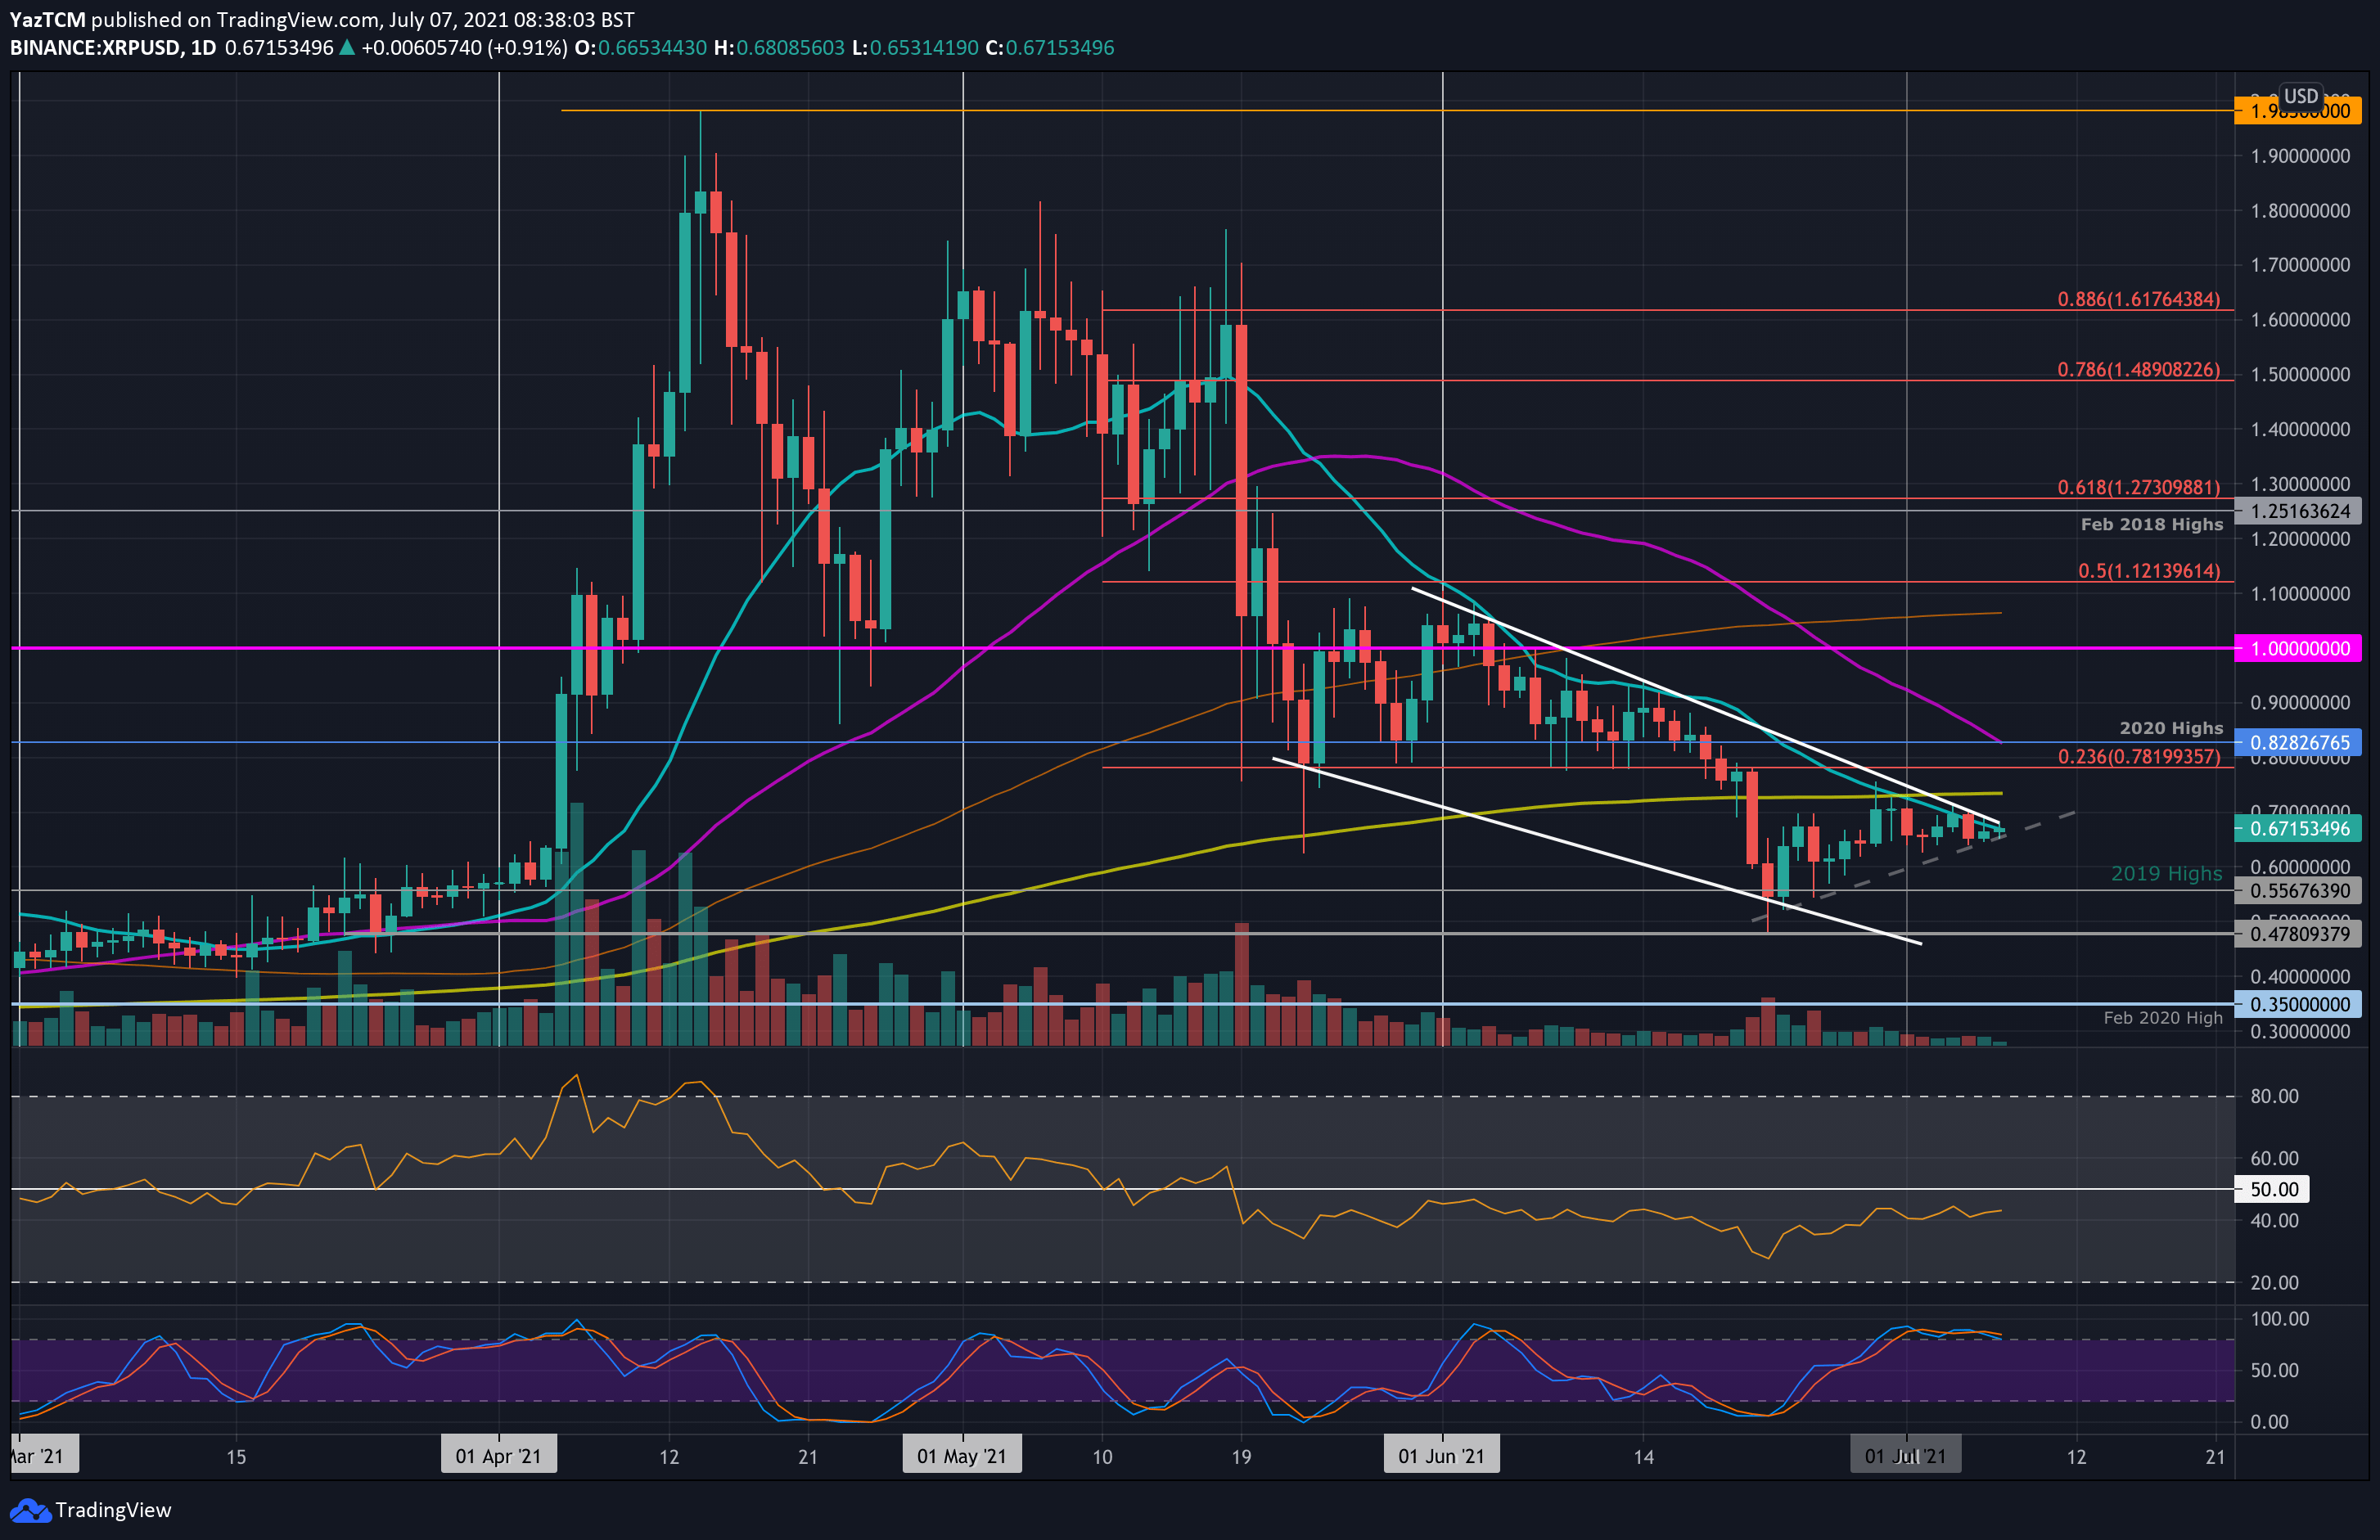
XRP/USD – XRP Remains Inside June Falling Price Channel.
Key Support Levels: $0.6, $0.556, $0.5.
Key Resistance Levels: $0.7, $0.72, $0.781.
XRP is down 5% this week as it struggles to break the 20-day MA near $0.7. It is also trading inside a falling price channel that was established at the beginning of June. Each time XRP attempted to break the price channel, the upper boundary rejected it.
The volume remains low for XRP, and an increase in the volume would be required to allow XRP to break the combined resistance at $0.7. It would need to break the falling price channel and push back above $1 before turning bullish again.
Nevertheless, the breakout of the channel should come within the next couple of days. Otherwise, XRP would break the short-term rising trend line and head back beneath $0.5.
XRP-USD Short Term Price Prediction
Looking ahead, if the bears break the rising trend line, the first support lies at $0.6. This is followed by $0.556 ( 2019 highs), $0.5, and $0.478 (lower channel angle).
On the other side, the first resistance lies at $0.7 (near 20-day MA). This is followed by $0.72 (200-day MA), $0.781 (bearish .236 Fib Retracement), and $0.8282 (2020 high & 50-day MA).
The RSI shows decreasing bearish momentum as it rests above 40, but the buyers are still failing to establish any momentum. Therefore, it would need to rise beyond 50 for a falling price channel breakout.
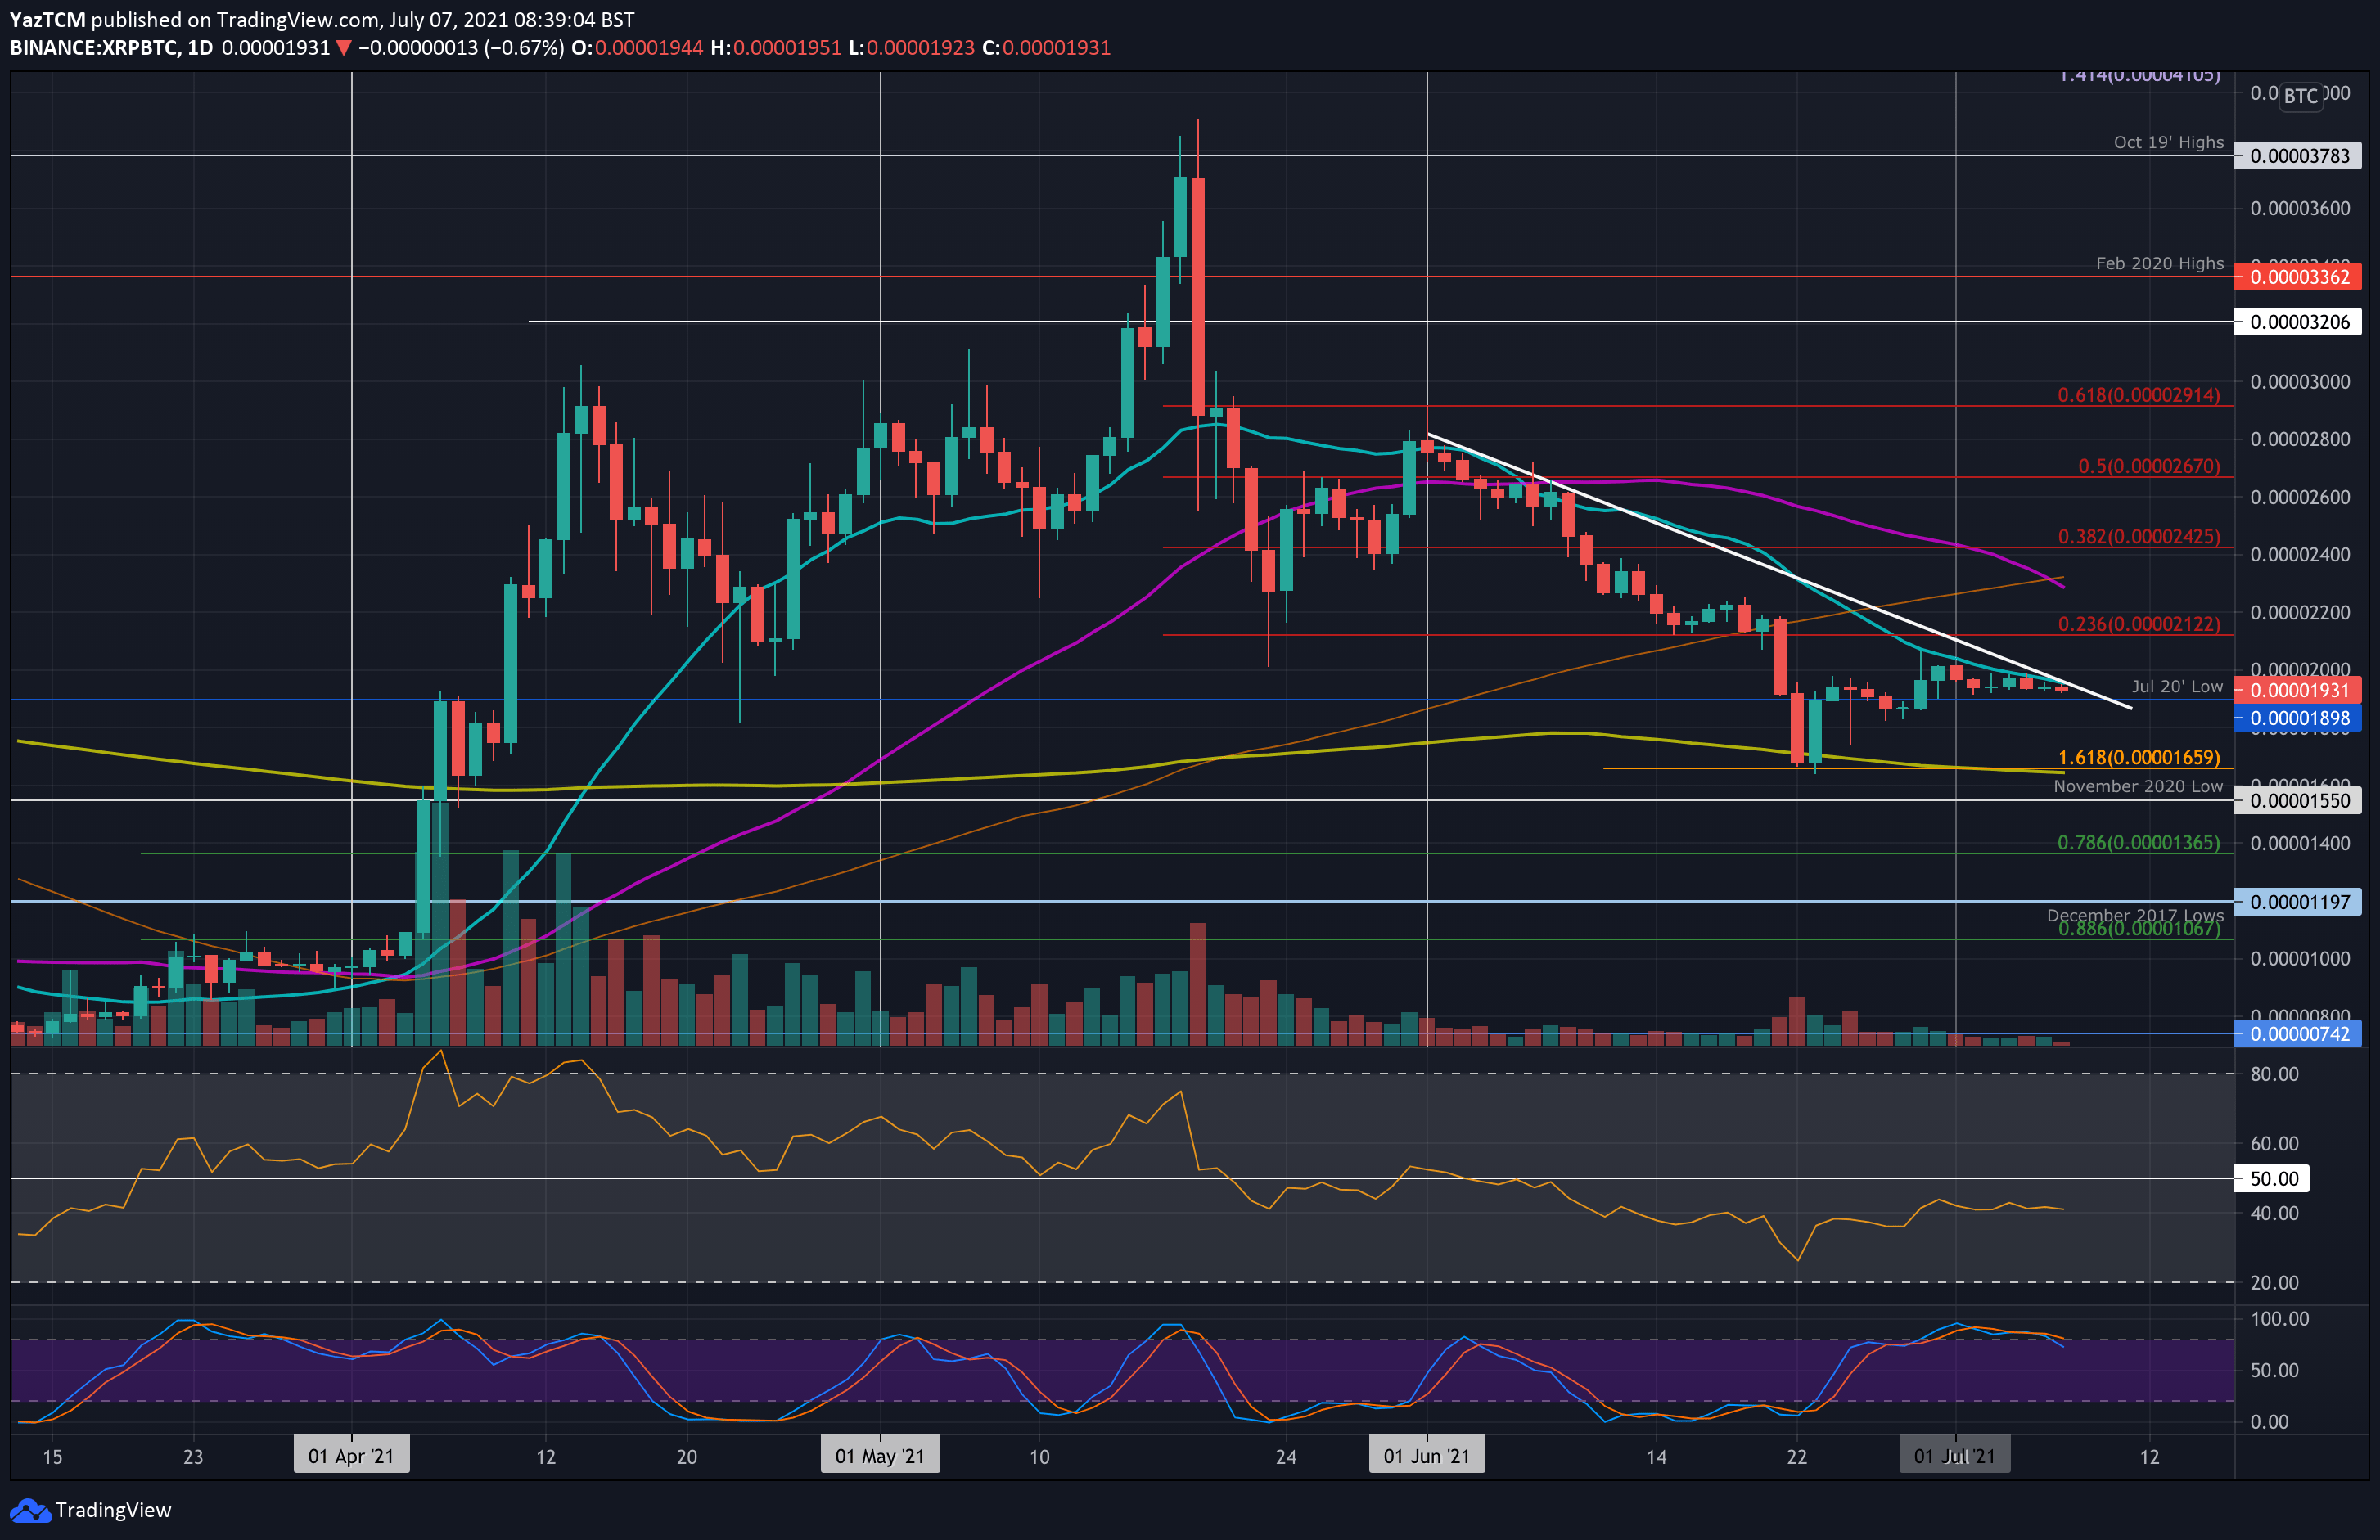
XRP/BTC – Bears Persist Beneath June Falling Trendline
Key Support Levels: 1900 SAT, 1800 SAT, 1660 SAT.
Key Resistance Levels: 2000 SAT, 2120 SAT, 2250 SAT.
Against BTC, XRP continues to fail to break 2000 SAT. The resistance there is provided by the 20-day MA and a falling trendline established at the start of June.
Since July, XRP traded sideways in a very narrow range between 2000 SAT and 1900 SAT. It would need to break this range to dictate the next direction for the market.
XRP-BTC Short Term Price Prediction
Looking ahead, the first support to the downside lies at 1900 SAT (Jul 2020 low). This is followed by 1800 SAT, 1660 SAT (downside 1.618 Fib Extension & 200-day MA), and 1550 SAT (November 2020 lows).
On the other side, the first resistance lies at 2000 SAT (20-day MA & June falling trendline). This is followed by 2120 SAT (bearish .236 Fib), 2250 SAT (100-day MA), and 2425 SAT (bearish .382 Fib & 50-day MA).
The RSI is flat at the 40 level, indicating weak bearish momentum. It would need to see an uptick before XRP can penetrate 2000 SAT.