XRP/USD – Buyers Push Above March Highs Key Support Levels: %excerpt%.659, %excerpt%.609, %excerpt%.556.Key Resistance Levels: %excerpt%.75, %excerpt%.773, %excerpt%.8. XRP is now up by a total of around 30% over the past week as it pushed higher from %excerpt%.55 (2019 highs) to break above %excerpt%.6 and reach the current resistance at %excerpt%.70. The cryptocurrency was trading inside a bullish wedge pattern during March but managed to close a daily candle toward the upside yesterday. Since breaking above, XRP surged higher to break above the March highs at %excerpt%.6 and reach as high as %excerpt%.74 today. It has now dropped back toward %excerpt%.7, but the breakout of the bullish wedge has allowed the market sentiment to turn from neutral consolidation to a bullish condition. XRP/USD Daily Chart. Source: TradingViewXRP-USD Short Term Price
Topics:
Yaz Sheikh considers the following as important: Ripple (XRP) Price, XRP Analysis, xrpbtc, xrpusd
This could be interesting, too:
Jordan Lyanchev writes Ripple’s (XRP) Surge to Triggers Over Million in Short Liquidations
Jordan Lyanchev writes Trump Confirms Work on Strategic Crypto Reserve: XRP, ADA, SOL Included
Dimitar Dzhondzhorov writes Is a Major Ripple v. SEC Lawsuit Development Expected This Week? Here’s Why
Mandy Williams writes Ripple Releases Institutional DeFi Roadmap for XRP Ledger in 2025
XRP/USD – Buyers Push Above March Highs
Key Support Levels: $0.659, $0.609, $0.556.
Key Resistance Levels: $0.75, $0.773, $0.8.
XRP is now up by a total of around 30% over the past week as it pushed higher from $0.55 (2019 highs) to break above $0.6 and reach the current resistance at $0.70.
The cryptocurrency was trading inside a bullish wedge pattern during March but managed to close a daily candle toward the upside yesterday. Since breaking above, XRP surged higher to break above the March highs at $0.6 and reach as high as $0.74 today.
It has now dropped back toward $0.7, but the breakout of the bullish wedge has allowed the market sentiment to turn from neutral consolidation to a bullish condition.
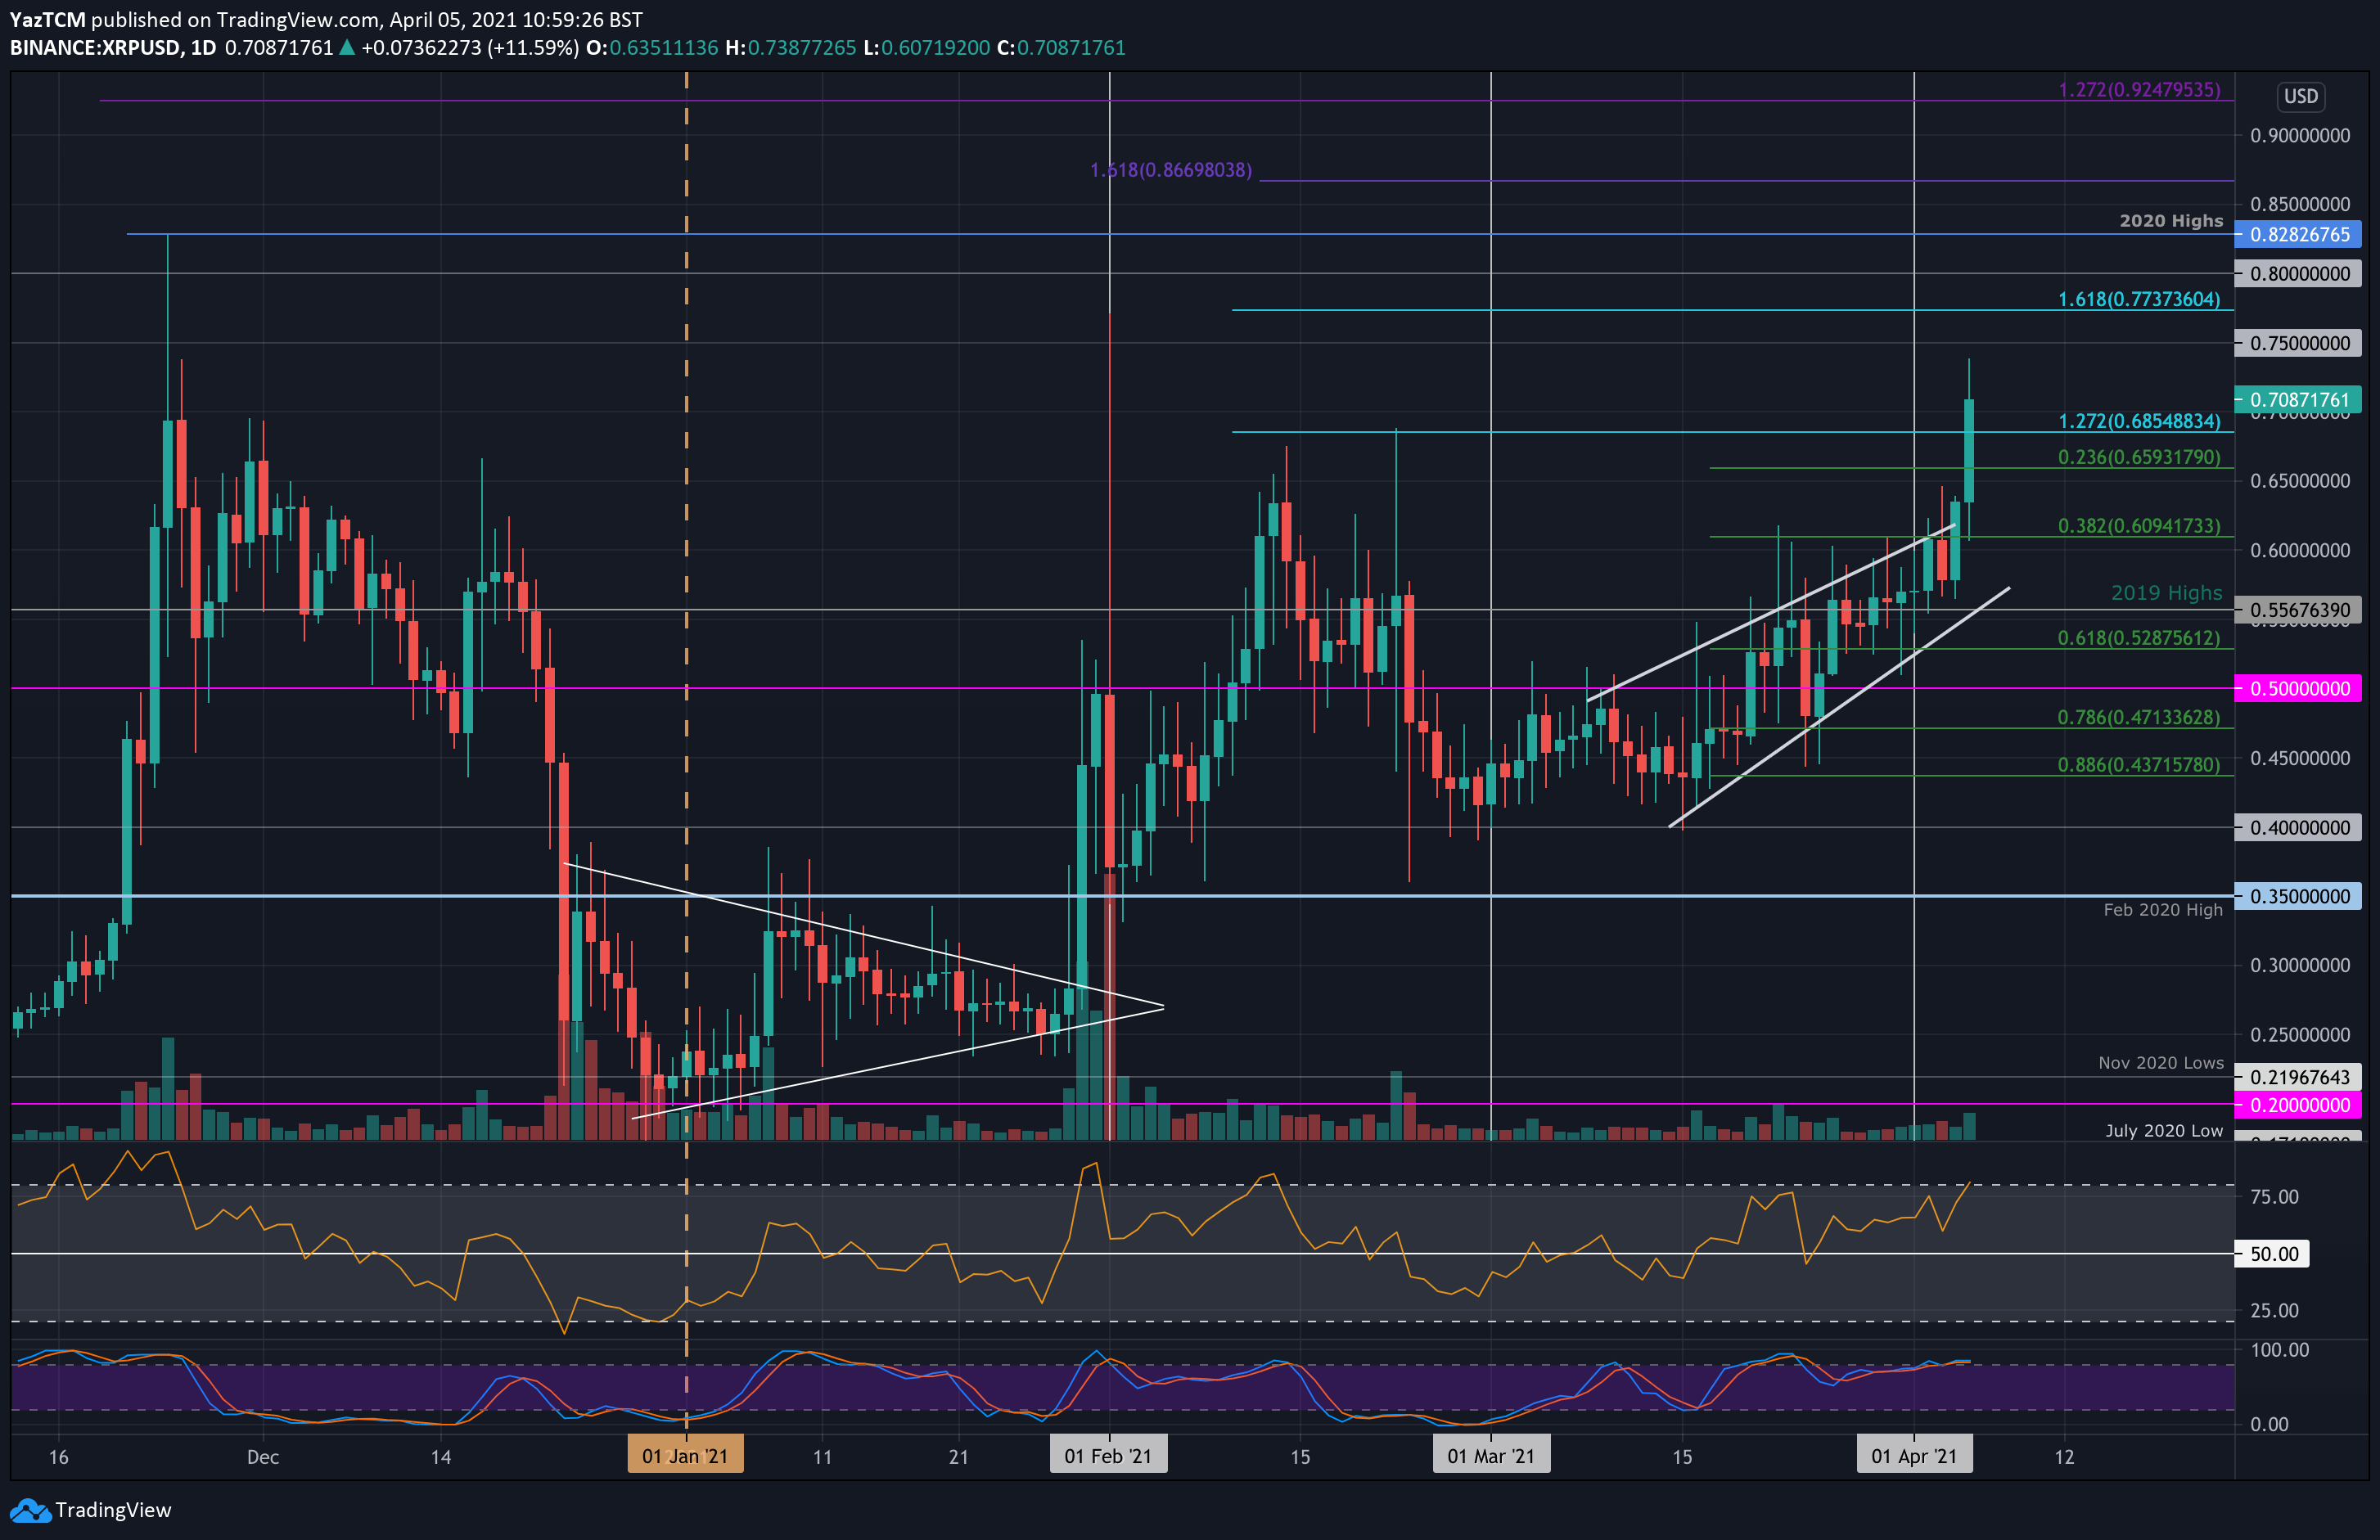
XRP-USD Short Term Price Prediction
Looking ahead, the first resistance lies at $0.75. This is followed by $0.773 (1.618 Fib Extension), $0.8, and $0.828 (2020 highs).
On the other side, the first support lies at $0.659 (.236 Fib). This is followed by $0.609 (.382 Fib), $0.556 (2019 Highs), $0.528 (.618 Fib), and $0.5.
The RSI is now approaching overbought conditions but still has room to allow the market to continue much higher.
XRP/BTC – Buyers Break Above Ascending Triangle Pattern.
Key Support Levels: 1200, 1100 SAT, 1000 SAT.
Key Resistance Levels: 1245 SAT, 1345 SAT, 1422 SAT.
XRP is also performing very well against Bitcoin after breaking toward the upside of an ascending triangle pattern. The cryptocurrency was trading inside this pattern since mi-March with the roof of the triangle at around 1050 SAT.
The breakout occurred yesterday as XRP surged above 1000 SAT to reach as high as 1100 SAT. It continued further today to break past the December 2017 lows at 1200 SAT, and reach the current resistance at 1245 SAT (1.414 Fib Extension).
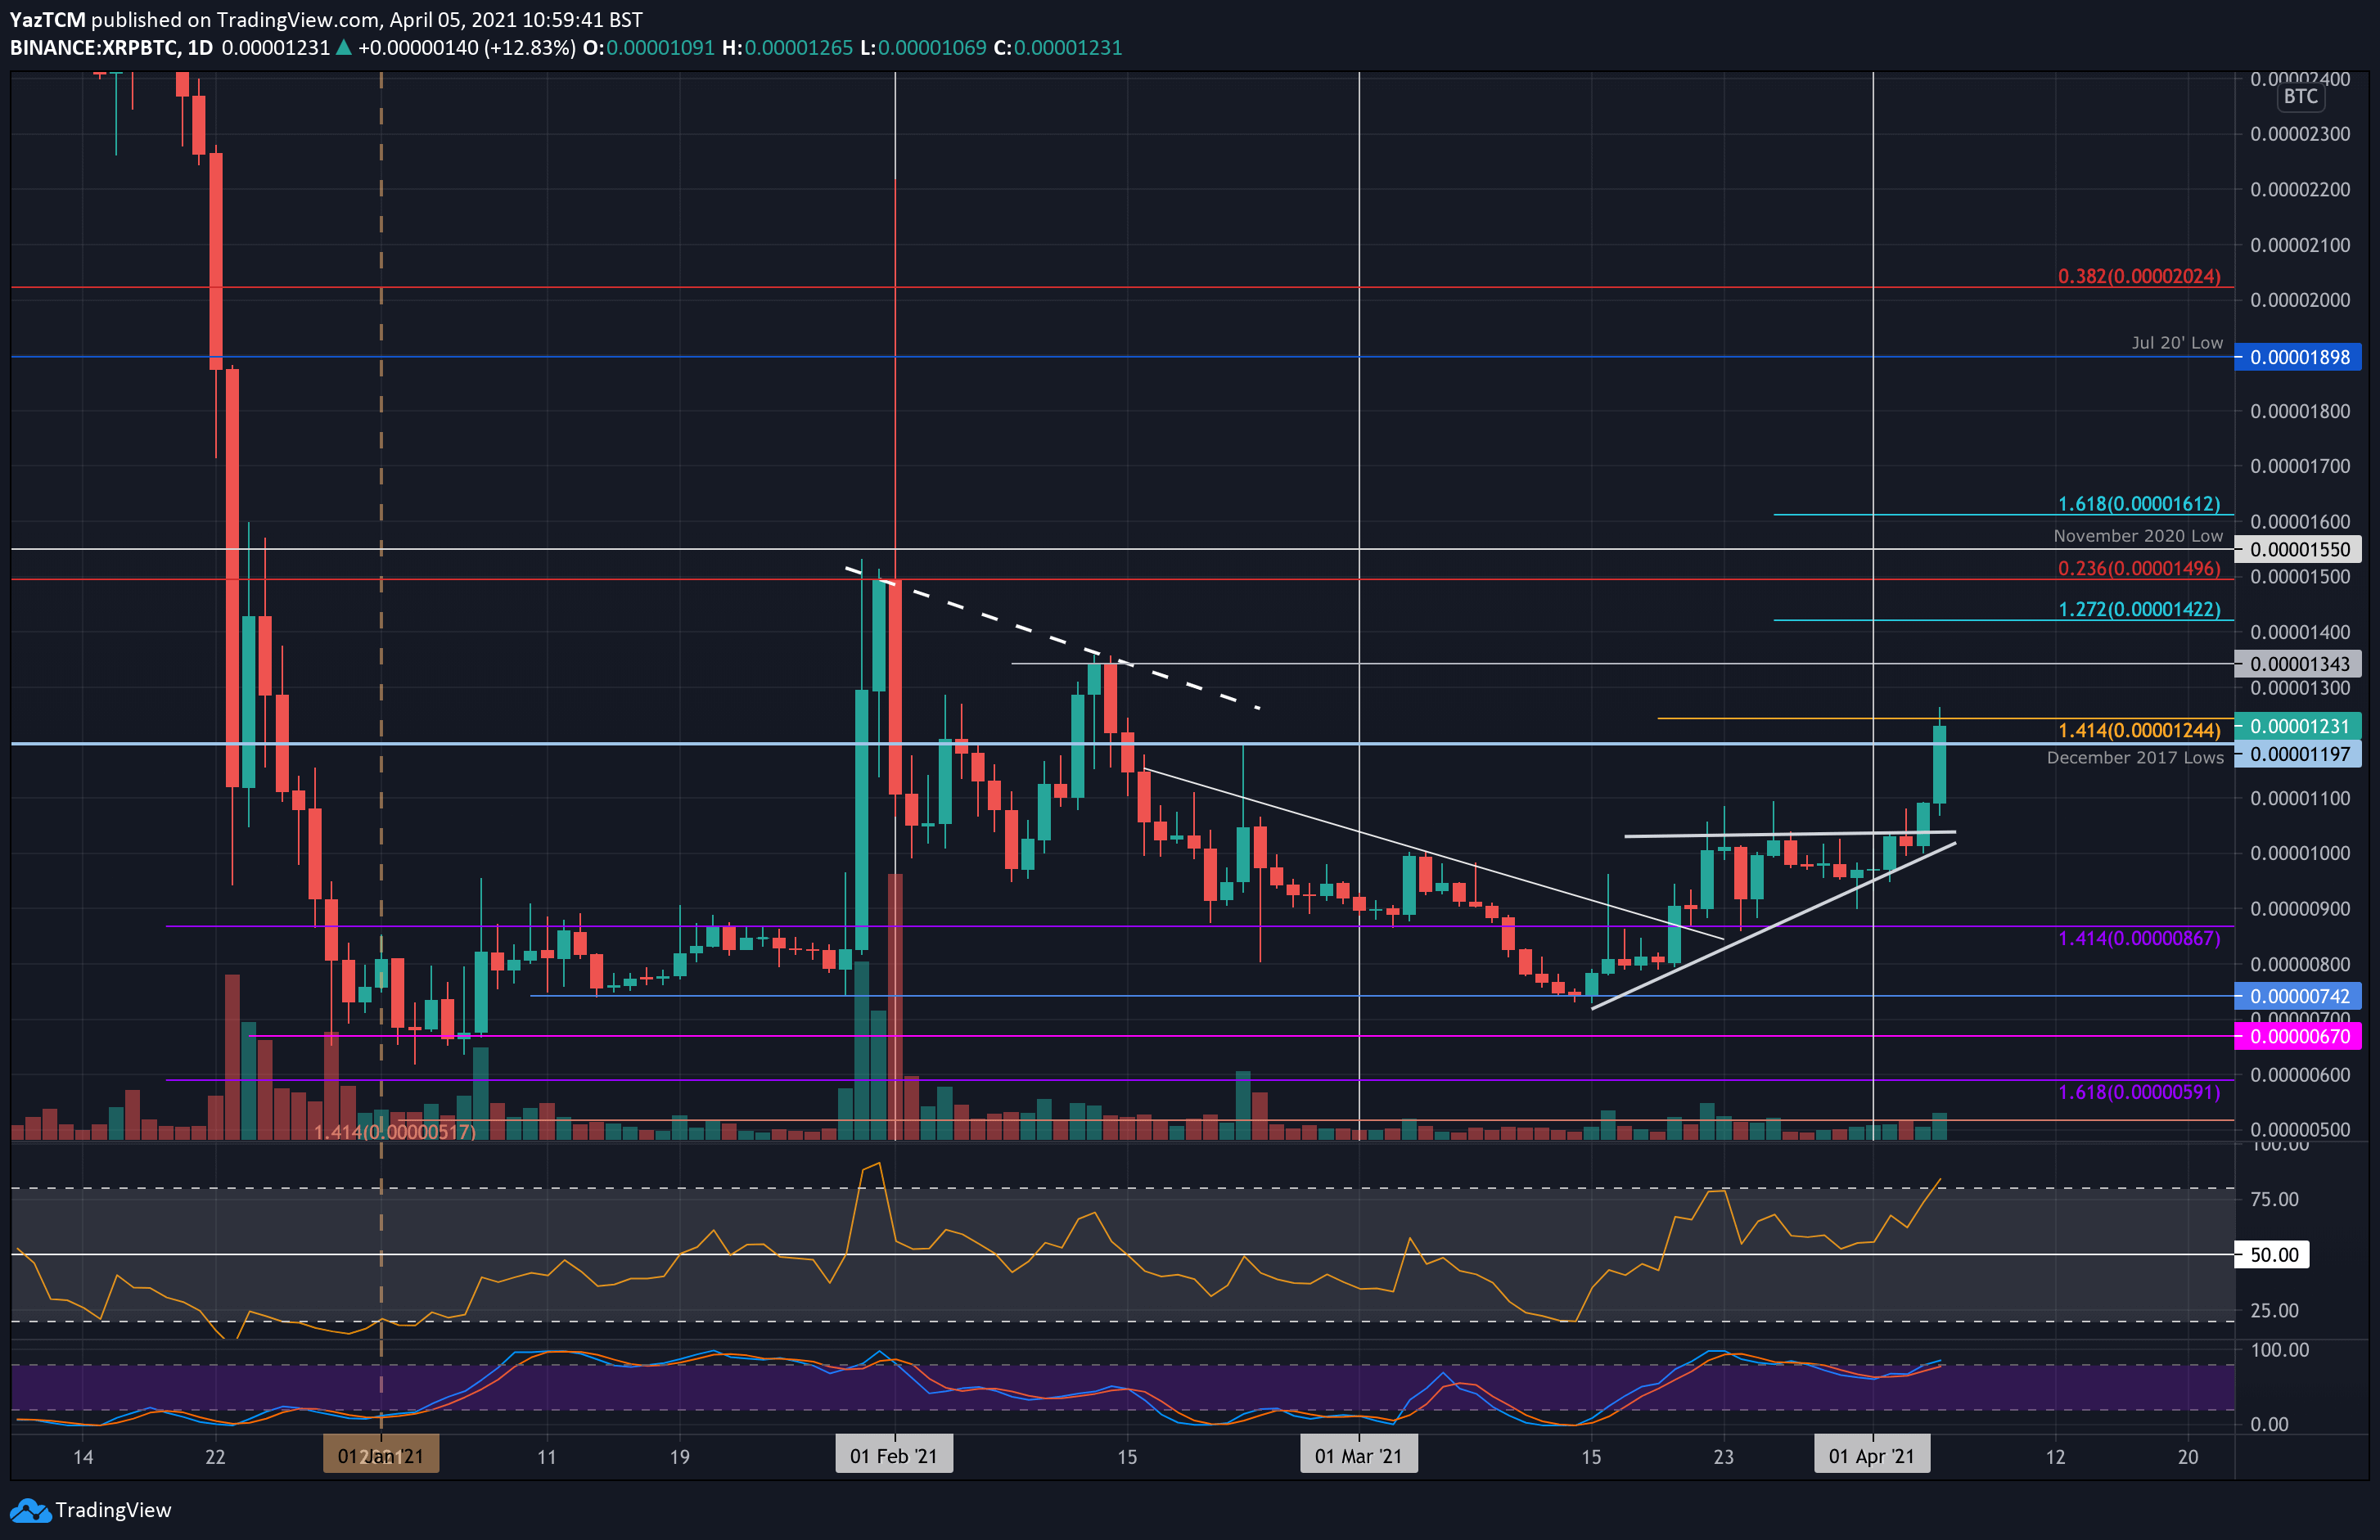
XRP-BTC Short Term Price Prediction
Looking ahead, the first resistance lies at 1245 SAT. This is followed by 1345 SAT (mid-March highs), 1422 SAT (1.272 Fib Extension), 1500 SAT (bearish .236 Fib), and 1550 SAT (Nov 2020 lows).
On the other side, the first support lies at 1200 SAT. This is followed by 1100 SAT, 1000 SAT, 900 SAT, 867 SAT, and 800 SAT.
Likewise, the daily RSI is in overbought conditions but still has room for the momentum to push higher before becoming extremely overbought.