XRP/USD – XRP Spikes Into 2020 Highs Key Support Levels: %excerpt%.828, %excerpt%.8, %excerpt%.75.Key Resistance Levels: %excerpt%.9, .00, .05. XRP dropped by a sharp 9% over the past 24 hours as it falls beneath a rising trend line and spikes as low as %excerpt%.82 (2020 highs) today. The cryptocurrency started the month of June off by battling resistance at .05 (bearish .382). Unfortunately, this level actually formed the upper boundary of an ascending triangle pattern, and the buyers were unable to overcome it. XRP fell beneath .00 last week and continued to slide into the lower boundary of the triangle. Yesterday, after another failed attempt to break , XRP fell beneath the rising trend line to fall into the 2020 highs. It has since bounced to trade around %excerpt%.86. XRP/USD Daily Chart. Source:
Topics:
Yaz Sheikh considers the following as important: Ripple (XRP) Price, XRP Analysis, xrpbtc, xrpusd
This could be interesting, too:
Jordan Lyanchev writes Ripple’s (XRP) Surge to Triggers Over Million in Short Liquidations
Jordan Lyanchev writes Trump Confirms Work on Strategic Crypto Reserve: XRP, ADA, SOL Included
Dimitar Dzhondzhorov writes Is a Major Ripple v. SEC Lawsuit Development Expected This Week? Here’s Why
Mandy Williams writes Ripple Releases Institutional DeFi Roadmap for XRP Ledger in 2025
XRP/USD – XRP Spikes Into 2020 Highs
Key Support Levels: $0.828, $0.8, $0.75.
Key Resistance Levels: $0.9, $1.00, $1.05.
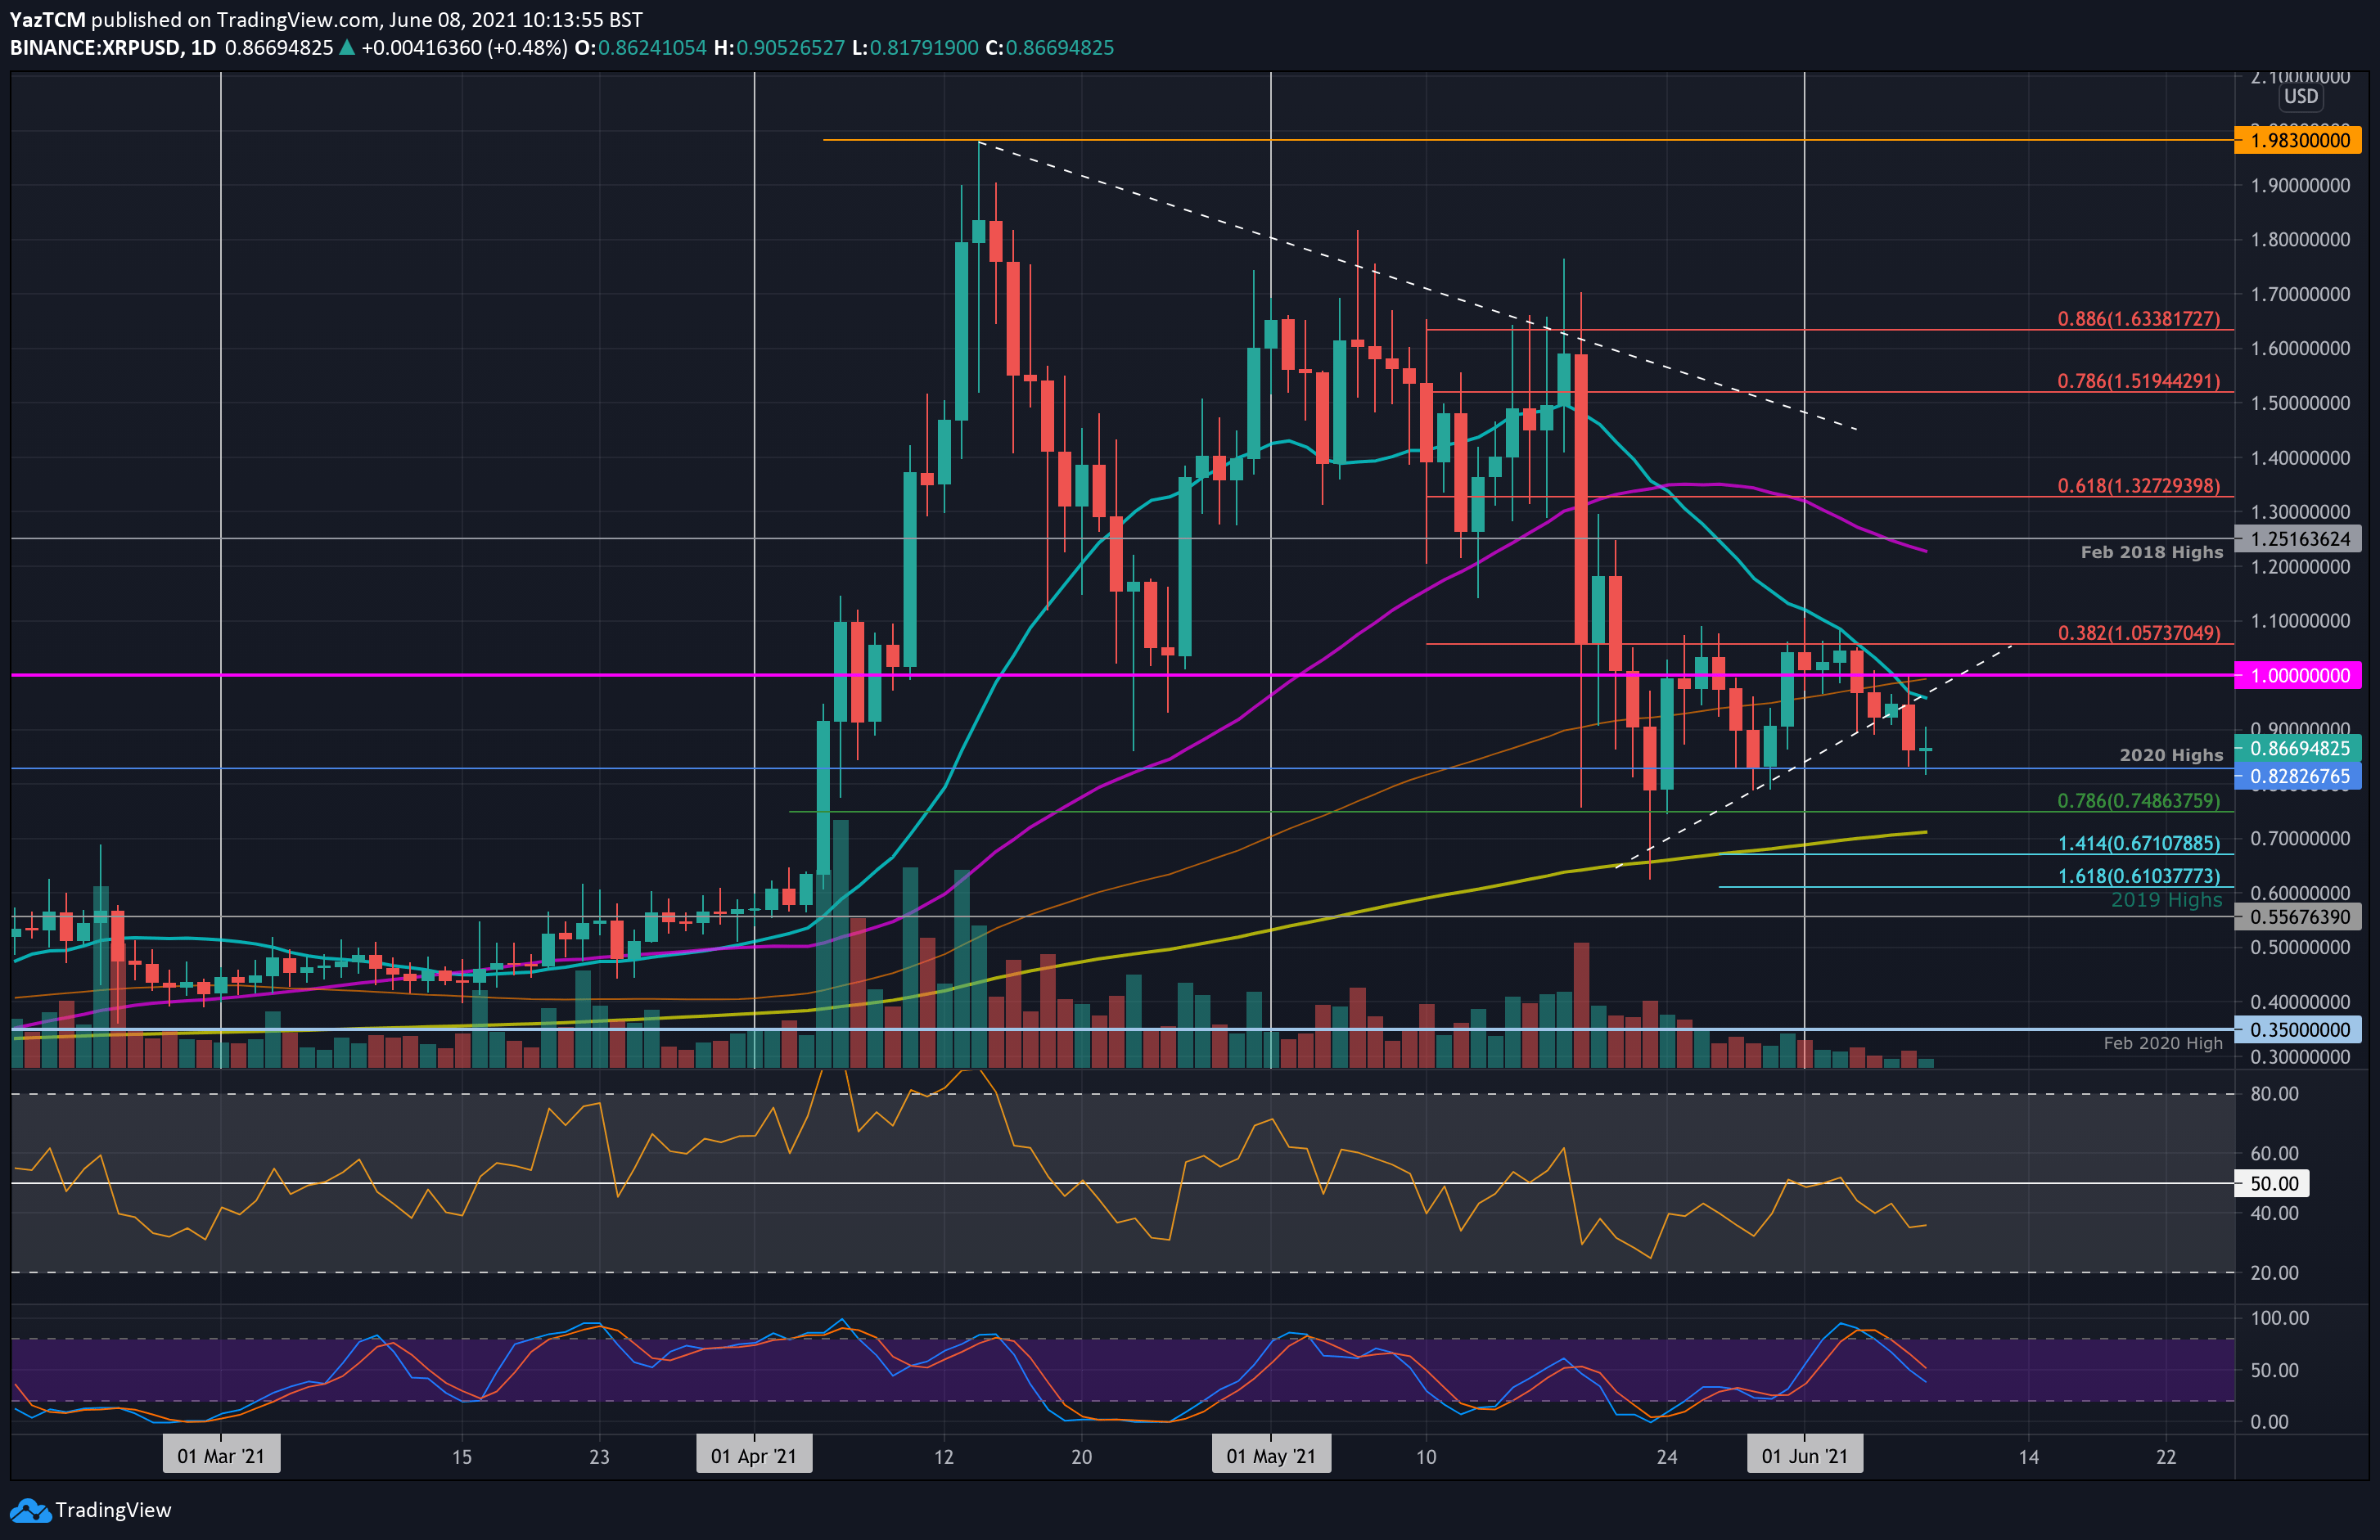
XRP dropped by a sharp 9% over the past 24 hours as it falls beneath a rising trend line and spikes as low as $0.82 (2020 highs) today.
The cryptocurrency started the month of June off by battling resistance at $1.05 (bearish .382). Unfortunately, this level actually formed the upper boundary of an ascending triangle pattern, and the buyers were unable to overcome it.
XRP fell beneath $1.00 last week and continued to slide into the lower boundary of the triangle. Yesterday, after another failed attempt to break $1, XRP fell beneath the rising trend line to fall into the 2020 highs. It has since bounced to trade around $0.86.
XRP-USD Short Term Price Prediction
Looking ahead, if the sellers continue lower, the first support lies at $0.828 (2020 highs). This is followed by $0.8, $0.75 (.786 Fib), $0.7 (200-day MA), and $0.671 (downside 1.414 Fib Extension).
On the other side, the first resistance lies at $0.9. This is followed by $1 (100-day MA), $1.05 (bearish .382 Fib), and $1.25 (50-day MA and Feb 2018 Highs).
The RSI is making lower lows beneath the midline, indicating that the bearish momentum is increasing. However, it still has room to continue lower before becoming oversold, meaning that the selling might be far from over.
XRP/BTC – Bulls Battle With 50-day MA
Key Support Levels: 2570 SAT, 2465 SAT, 2360 SAT.
Key Resistance Levels: 2660 SAT, 2800 SAT, 2863 SAT.
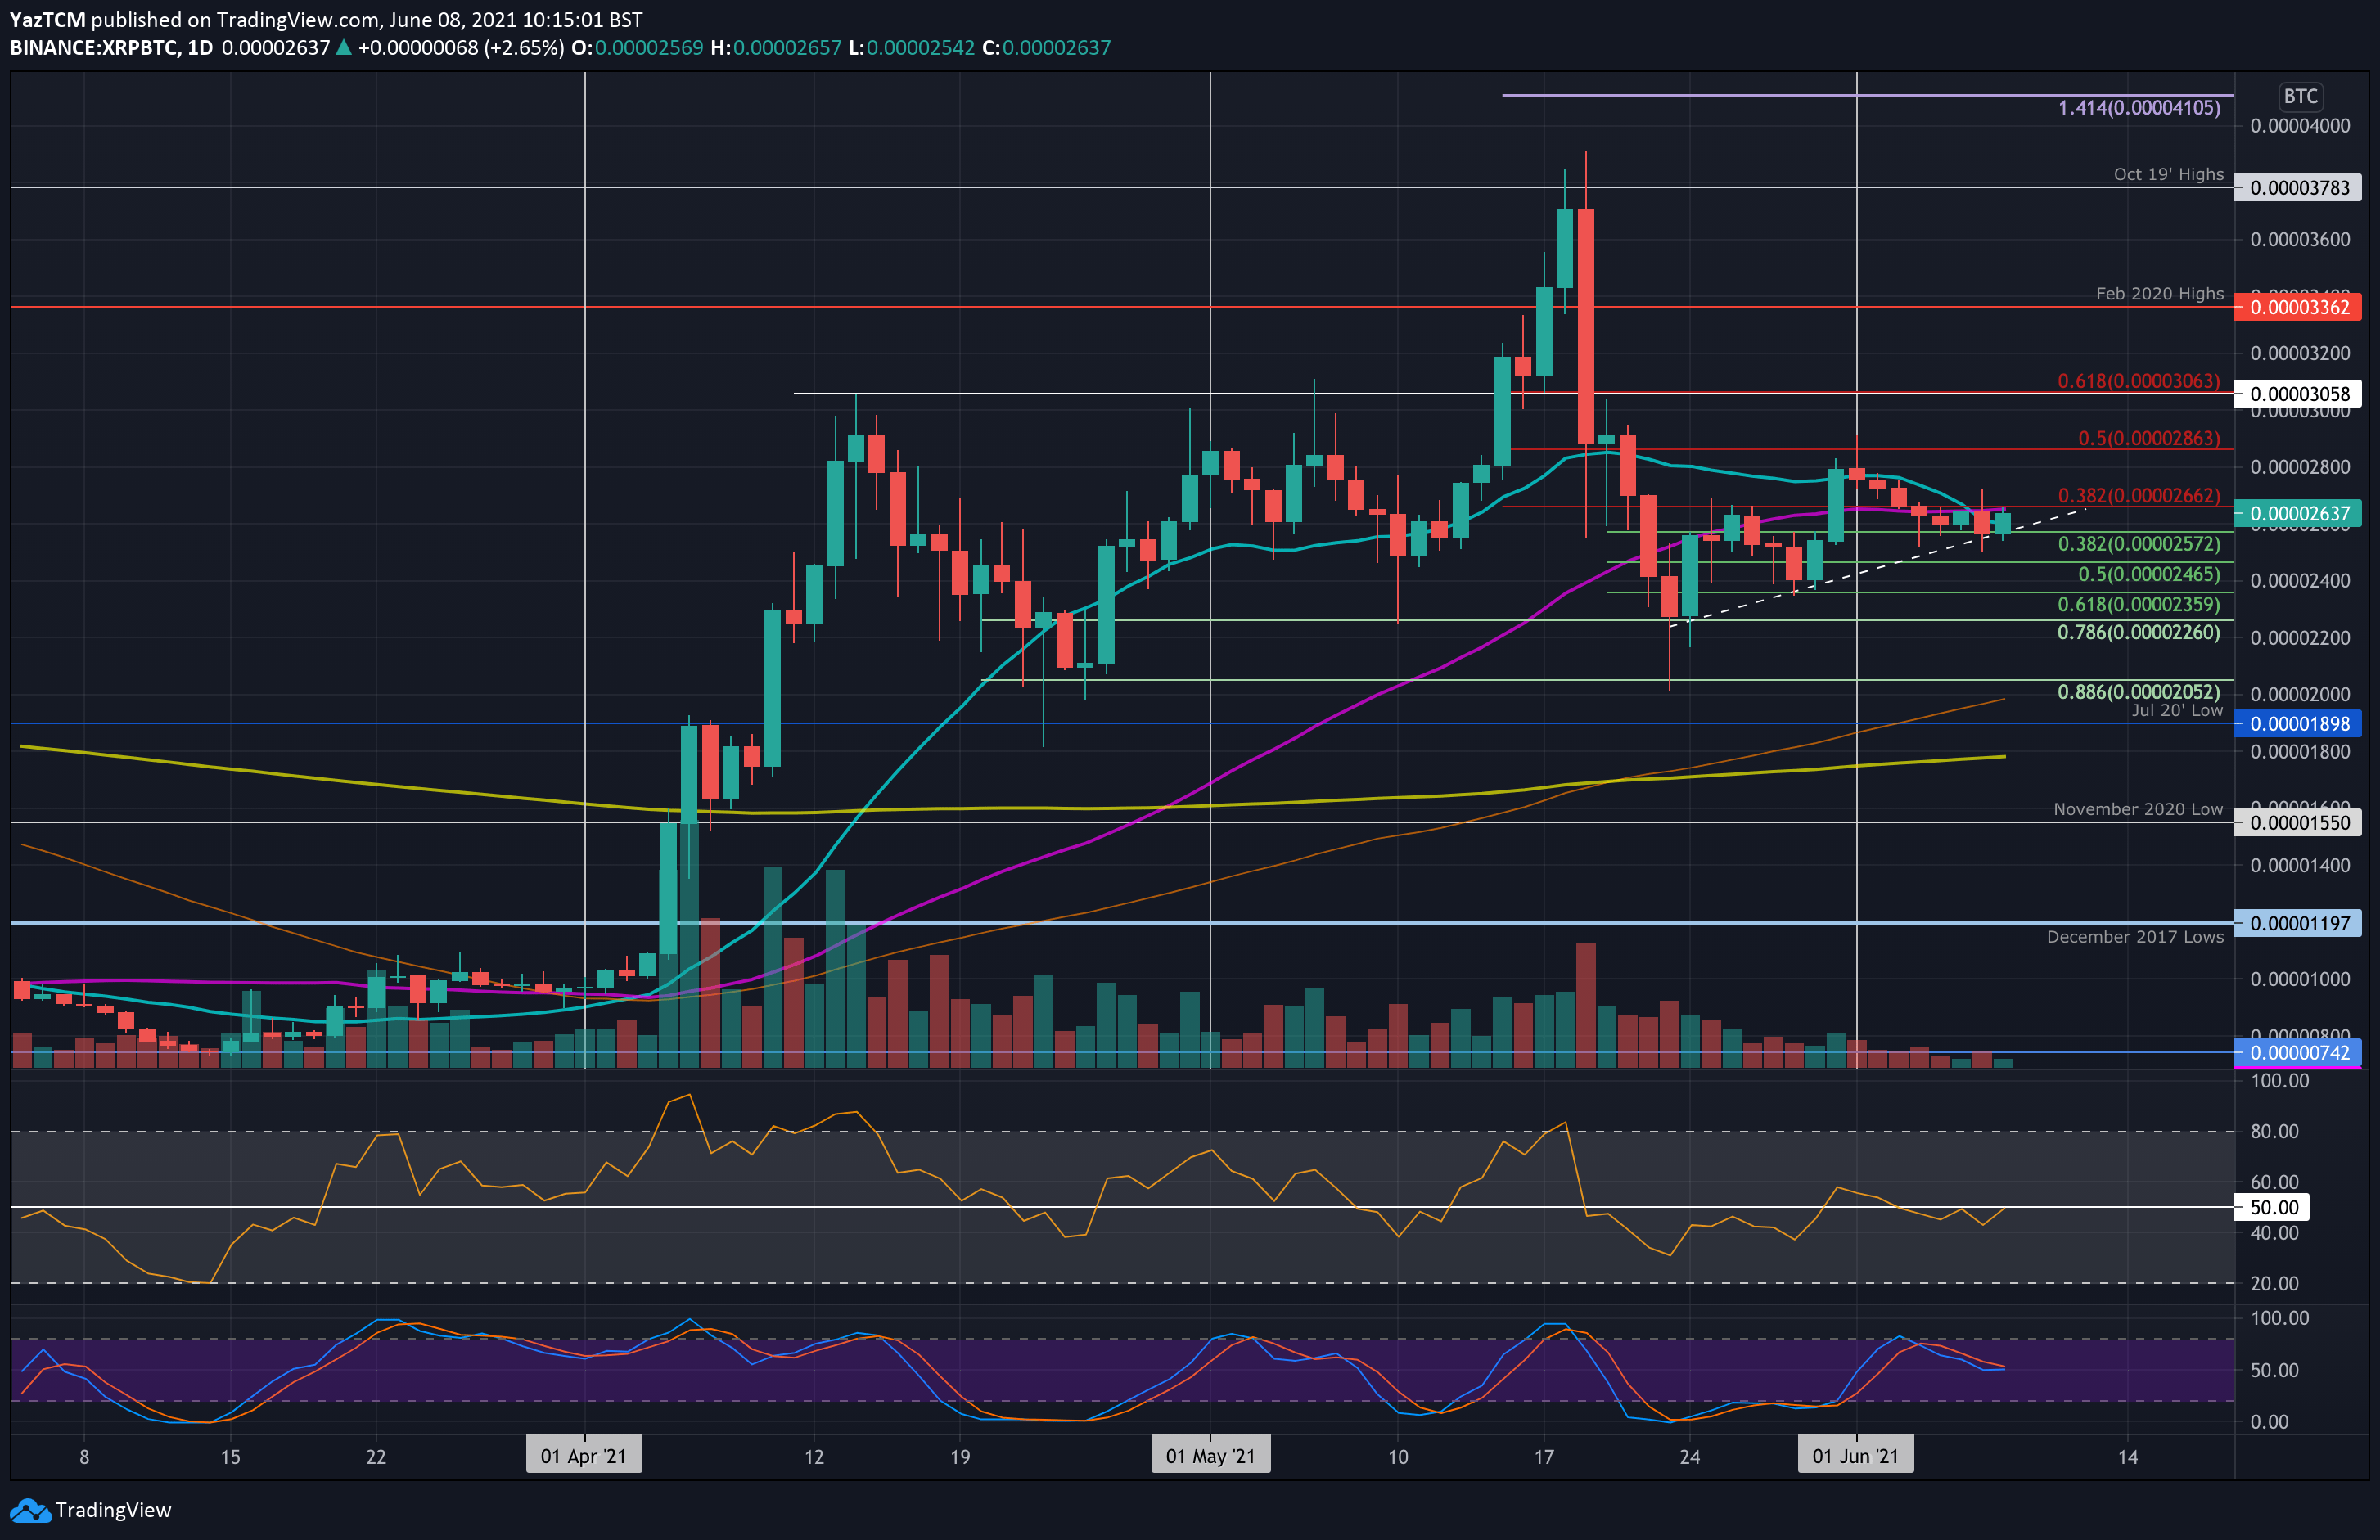
Against BTC, XRP has struggled to break the 50-day MA level over the past five days. A bearish .382 Fib further bolsters the resistance at 2660 SAT.
XRP started June off above 2800 SAT but since headed lower. It found support at 2570 SAT 9.382 Fib) yesterday and is battling to remain above there today. XRP will need to break the resistance at the 50-day MA to attempt the May highs again.
XRP-BTC Short Term Price Prediction
Looking ahead, if the bulls break 2660 SAT (bearish .382 Fib & 50-day MA), the first resistance lies at 2800 SAT. This is followed by 2863 SAT (bearish .5 Fib), 3058 SAT (bearish .618 Fib), and 3360 SAT (Feb 2020 highs).
On the other side, the first support lies at 2570 SAT (.382 Fib). This is followed by 2465 SAT (.5 Fib), 2360 SAT (.618 Fib), and 2260 SAT (long-term .786 Fib).
The RSI is at the midline, indicating indecision within the market. To break above the 50-day MA and head higher, the RSI must pass above 50 and rise beyond 60 to show increased bullish momentum within the market.