Any optimism for a rally is fading quickly as the Merge upgrade date approaches. Two weekly candles closed in red, warning of the formation of a bearish structure. Ethereum lost approximately 30% of its value over that period. Technical Analysis By Grizzly The Daily Chart Ethereum is forming a lower low on the daily chart. The structure, followed by the formation of lower highs and lower lows, can be the precursor of continuous declines. So far, the bears managed to erase the 50% increase from July (in yellow). Let’s assume that the DXY index, which has just broken the last high, continues its upward trend. In this case, Ethereum is likely to test the horizontal support at ,300 in the short term, which intersects with the 61.8% Fib golden level (in green). The end of the
Topics:
CryptoVizArt considers the following as important: ETH Analysis, ETHBTC, Ethereum (ETH) Price, ethusd
This could be interesting, too:
Mandy Williams writes Ethereum Derivatives Metrics Signal Modest Downside Tail Risk Ahead: Nansen
Jordan Lyanchev writes Weekly Bitcoin, Ethereum ETF Recap: Light at the End of the Tunnel for BTC
CryptoVizArt writes Will Weak Momentum Drive ETH to .5K? (Ethereum Price Analysis)
Jordan Lyanchev writes Bybit Hack Fallout: Arthur Hayes, Samson Mow Push for Ethereum Rollback
Any optimism for a rally is fading quickly as the Merge upgrade date approaches. Two weekly candles closed in red, warning of the formation of a bearish structure. Ethereum lost approximately 30% of its value over that period.
Technical Analysis
By Grizzly
The Daily Chart
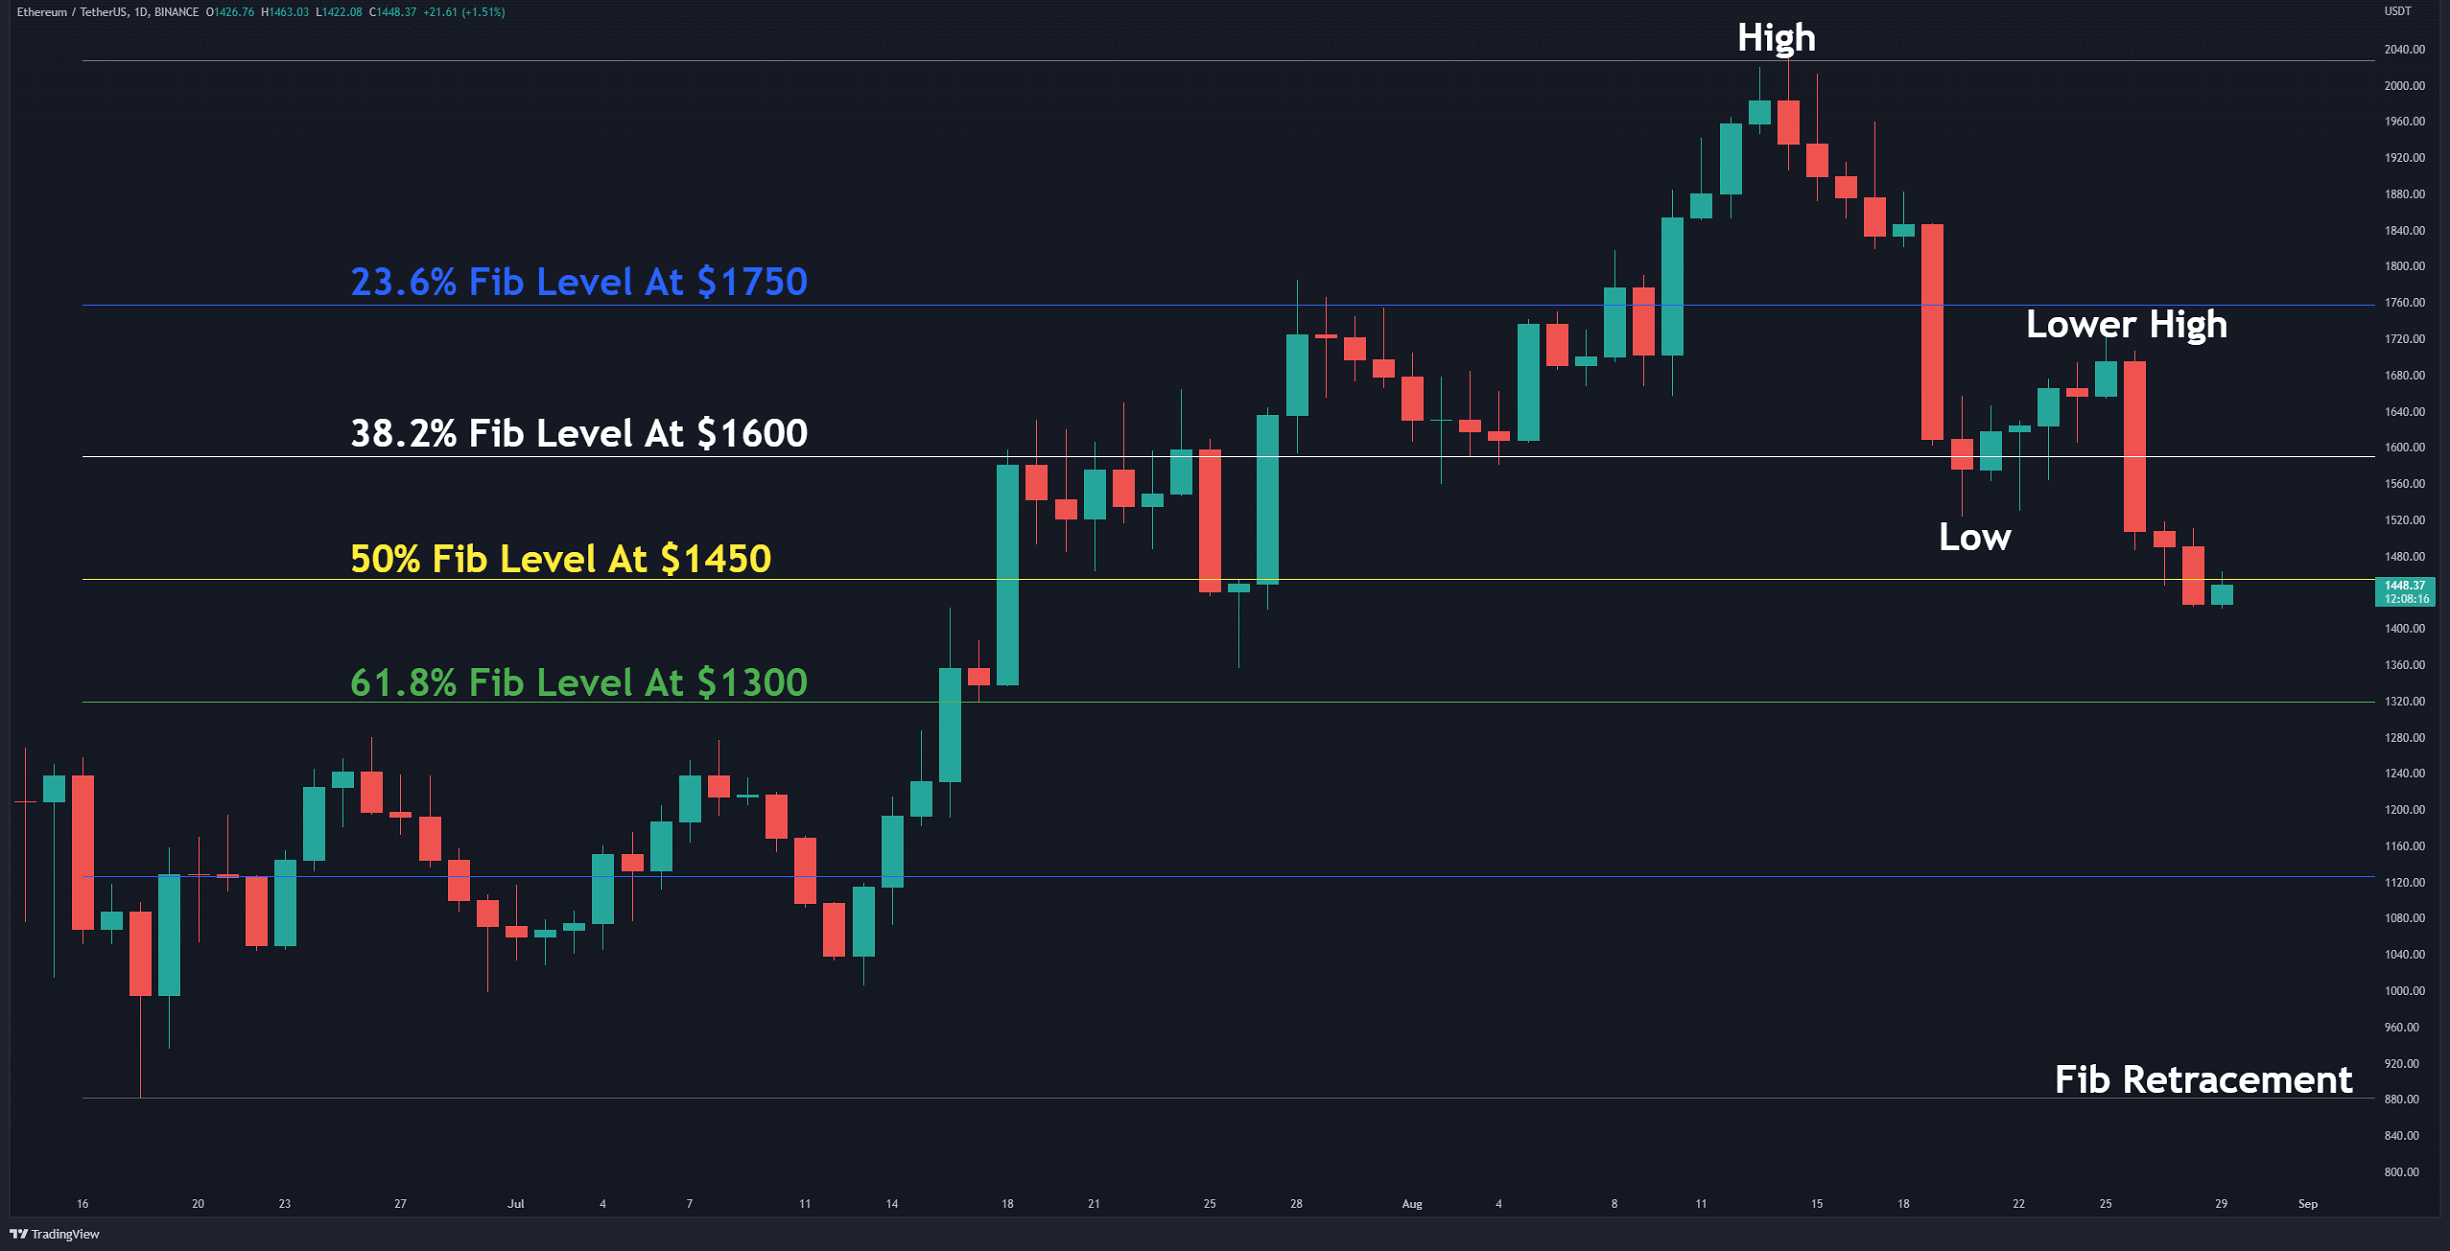
Ethereum is forming a lower low on the daily chart. The structure, followed by the formation of lower highs and lower lows, can be the precursor of continuous declines. So far, the bears managed to erase the 50% increase from July (in yellow).
Let’s assume that the DXY index, which has just broken the last high, continues its upward trend. In this case, Ethereum is likely to test the horizontal support at $1,300 in the short term, which intersects with the 61.8% Fib golden level (in green).
The end of the downward trend could come only if the price forms a higher high and higher low. Until then, the bearish bias remains strong.
Key Support Levels: $1450 & $1300
Key Resistance Levels: $1600 & $1750
Daily Moving Averages:
MA20: $1719
MA50: $1602
MA100: $1521
MA200: $2166
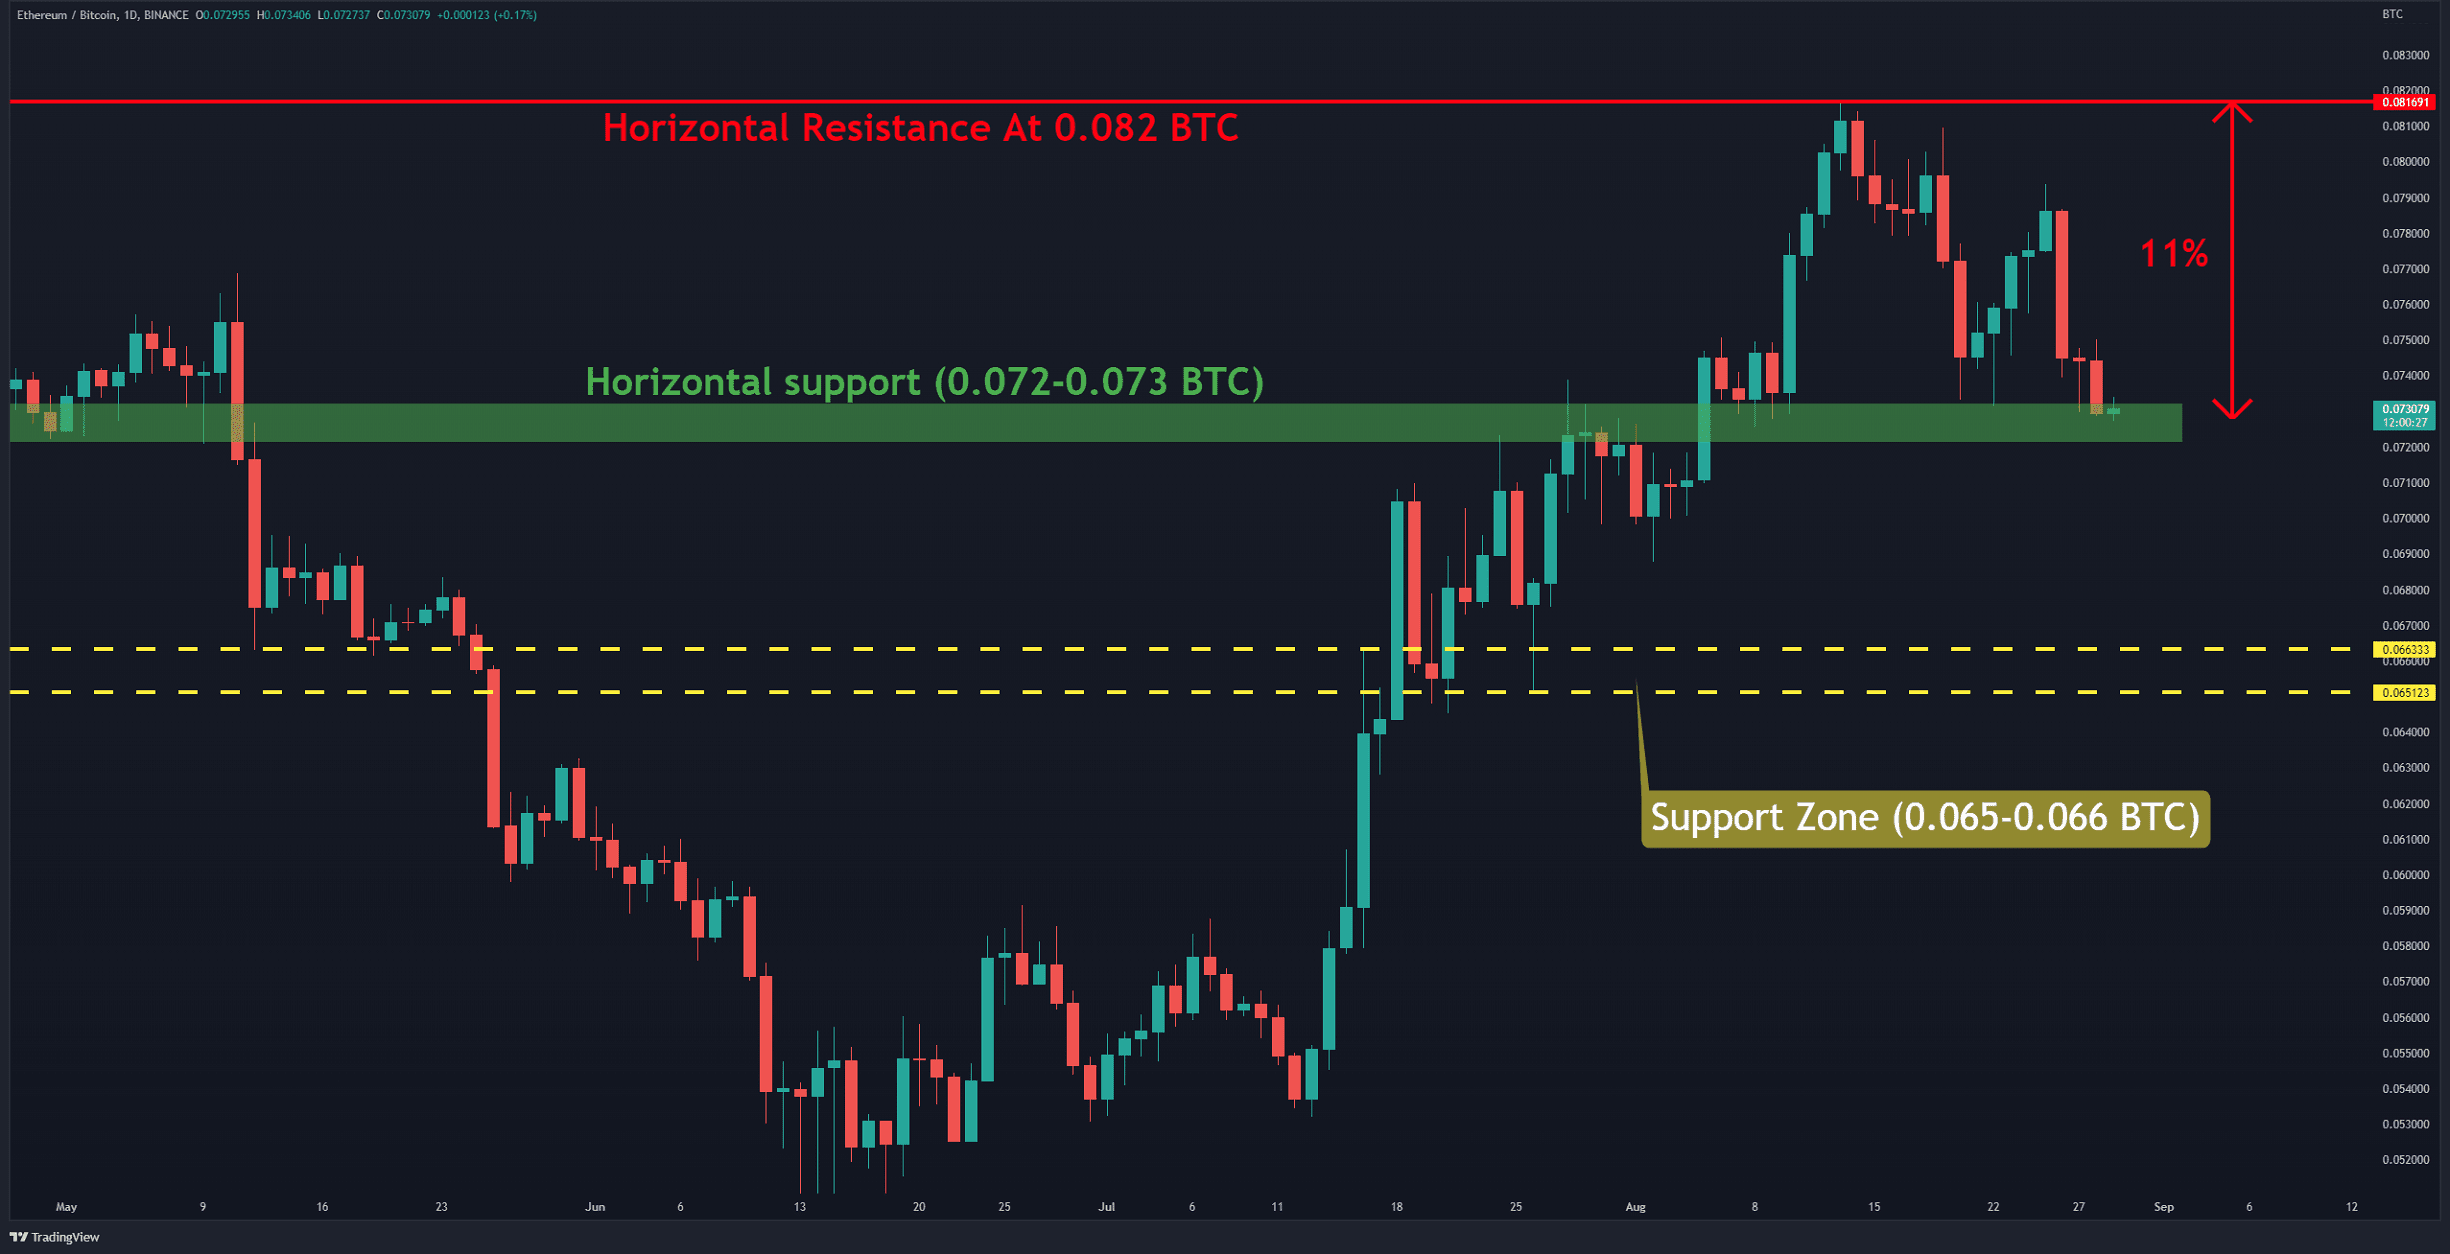
The ETH/BTC Chart
Against Bitcoin, the bears pushed the price down 11% in the last two weeks as attempts to retest the horizontal resistance at 0.082 BTC (in red) had little effect. The pair is currently trading near horizontal support in the 0.072-0.073 BTC range (in green). A close and break below this level could trigger the start of a corrective wave. The target of such movement is considered in the range of 0.065-0.066 BTC (in yellow).
Key Support Levels: 0.0.073 & 0.065 BTC
Key Resistance Levels: 0.083 & 0.088 BTC
On-chain Analysis
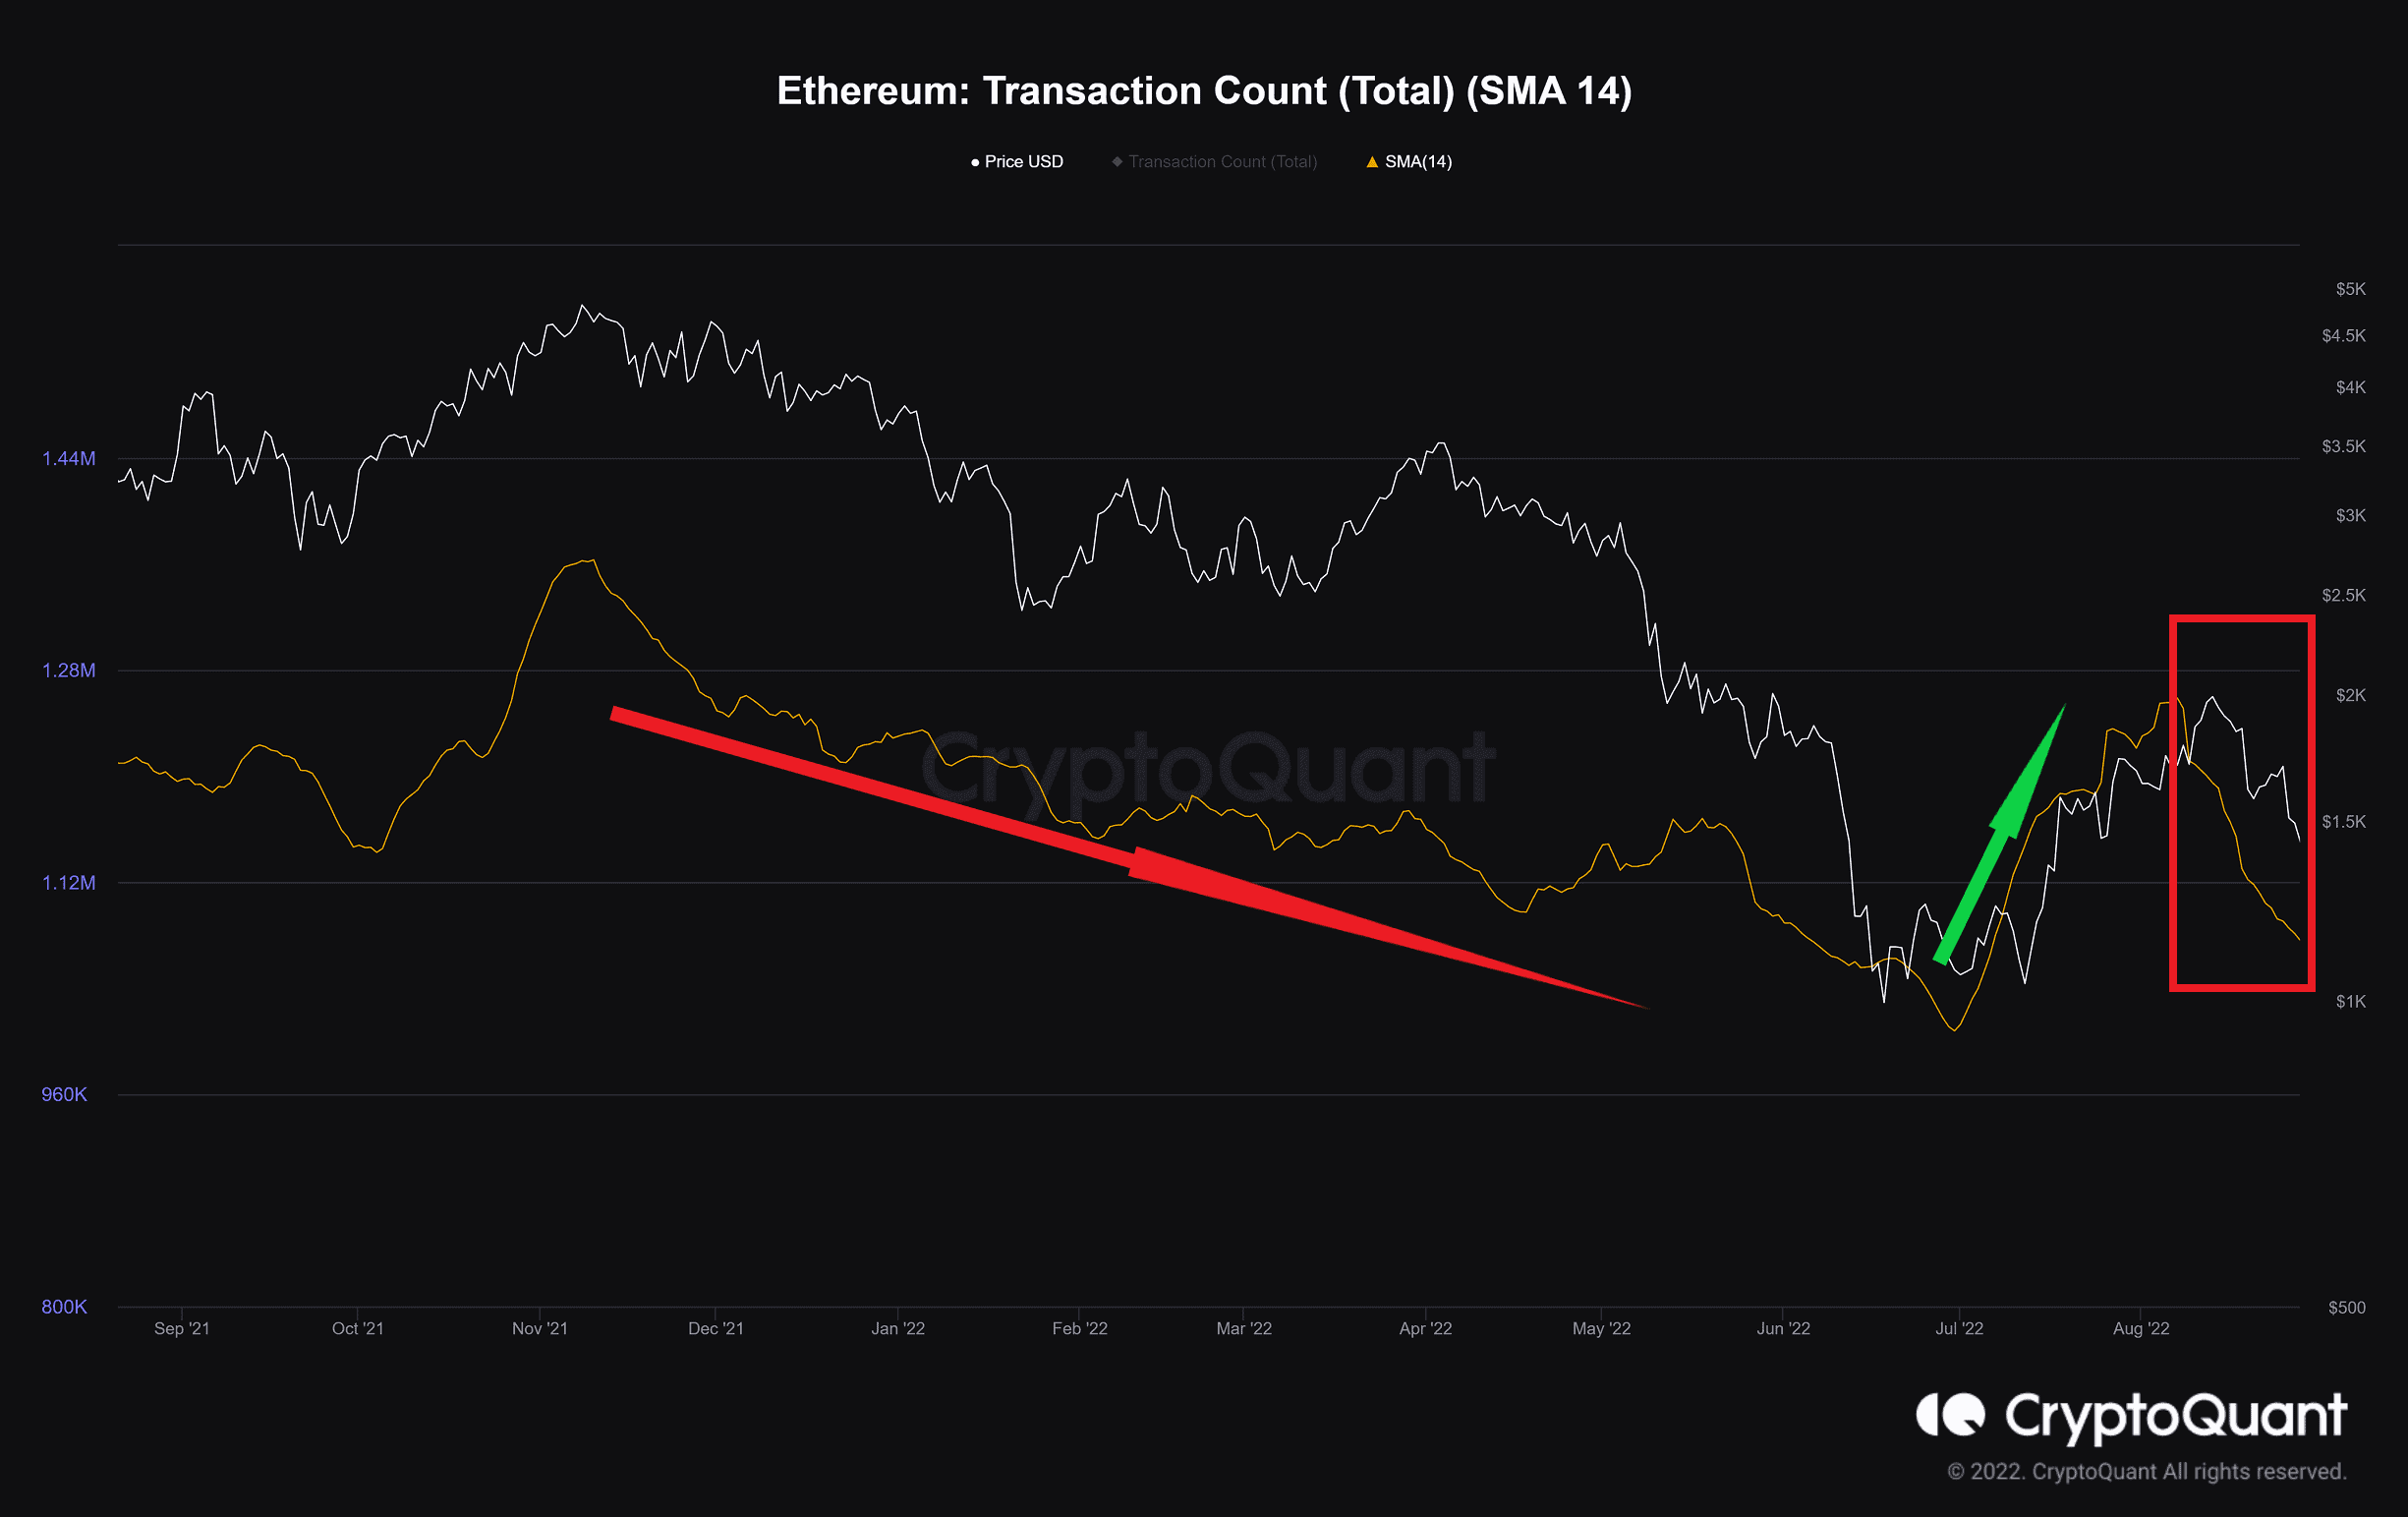
Transaction Count (SMA 30)
Definition: The total number of transactions where the transfer of tokens has been executed.
The number of transactions on the network, which had an utterly downward trend since the all-time high, increased sharply during the recent bullish leg. This was likely due to recently released news about the Merge.
Interestingly, before the start of the current correction, this index dropped. This can often be considered a warning for an incoming drop.