After tumbling 76% from its all-time high, Cardano found support at the bottom of the descending channel around %excerpt%.75 and was able to reclaim almost 50%. In a few weeks, ADA returned above the converted mark at . The Daily Chart Technical analysis by Grizzly On the daily timeframe, after a significant price surge, ADA reached the top of the descending channel as shown on the chart below (marked by yellow), which intersects with the static resistance at .2 (marked by blue). However, the bulls failed in their first attempt to overcome this resistance. Looking at the RSI 30-day, the downtrend line (marked red) that accompanied Cardano for more than a year has prevented further increase. By crossing the mentioned resistances and forming a higher high above .2 and
Topics:
CryptoVizArt considers the following as important: ADABTC, ADAUSD, Cardano (ADA) Price, Price Analysis
This could be interesting, too:
Jordan Lyanchev writes Cardano (ADA) Surpasses Dogecoin After 55% Surge
Jordan Lyanchev writes Trump Confirms Work on Strategic Crypto Reserve: XRP, ADA, SOL Included
Dimitar Dzhondzhorov writes Millions of ADA Sold by Cardano Whales During Market Crash – Will the Decline Continue?
Jordan Lyanchev writes Here’s How Cardano’s 17% Weekly Correction Can Help ADA Hit This Cycle: Analyst
After tumbling 76% from its all-time high, Cardano found support at the bottom of the descending channel around $0.75 and was able to reclaim almost 50%. In a few weeks, ADA returned above the converted mark at $1.
The Daily Chart
Technical analysis by Grizzly
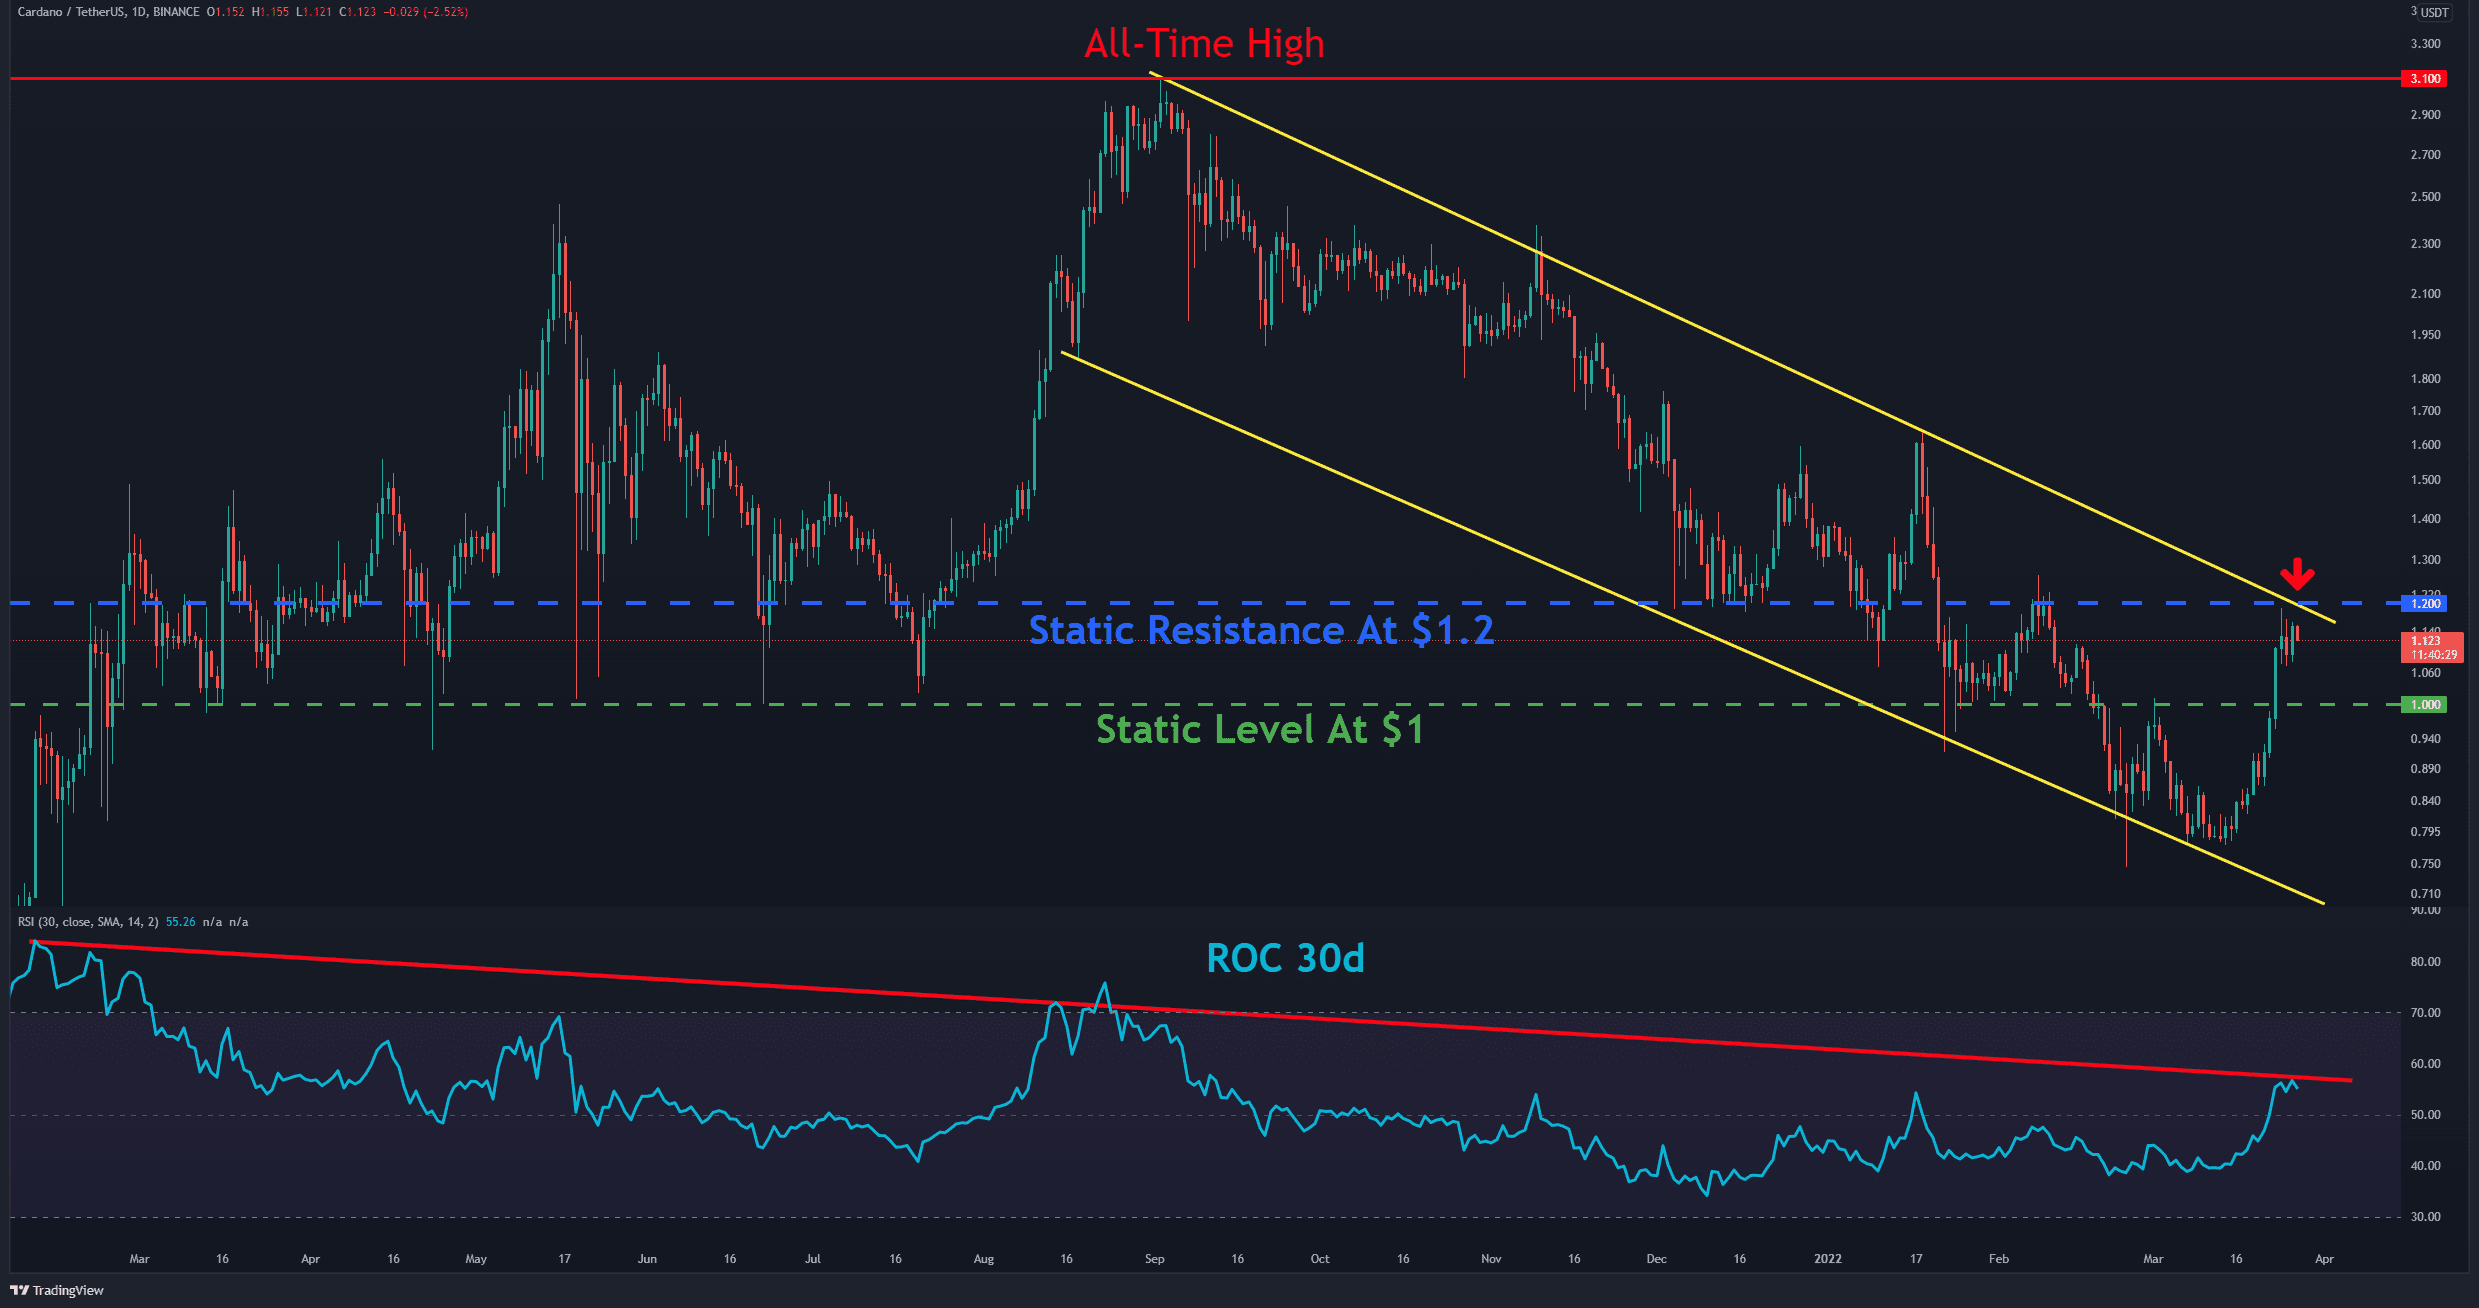
On the daily timeframe, after a significant price surge, ADA reached the top of the descending channel as shown on the chart below (marked by yellow), which intersects with the static resistance at $1.2 (marked by blue).
However, the bulls failed in their first attempt to overcome this resistance.
Looking at the RSI 30-day, the downtrend line (marked red) that accompanied Cardano for more than a year has prevented further increase.
By crossing the mentioned resistances and forming a higher high above $1.2 and breaking above the descending channel, the speculators would be more confident in the reversal of the recent downtrend.
On the other hand, if ADA fails at $1.2, then $1 should be a significant support line to watch.
Moving Average Exponential (EMA) lines for possible support/resistance to watch:
EMA20: $0.91
EMA50: $0.95
EMA100: $1.09
EMA200: $1.53
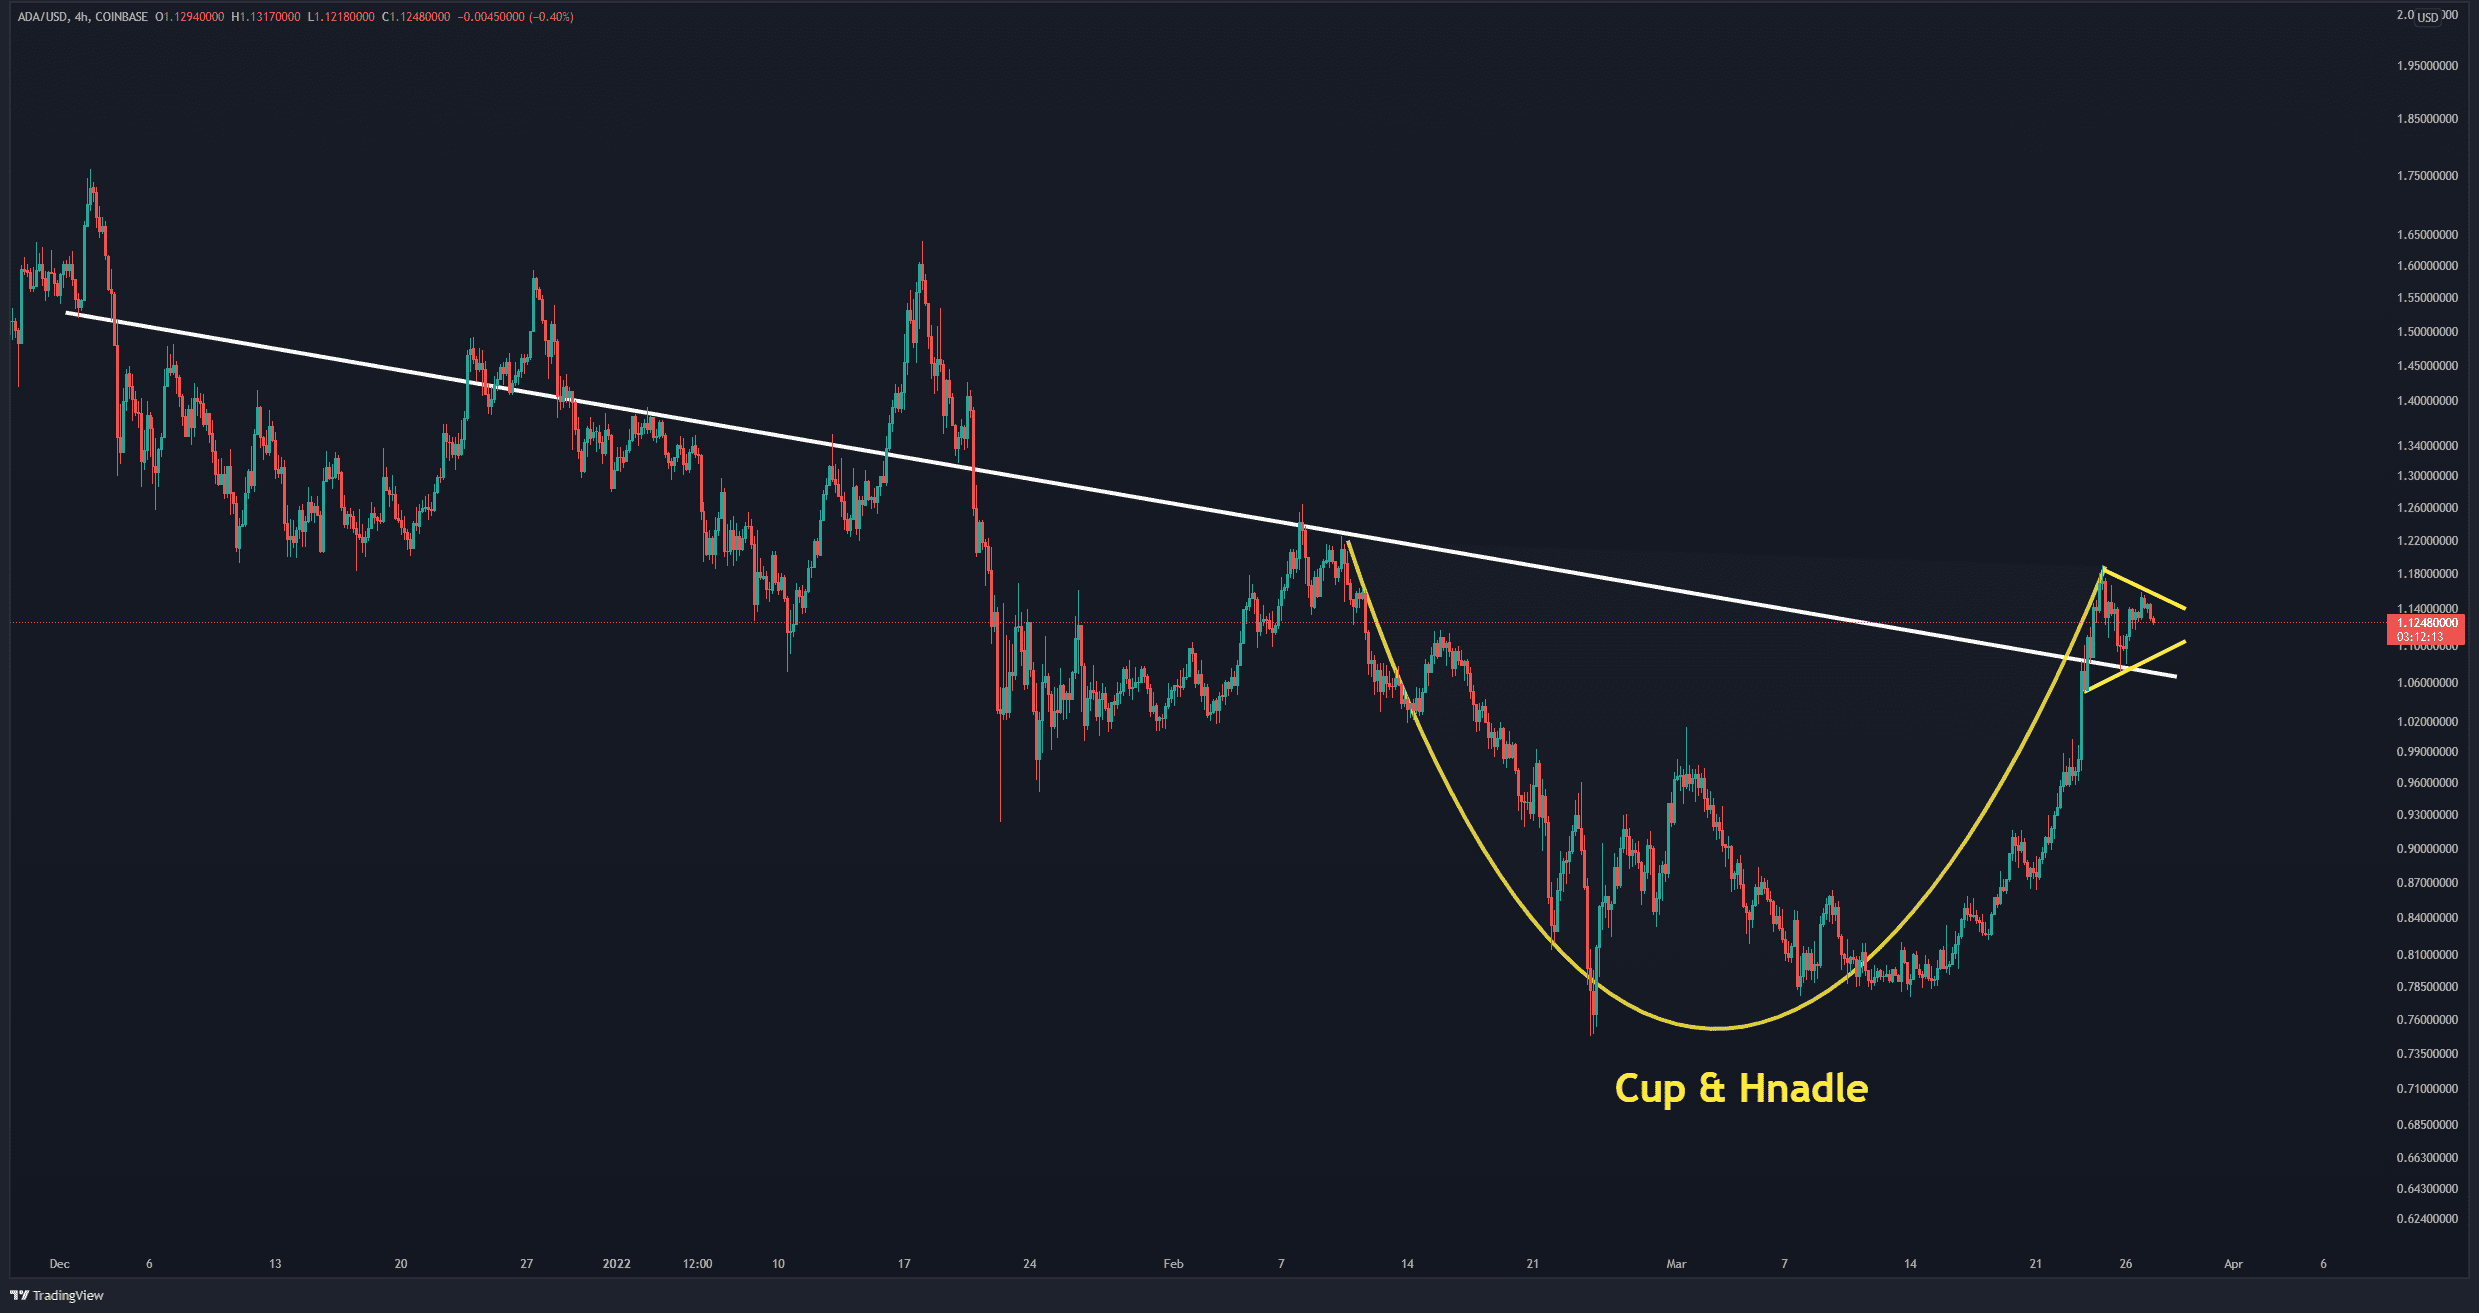
The 4-Hour Chart: Cup and Handle?
On the 4-hour timeframe, Cardano was able to break above the descending trendline (marked by white) that acted as both support and resistance.
As mentioned above, $1.2 got rejected. As of now, Cardano has the potential to form a Cup & Handle pattern, which is a bullish pattern. If the handle is created inside a triangle (marked by yellow) and the price can cross the mentioned resistance, targets above $1.5 seem to be likely.
Short-term Support Levels: $1.7 & $1
Short-term Resistance Levels: $1.2 & $1.35