After recording an all-time high at .10, Cardano entered into a correction that’s ongoing for 200 days so far. Meanwhile, bad news, such as delisting from the eToro exchange, has become a catalyst for further price retracement. Despite the rumors of burn mechanism rollout, there is no significant reaction. Technical Analysis by Grizzly The Daily Chart: Source: TradingViewOn the daily timeframe, ADA is trading in a descending channel (marked by yellow). During the downtrend, the price has not yet formed a higher high, and the red Ichimoku Cloud has been the main barrier. The first major challenge is to cross above the resistance at (marked by blue), which pushes price into the cloud and can lead to a lot of volatility. If Cardano breaks this area, the dynamic
Topics:
CryptoVizArt considers the following as important: ADABTC, ADAUSD, Cardano (ADA) Price, Price Analysis
This could be interesting, too:
Jordan Lyanchev writes Cardano (ADA) Surpasses Dogecoin After 55% Surge
Jordan Lyanchev writes Trump Confirms Work on Strategic Crypto Reserve: XRP, ADA, SOL Included
Dimitar Dzhondzhorov writes Millions of ADA Sold by Cardano Whales During Market Crash – Will the Decline Continue?
Jordan Lyanchev writes Here’s How Cardano’s 17% Weekly Correction Can Help ADA Hit This Cycle: Analyst
After recording an all-time high at $3.10, Cardano entered into a correction that’s ongoing for 200 days so far. Meanwhile, bad news, such as delisting from the eToro exchange, has become a catalyst for further price retracement. Despite the rumors of burn mechanism rollout, there is no significant reaction.
Technical Analysis by Grizzly
The Daily Chart:
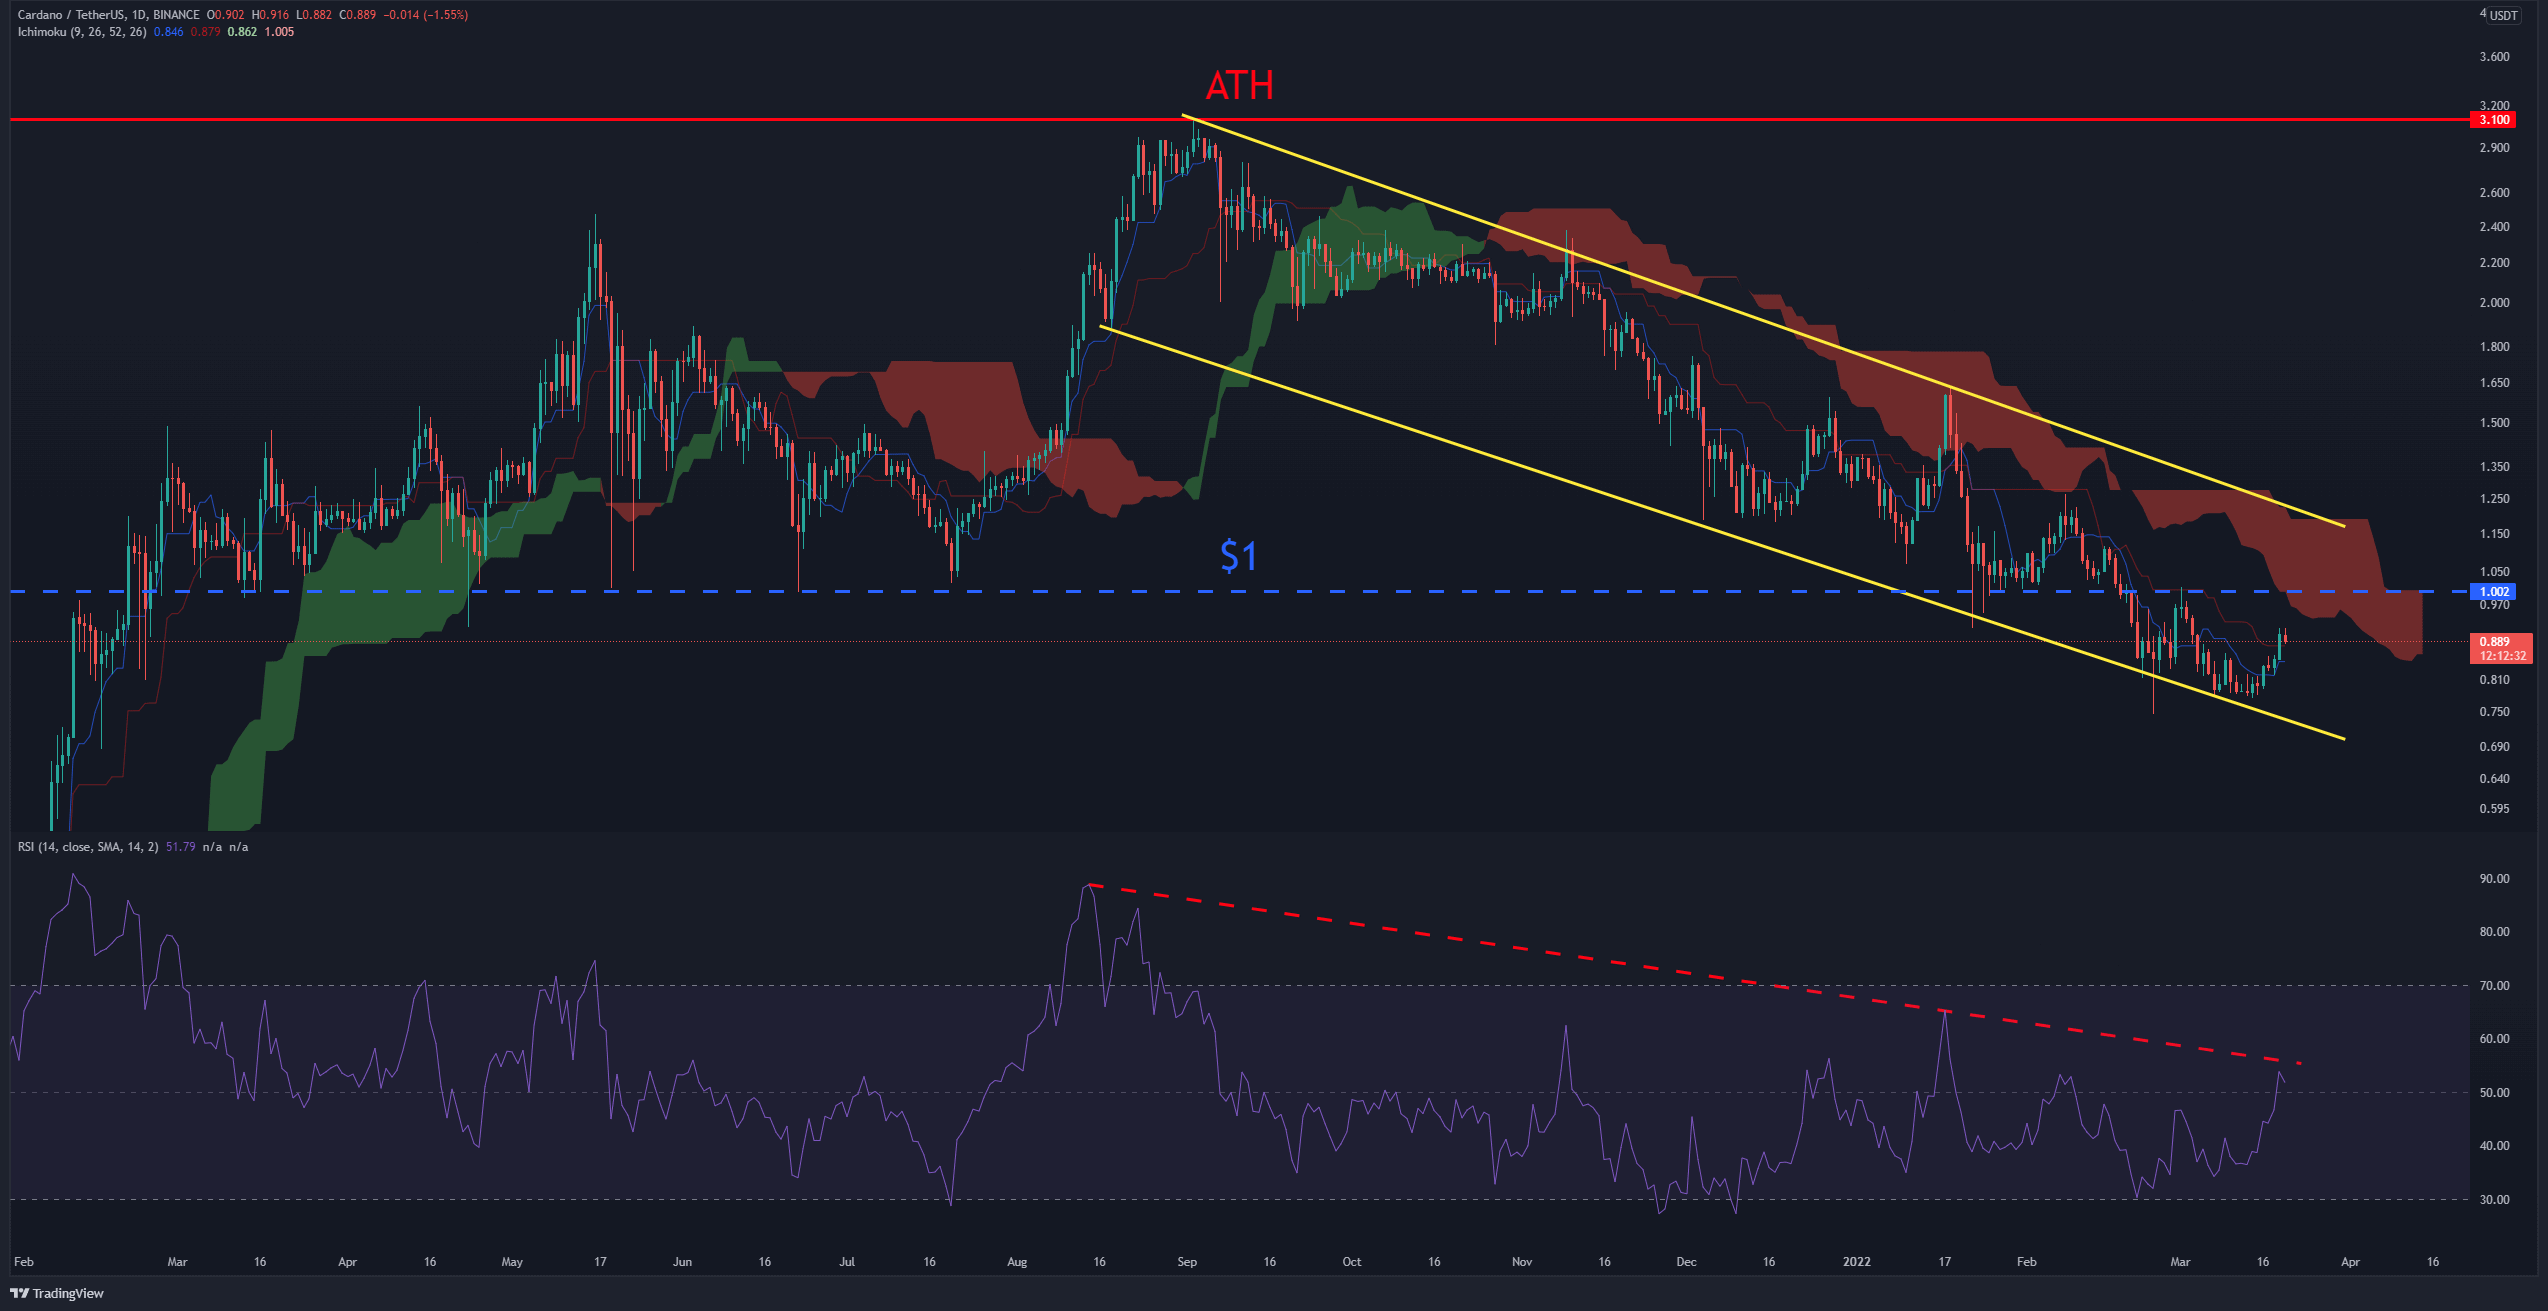
On the daily timeframe, ADA is trading in a descending channel (marked by yellow). During the downtrend, the price has not yet formed a higher high, and the red Ichimoku Cloud has been the main barrier. The first major challenge is to cross above the resistance at $1 (marked by blue), which pushes price into the cloud and can lead to a lot of volatility.
If Cardano breaks this area, the dynamic resistance at $1.2 could be the next challenge. The static support at $0.75 is also a place that the bulls have defended several times.
RSI-14d: Entered the bullish area and is testing the downtrend line.
The 4-Hour Chart:
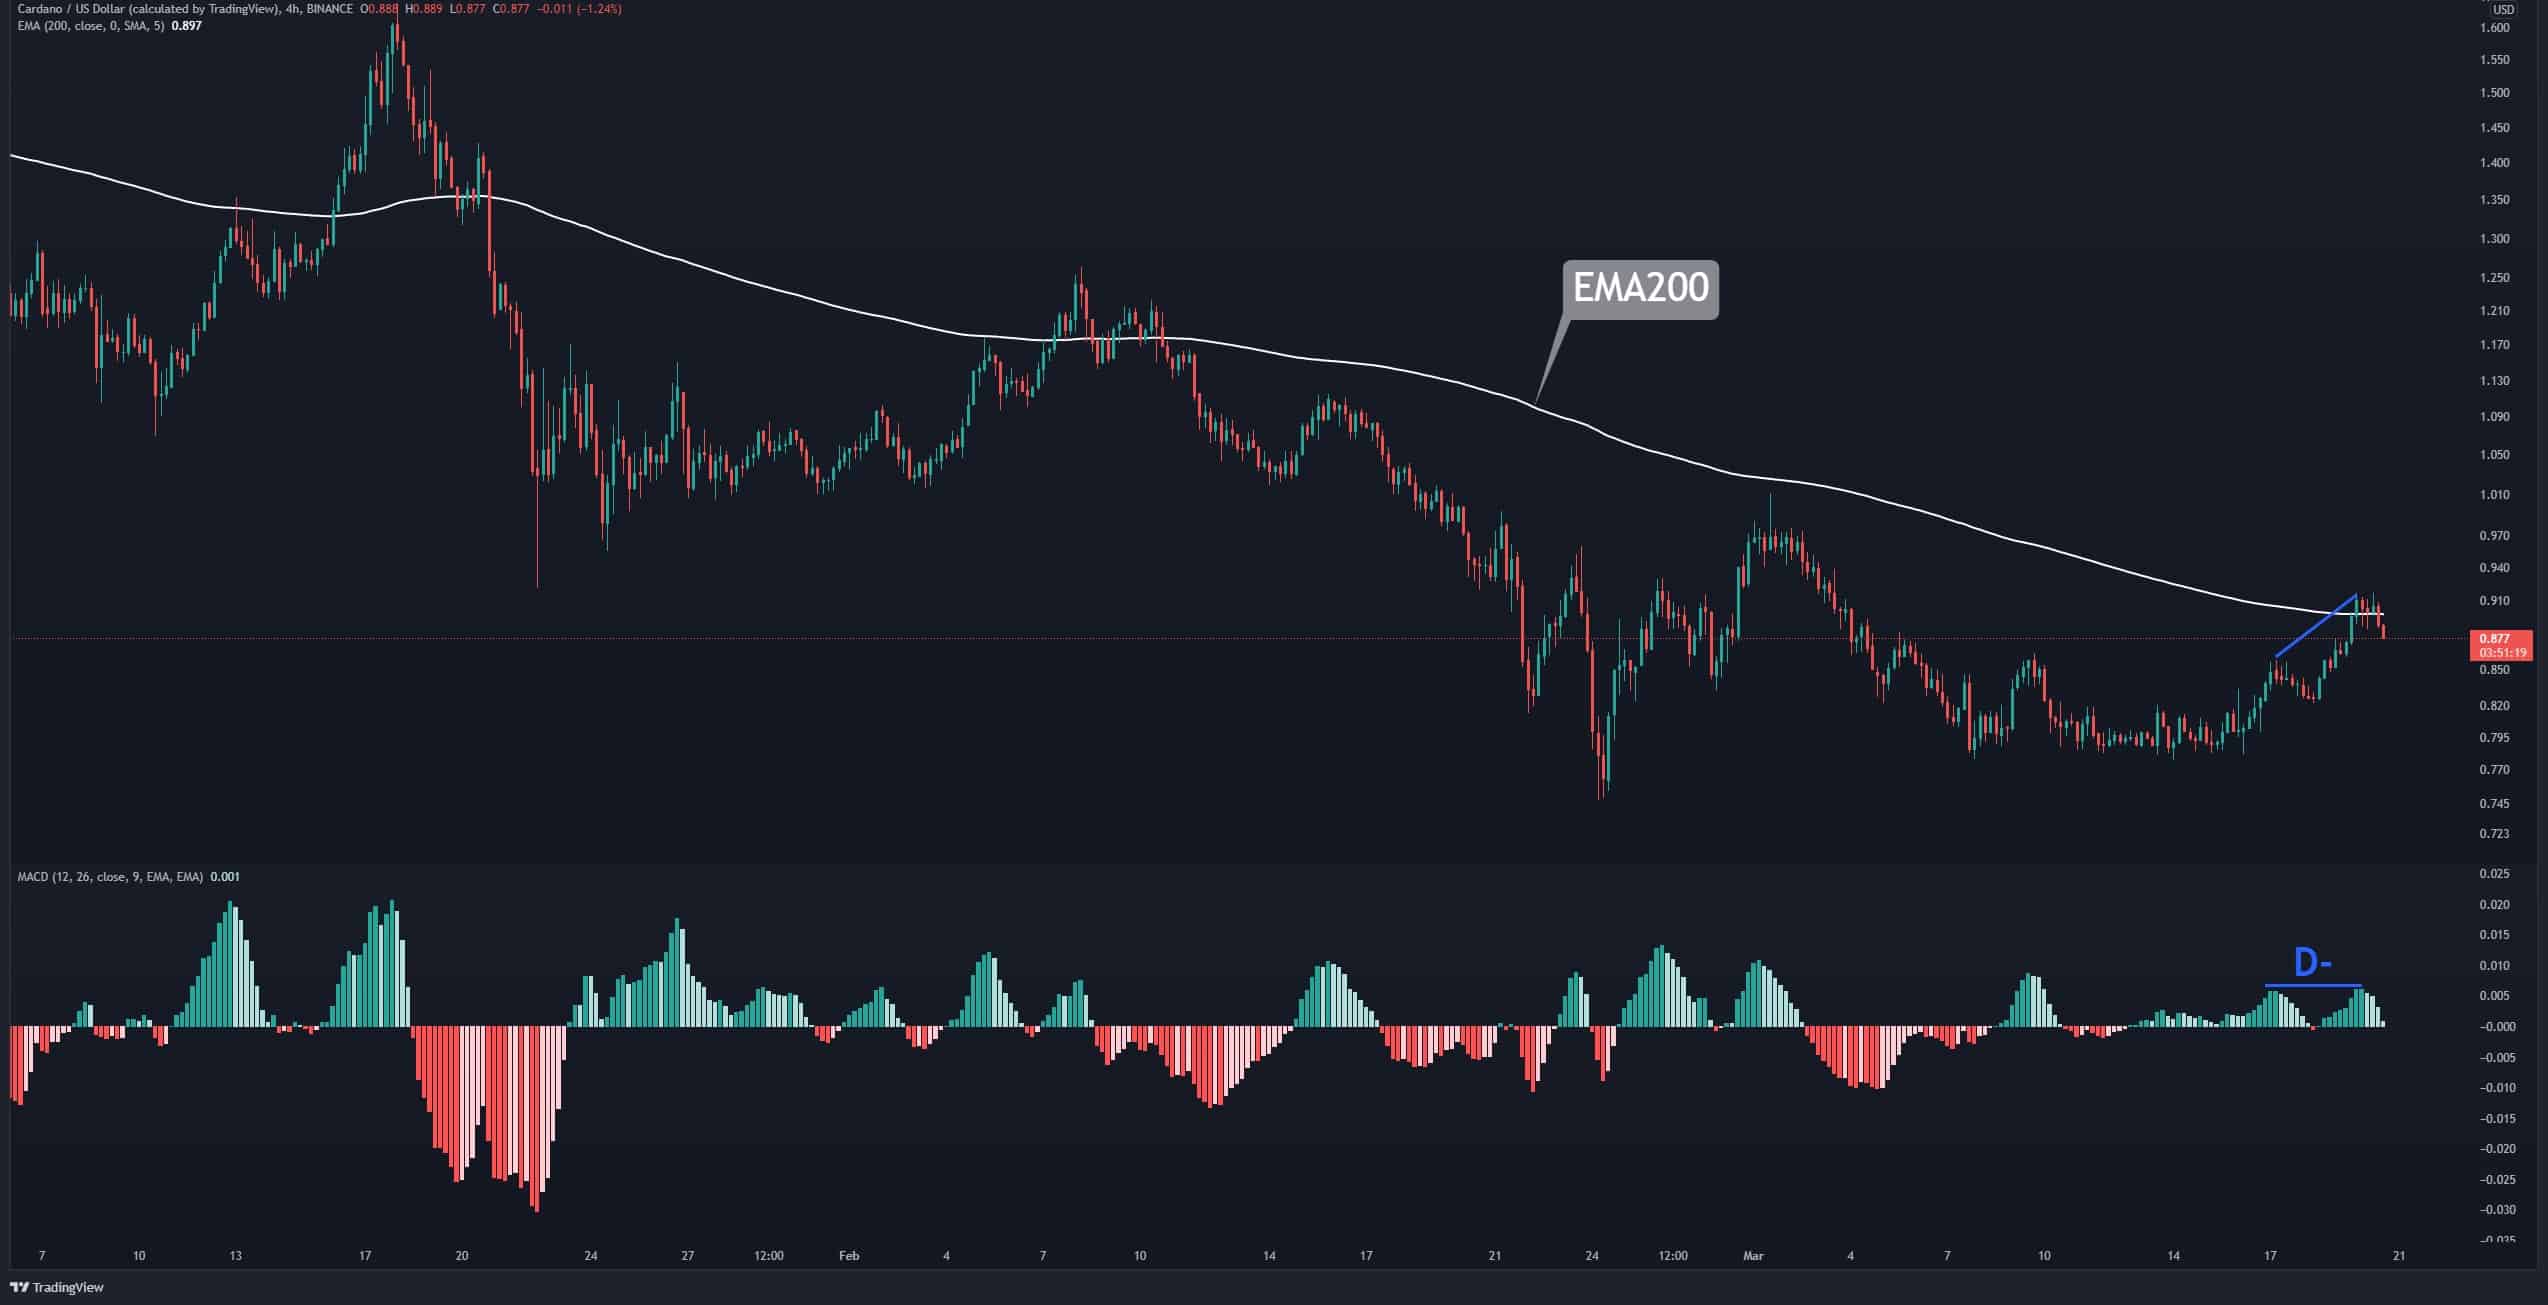
On the 4-hour timeframe, the short-term uptrend, which was formed by creating higher highs and lows, was halted after hitting the EMA200. A MACD divergence also indicates a short-term correction. If it continues, the first support is at $0.85 and then $0.78. If the bulls fail to defend these levels, things will go bad from bad to worse.
Short-term resistances: $0.9 & $1
Short-term supports: $0.85 & $0.78